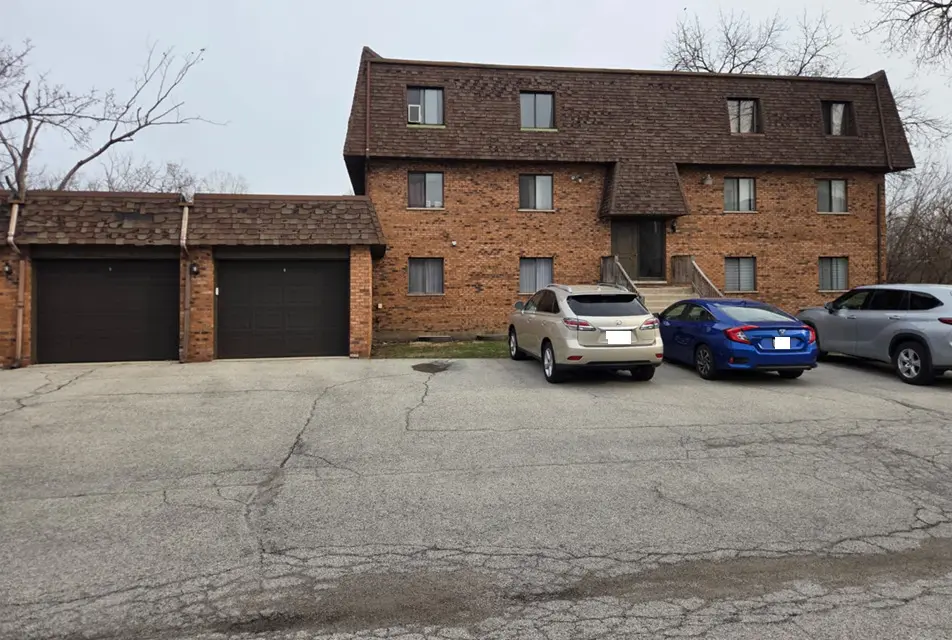
3360 184th St Unit 1E · Homewood, IL
Flood risk 3/10 · Minor
- FEMA flood zone
- X (unshaded)
- Chance of flooding over 30 yrs
- 0.2%
- Est. flood insurance / yr
- $507 – $1,088
Fire risk 1/10 · Minimal
- Est. fire insurance / yr
- $804 – $1,492
Heat risk 3/10 · Minor
- Hot days now (above 101°F)
- 7 days/yr
- Hot days in 30 yrs
- 15 days/yr
Wind risk 2/10 · Minimal
- Chance of severe wind over 30 yrs
- —
Air-quality risk 3/10 · Minor
- Unhealthy air days now
- 4 days/yr
- Unhealthy air days in 30 yrs
- 4 days/yr
Risk factors via First Street. Map © Google.
Why this score? — see what drove the B grade
The composite is a weighted blend of 9 inputs, each scored 0–100. Each bar is that input's sub-score; the figure is the points it added to the 100-point composite (weight × sub-score).
- Cash flow +30.0/30.0
- 1% rule +10.0/10.0
- DSCR +10.0/10.0
- ARV discount +7.5/15.0
- Livability +4.0/5.0
- Condition / age +4.0/5.0
- Rent growth +2.5/5.0
- Schools +2.4/10.0
- Appreciation +0.0/10.0
$113,000
🖨 Deal sheet (PDF) 📄 Offer letter ✓ Due diligence
Listing remarks
Rentable (yes you can rent!) 2 bedroom 2 bath condo. New flooring and paint, nice fireplace. 1st floor, no steps !!! Detached 1 car garage. Homewood-Flossmoor school district. Taxes around $1800 a year. In unit washer and dryer !!! Regular closing no short sale or foreclosure
Key facts
- New flooring
- Nice fireplace
- Detached garage
Tags
Property features AI
Finance
- Other: Property not currently leased; Possession at closing; Some photos are virtually staged
- Financial info: Special service area: No
- HOA & community: Monthly association fee of $304; Association fee covers water, parking, insurance, lawn care, trash (scavenger), and snow removal; Manager off-site; Pets allowed (cats and dogs), maximum pet weight 20 lbs
Exterior
- Parking: Detached, owned garage (1 garage space, 1 total parking space)
- Utilities: Public water; Public sewer
- Home design: Attached single / condo; Entry level: 1; Part of a 6-unit building; Rehab planned/completed in 2026; Building constructed approximately 41–50 years ago
- Construction: Brick construction
- Exterior features: Condo setting; Commuter train access nearby; Condo parcel (zero lot line: no)
Interior
- Kitchen: Kitchen on main level (8 x 14) with terracotta flooring
- Bedrooms: Master bedroom on main level (12 x 12) with full bath; Second bedroom on main level (12 x 14)
- Flooring: Hardwood flooring in living room, dining room, master bedroom, and second bedroom; Terracotta flooring in kitchen
- Bathrooms: Two full bathrooms
- Heating & cooling: Electric heating; Window and wall air conditioning units
- Interior features: Five total rooms; Basement cellar; Wood-burning fireplace in the living room
- Laundry & utility: In-unit laundry (laundry room on main level, 3 x 3)
Neighborhood map
What this means for you Summary
Snapshot
- This is a 2-bed/2.0-bath condo listed at $113k. Condition is rated good.
Deal economics
- At list price, monthly cash flow is $620 ($7k/yr) — positive.
- The deal already cash-flows at list — no discount required.
- Meets the 1% rule at list price ($2k rent vs $113k).
- Cap rate 12.9% vs local median 6.1% in Homewood — top-decile yield for the area; either an underpriced asset or a hidden risk that comps aren't pricing in. Stress-test before assuming the spread holds.
Location & tenants
- Location reads 81/100 on livability (#81 in IL, #1,314 nationally) — a professional / high-income tenant draw. Strengths: commute A+, employment A+, cost of living A+; Watch: amenities F.
- Homewood Flossmoor Chsd 233 (suburban): math 21% / reading 27% proficiency, ranked #272 of 620 in IL (top 44%) — low school quality limits family demand, transient renter base, plan for 1-2y turnover.
- Zoned schools: Flossmoor Hills Elem School (math 22% / reading 27%, grade F, #850 of 2,056 statewide, top 45%, 340 students, 0% FRL); Parker Junior High School (math 16% / reading 21%, grade F, #438 of 665 statewide, top 67%, 858 students, 0% FRL); Homewood-Flossmoor High School (math 21% / reading 27%, grade F, #304 of 693 statewide, top 44%, 2,798 students, 0% FRL).
- Market conditions: 102 active listings in the ZIP; 4 comparable units currently listed for rent nearby; rentals leasing fast (median 13d on market — plan ~1-2 weeks tenant-placement turnaround); 6,272 units permitted in Cook County in 2024 (4,658 in 5+ unit buildings).
Forward outlook
- Local home prices are declining (-3.0%/yr); year-one equity from $781 of loan paydown is wiped out by about $3k of value loss. Plan a longer hold.
- At projected returns (-3.0% appreciation + 3.0% rent growth), your $32k cash investment doubles in ~6 years — after that, you're playing with house money.
Negotiation context
- Only 12 days on market — expect competitive offers; lowballing is unlikely to land.
- 2 sale attempts; this cycle's ask has dropped $36k (24%) from the opening price — seller is motivated, your offer sets the floor, not the list.
Questions for the listing agent
- What does the HOA fee cover, when was the last increase, and are there any pending special assessments or reserve-fund shortfalls?
- Any open or pending special assessments — roof, HVAC, plumbing, elevator, façade? What's the per-unit balance and payoff schedule, and is the seller paying it off at close or rolling it to the buyer?
- Is there a deadline driving the sale (1031 exchange, divorce, estate, relocation)? That informs how much negotiation room exists.
- Schools are D-rated, which usually means shorter tenancies and higher turnover. Who's the typical renter profile here, and what's been the actual vacancy rate?
- What's the average days-on-market for RENTAL listings here right now (not sales)? A rising rental-DOM trend means longer vacancies and softer asking-rent achievability than the comps imply.
- What's the recent tenant-quality profile in this submarket — average credit score on applications, eviction rate, late-payment / NSF rate, and stable-employment percentage? A property-management company in the area should have these aggregated.
- How much new apartment / multifamily construction is in the pipeline within 1–3 miles? Heavy new supply (>2% of stock underway) typically softens rents 12–24 months out; light construction supports rent growth.
Investment metrics
- 1% rule
- 1.91% ✓
- Cap rate
- 12.88%
- Cash-on-cash
- 23.53%
- DSCR
- 2.05
- GRM
- 4.4
CMA / ARV
No comps found within radius.
Projected returns pro-forma
-3.0% appreciation · 3.0% rent growth · sell at horizon
- IRR
- 16.8%
- Equity multiple
- 1.68×
- Total profit
- $21,428
- Equity at exit
- $16,849
- IRR
- 25.4%
- Equity multiple
- 3.23×
- Total profit
- $70,437
- Equity at exit
- $9,770
Cash invested: $31,640 (down + closing). Projections, not guarantees.
Landlord ↔ Tenant lean methodology
- Overall (STATE)
- 43 Moderately Tenant-Leaning
- State Illinois
- 43 Moderately Tenant-Leaning · D+7
- County
- — inherits STATE
- City
- — inherits STATE
ZIP-level market 60430
- Home prices YoY
- -32.1%
- Active inventory
- 102
- Price-to-rent
- 4.4×
Monthly cashflow live
- Estimated rent
- $2,159 medium interval (Pro) →
- Mortgage (P&I)
- −$593
- Tax est. 1.5%
- −$141 /mo · $1,695/yr
- Insurance
- −$47
- HOA
- −$304
- Vacancy / Maint / Mgmt
- −$453
- Net cashflow
- $620
Break-even live
Sensitivity live
| Price | -10% $699 | -5% $660 | +0% $620 | +5% $581 | +10% $542 |
|---|---|---|---|---|---|
| Rent | -10% $450 | -5% $535 | +0% $620 | +5% $706 | +10% $791 |
| Rate | -1.0pp $677 | -0.5pp $649 | base $620 | +0.5pp $591 | +1.0pp $561 |
UW: 25.0% down · 7.5% · 30yr · 1.5% tax · 5.0% vac · 8.0% maint · 8.0% mgmt
Financing live
Cash to close
- Down payment
- $28,250
- Closing costs
- $3,390
- Reserves months
- —
- Total cash needed
- —
Loan-product check · same deal, 3 products live
Conventional
25% down · 7.5% · 30yr
- Down + closing
- —
- Monthly P&I
- —
- Monthly cashflow
- —
- DSCR
- —
- Eligible?
- —
Personal DTI + credit; lowest rate.
DSCR
20% down · 8.5% · 30yr
- Down + closing
- —
- Monthly P&I
- —
- Monthly cashflow
- —
- DSCR
- —
- Eligible?
- —
No personal income docs; deal must DSCR.
Hard money
10% down · 12.0% · 12mo
- Down + closing
- —
- Monthly P&I
- —
- Monthly cashflow
- —
- DSCR
- —
- Eligible?
- —
Short-term bridge; refi at stabilization.
Rent comps 4 comps
| Address | Beds | Baths | Sqft | Rent | $/sqft | DOM | Units | Dist |
|---|---|---|---|---|---|---|---|---|
| 3501 177th St Country Club Hills, IL | 2.0 | 2.0 | 839 | $2,850 | $3.40 | 0d | 1 | 0.84mi |
| 17984 Amherst Ct Country Club Hills, IL | 2.0 | 1.0 | 1000 | $1,900 | $1.90 | 0d | 1 | 1.01mi |
| 2420 183rd St Homewood, IL | 2.0 | 1.0 | 1100 | $1,750 | $1.59 | 12d | 1 | 1.17mi |
| 2640 Flossmoor Rd Unit 2S Flossmoor, IL | 2.0 | 1.5 | 800 | $1,800 | $2.25 | 16d | 1 | 1.28mi |
HOA detail condo
- Monthly dues
- $304 · $3,648/yr
- Assessments
- None detected in remarks — confirm with the listing agent.
Listing history 27 events
-
2026-06-21days on market $113,000 Active 12 DOM
-
2026-06-18days on market $113,000 Active 9 DOM
-
2026-06-17days on market $113,000 Active 8 DOM
-
2026-06-16days on market $113,000 Active 7 DOM
-
2026-06-15days on market $113,000 Active 6 DOM
-
2026-06-13days on market $113,000 Active 4 DOM
-
2026-06-10days on market $113,000 Active 1 DOM
-
2026-06-09days on market $113,000 Active 101 DOM
-
2026-06-08pricedays on market $113,000 Active 100 DOM
-
2026-06-07days on market $116,000 Active 99 DOM
-
2026-06-04days on market $116,000 Active 96 DOM
-
2026-06-03days on market $116,000 Active 95 DOM
-
2026-06-02pricedays on market $116,000 Active 94 DOM
-
2026-06-01days on market $118,000 Active 93 DOM
-
2026-05-31days on market $118,000 Active 92 DOM
-
2026-05-18status Active
-
2026-05-08status Pending
-
2026-04-29price $119,000
-
2026-04-22price $121,000
-
2026-04-15price $123,000
-
2026-04-09price $126,000
-
2026-04-03price $129,000
-
2026-03-25price $135,000
-
2026-03-18price $139,000
-
2026-03-11price $145,000
-
2026-03-03price $147,000
-
2026-02-18$149,000 Active
ⓘ Source: listings_history table (triggers on properties + properties_extension) + one-shot
backfill from property_details.listing_events for pre-trigger history.
Climate risk First Street
- Flood 3/10 Moderate FEMA zone X (unshaded) · 20% chance over 30 yrs
- Wildfire 1/10 Low
- Heat 3/10 Moderate 7 d/yr ≥101°F today · 15 d/yr by 30 yrs out
- Wind 2/10 Low
- Air quality 3/10 Moderate 4 unhealthy d/yr today · 4 by 30 yrs out
Nearby sold comps map
Loading sold comps map…
Walkable amenities ~0.75 mi
Loading nearby amenities…
Taxation est. · year 1
- Rental income
- $25,905
- − Mortgage interest
- −$6,330
- − Property taxes
- −$1,695
- − Insurance
- −$565
- − Repairs & maintenance
- −$2,072
- − Management
- −$2,072
- − HOA
- −$3,648
- − Depreciation
- −$3,287
- Taxable income
- $6,235
- Est. tax owed @ 24.0%
- −$1,496
- After-tax cash flow
- $5,949/yr
For passive investors: Depreciation is non-cash, so a rental often shows a tax loss while cash-flowing — sheltering income. Rental losses are passive: they offset passive income freely, and up to $25,000/yr can offset ordinary (W-2) income if you actively participate and your MAGI is under $100k (phasing out to $0 by $150k); unused losses carry forward. On sale, claimed depreciation is recaptured at up to 25%, and gains may owe capital-gains tax (a 1031 exchange can defer both). Figures are a year-1 estimate at your 24.0% rate — not tax advice; consult a CPA.
Condition & rehab AI · 12 photos
This 2-bedroom, 2-bathroom condo is in good condition with recent updates, including new flooring and paint. It's move-in ready and offers a good return on investment.
Value-add opportunities
- Both Painting exterior and interior walls — Enhances curb appeal and interior aesthetics.
- Both Landscaping and curb appeal improvements — Improves curb appeal and enhances property value.
- Both New flooring in common areas — Enhances aesthetics and functionality in high-traffic areas.
- Both New paint in common areas — Enhances aesthetics and functionality in high-traffic areas.
Renovation cost estimate screening
Value-add ROI direction
- Both Painting exterior and interior walls — Enhances curb appeal and interior aesthetics. ↑
- Both Landscaping and curb appeal improvements — Improves curb appeal and enhances property value. ↑
- Both New flooring in common areas — Enhances aesthetics and functionality in high-traffic areas. ↑
- Both New paint in common areas — Enhances aesthetics and functionality in high-traffic areas. ↑
ⓘ Cost ranges are severity-bucket heuristics (US national rule-of-thumb). Get contractor quotes + a written scope before underwriting a rehab budget.
Schools (NCES district)
- District
- Homewood Flossmoor Chsd 233
- NCES district ID
- 1719560
- Math proficiency
- 21% ▼ -15.00%
- Reading proficiency
- 27% ▼ -13.00%
- Median HH income
- $83,564
- Composite
- 24.42/100
- National rank
- #7681
- State rank
- #272 of 620 in IL
Livability — Homewood
- Score
- 81/100
- State rank
- #81
- US rank
- #1314
Category grades
Schools grade is shown separately in the Schools card above.
Census & demographics
- Census place
- Homewood, IL
- City population
- 19,993
- Population (ZIP)
- 19,993
Population outlook (Cook County) Hauer SSP2
- Today (2025)
- 5,347,519 people
- By 2030
- 5,357,703 · +0.2%
- By 2040
- 5,324,924 · -0.4%
- By 2050
- 5,230,762 · -2.2%
- By 2075
- 4,785,735 · -10.5%
- By 2100
- 4,188,836 · -21.7%
Race, ethnicity, and origin ACS 2023
- Neighborhood character
- Diverse neighborhood (Simpson 0.62)
- Race & ethnicity
- Black 44% White 42% Hispanic / Latino 9% Two or more races 6% Asian 1%
- Hispanic origin (detail)
- Mexican 7%
- Common ancestry
- Romanian 5% Iranian 2% Italian 2%
- Foreign-born
- 6% · Canada, Dominican Republic
- Languages at home
- 91% English-only · Spanish 5% Russian/Polish/Slavic 1% German/W. Germanic 1%
Political lean MEDSL · Cook
- 2024 margin
- Solid D (+42.0) · D 70.4% · R 28.4% · Other 1.2%
- 2008→2024 swing
- -11.4pp toward R · 2008: 53.4pp · 2024: 42.0pp
- All cycles
- 2024: D+42.0 2020: D+50.3 2016: D+53.0 2012: D+49.4 2008: D+53.4
Not yet ingested
- Civics
- —
Market trends
- HPI YoY
- ▼ -105.00%
- Current HPI
- 222.2923
- Rent YoY
- —
- Metro
- —
- State GDP YoY
- ▲ 1.59%
- F500 in state
- 60
Industry mix (Fortune 500 HQ in IL)
| Industry | F500 HQs | Revenue |
|---|---|---|
| Insurance | 4 | $201B |
|
||
| Consumer Goods | 4 | $87B |
|
||
| Industrial Machinery | 3 | $64B |
|
||
| Healthcare | 2 | $55B |
|
||
| Retail / Pharmacy | 1 | $148B |
|
||
| Agriculture / Food | 1 | $86B |
|
||
Price history
-20.1% since first listed12 events — show timeline
- 2026-05-18 Relisted — MRED as Distributed by MLS Grid
- 2026-05-08 Pending — MRED as Distributed by MLS Grid
- 2026-04-29 Price Changed $119,000 MRED as Distributed by MLS Grid
- 2026-04-22 Price Changed $121,000 MRED as Distributed by MLS Grid
- 2026-04-15 Price Changed $123,000 MRED as Distributed by MLS Grid
- 2026-04-09 Price Changed $126,000 MRED as Distributed by MLS Grid
- 2026-04-03 Price Changed $129,000 MRED as Distributed by MLS Grid
- 2026-03-25 Price Changed $135,000 MRED as Distributed by MLS Grid
- 2026-03-18 Price Changed $139,000 MRED as Distributed by MLS Grid
- 2026-03-11 Price Changed $145,000 MRED as Distributed by MLS Grid
- 2026-03-03 Price Changed $147,000 MRED as Distributed by MLS Grid
- 2026-02-18 Listed $149,000 MRED as Distributed by MLS Grid
Cash-flow waterfall
monthlySold comps — $/sqft
last 12 mo · ≤1 miLoading sold comps…