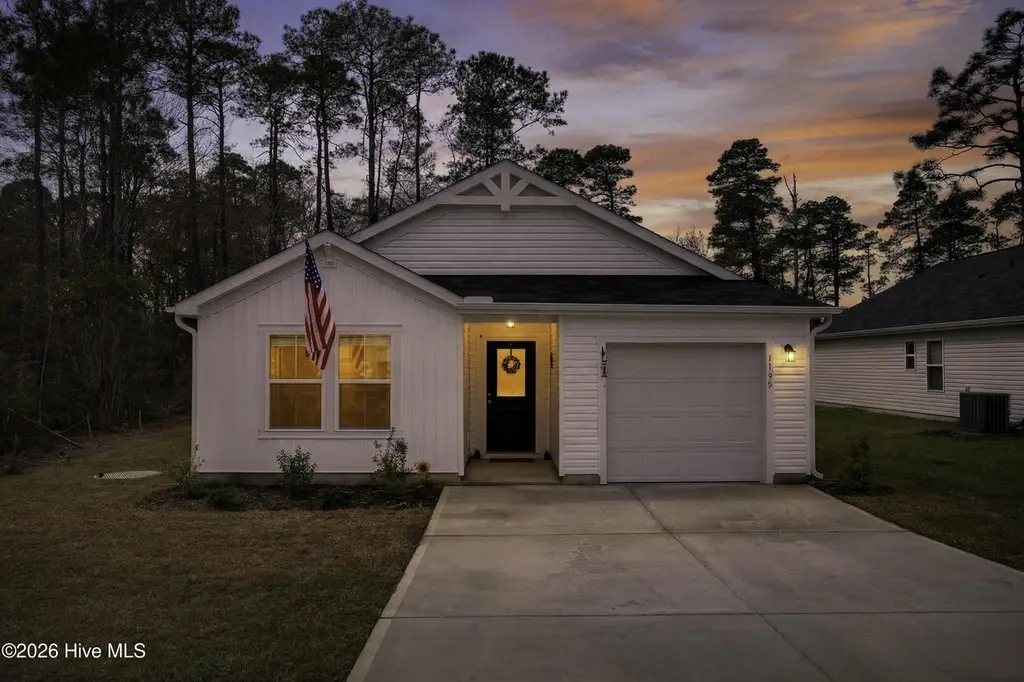
1795 W Coronado Ave SE · Varnamtown, NC
Flood risk 6/10 · Moderate
- FEMA flood zone
- X (unshaded)
- Chance of flooding over 30 yrs
- 0.7%
- Est. flood insurance / yr
- $507 – $1,088
Fire risk 7/10 · Major
- Est. fire insurance / yr
- $906 – $1,684
Heat risk 9/10 · Severe
- Hot days now (above 104°F)
- 7 days/yr
- Hot days in 30 yrs
- 19 days/yr
Wind risk 8/10 · Major
- Chance of severe wind over 30 yrs
- 99.0%
Air-quality risk 1/10 · Minimal
- Unhealthy air days now
- 0 days/yr
- Unhealthy air days in 30 yrs
- 0 days/yr
Risk factors via First Street. Map © Google.
Why this score? — see what drove the D grade
The composite is a weighted blend of 9 inputs, each scored 0–100. Each bar is that input's sub-score; the figure is the points it added to the 100-point composite (weight × sub-score).
- Cash flow +13.9/30.0
- ARV discount +9.4/15.0
- DSCR +4.2/10.0
- Schools +3.9/10.0
- Livability +3.0/5.0
- 1% rule +2.9/10.0
- Rent growth +2.5/5.0
- Condition / age +2.5/5.0
- Appreciation +0.0/10.0
$275,000
🖨 Deal sheet (PDF) 📄 Offer letter ✓ Due diligence
Listing remarks
Beautiful 3BR/2BA home located just minutes from the beaches of Oak Island. This home features an open floor plan ideal for everyday living and entertaining. The kitchen offers granite countertops, stainless steel appliances, and a large island that overlooks the main living area. The spacious primary suite includes a large walk-in closet and an en-suite bath with double sinks and a generous walk-in shower. Enjoy peaceful pond views from the private back patio. Additional highlights include a low HOA of only $600 per year and no city taxes. A great opportunity for full-time living, a second home, or an investment property near the beach.
Key facts
- Open floor plan
- Walk-in closet
- Large island
Tags
Property features AI
Finance
- Other: Zoning: Co-Sbr-6000
- HOA & community: Homeowners association with $600 annual fee (about $50/month); Subdivision: Olde Georgetowne
Exterior
- Parking: Attached garage (1 car); Paved parking; Total 1 parking space
- Utilities: Public water; Sewer available; Water available
- Home design: Single family residence; One level / single-story; Entry level: 1
- Construction: Vinyl siding and frame construction; Shingle roof; Slab foundation; Built with irregular lot dimensions
- Exterior features: Patio; Porch; Has a view; Paved road access; Private road frontage; Street lights in the community
Interior
- Kitchen: Kitchen island
- Bedrooms: Master downstairs
- Bathrooms: 2 full bathrooms
- Heating & cooling: Central air conditioning; Electric heating; Heat pump
- Interior features: Master bedroom on the main level; Walk-in closet(s); Kitchen island; Window coverings
Neighborhood map
What this means for you Summary
Snapshot
- This is a 3-bed/2.0-bath single-family listed at $275k.
Deal economics
- At list price, monthly cash flow is $28 ($337/yr) — positive.
- The deal already cash-flows at list — no discount required.
- To meet the 1% rule (rent ≥ 1% of price), the offer needs to be $217k (21.1% below list).
- Recommended offer: $217k (21.1% below list) — sets the bar for 1% rule.
- Cap rate 6.4% vs local median 3.6% in Varnamtown — top-decile yield for the area; either an underpriced asset or a hidden risk that comps aren't pricing in. Stress-test before assuming the spread holds.
Location & tenants
- Location reads 60/100 on livability (#521 in NC) — a middle-class / working-renter tenant base. Strengths: cost of living A+, housing A, employment B; Watch: crime D, health & safety D, amenities F.
- Brunswick County Schools (rural): math 45% / reading 47% proficiency, ranked #82 of 178 in NC (top 46%) — families likely to look elsewhere, expect single-tenant / working-renter base with shorter leases.
- Zoned schools: Virginia Williamson Elem (math 50% / reading 49%, grade D, #417 of 1,410 statewide, top 32%, 502 students, 99% FRL); Cedar Grove Middle (math 30% / reading 36%, grade F, #305 of 475 statewide, top 65%, 434 students, 99% FRL); South Brunswick High (math 62% / reading 57%, grade C+, #216 of 535 statewide, top 43%, 1,172 students, 100% FRL) — zoned schools average 99% FRL vs 53% district-wide (46 pts higher); higher-poverty schools than district average — tighter screening recommended.
- Market conditions: 575 active listings in the ZIP; 4 comparable units currently listed for rent nearby; rentals at typical pace (median 26d on market — plan ~3-4 weeks tenant-placement turnaround); 6,112 units permitted in Brunswick County in 2024 (990 in 5+ unit buildings).
- This rent runs 38% of the median local income ($69k/yr) — at the standard rent-burdened threshold; future hikes will face affordability resistance.
Forward outlook
- Local home prices are declining (-3.0%/yr); year-one equity from $2k of loan paydown is wiped out by about $8k of value loss. Plan a longer hold.
- Brunswick County population projected at +36% by 2050 — long-run rental-demand tailwind backs the buy-and-hold thesis.
Negotiation context
- It's been on market 51 days — a 3% lower offer ($267k) is reasonable based on typical stale-listing flexibility.
- Current owner paid $210k; 31% above their basis — modest negotiation headroom, anchor on the comps not their cost.
Risks & watch-outs
- Climate carrying-cost: major flood risk; severe wind risk, 99% chance of damaging wind over 30y; major wildfire risk; extreme-heat days projected 7→19/yr by 2055 (HVAC capex compounding) — expect insurance premiums to compound above CPI over the hold.
Questions for the listing agent
- It's been on market 51 days. Have you received any prior offers? Is the seller open to a 21% concession, seller financing, or rate buy-down credit?
- What does the HOA fee cover, when was the last increase, and are there any pending special assessments or reserve-fund shortfalls?
- Is there a deadline driving the sale (1031 exchange, divorce, estate, relocation)? That informs how much negotiation room exists.
- Schools are F-rated, which usually means shorter tenancies and higher turnover. Who's the typical renter profile here, and what's been the actual vacancy rate?
- Crime grade is D in this area — have there been break-ins, vandalism, or insurance claims at this property in the last 3 years? What carrier currently insures it and at what premium?
- The area grade is low — what's the realistic commute time and amenity access for the typical tenant pool here? Any planned neighborhood developments (good or bad) we should know about?
- What's the average days-on-market for RENTAL listings here right now (not sales)? A rising rental-DOM trend means longer vacancies and softer asking-rent achievability than the comps imply.
- What's the recent tenant-quality profile in this submarket — average credit score on applications, eviction rate, late-payment / NSF rate, and stable-employment percentage? A property-management company in the area should have these aggregated.
- How much new for-sale + rental construction is in the pipeline within 1–3 miles? Heavy new supply typically softens prices + rents 12–24 months out; constrained supply supports both.
Investment metrics
- 1% rule
- 0.79% ✗
- Cap rate
- 6.42%
- Cash-on-cash
- 0.44%
- DSCR
- 1.02
- GRM
- 10.6
CMA / ARV
- ARV (on-the-fly)
- $287,280
- Comps found
- 12
Show comp detail 12 sales within ~0.75 mi
| Address | Dist | Beds/Ba | Sqft | Sold | Price | $/sf | Match |
|---|---|---|---|---|---|---|---|
| 1508 New Sun Dr SE | 0.26mi | 3/2.0 | 1,529 (+1%) | 1mo | $250,000 | $164 | 86 |
| 1696 W Coronado Ave SE | 0.21mi | 3/2.0 | 1,519 (-0%) | 8mo | $250,000 | $165 | 84 |
| 1609 Meridian Forest Dr SE | 0.56mi | 3/2.0 | 1,618 (+6%) | 2mo | $290,000 | $179 | 62 |
| 1534 Maltwood Ct SE | 0.74mi | 3/2.0 | 1,493 (-2%) | 1mo | $269,000 | $180 | 61 |
| 1620 Lightered Knot Ct | 0.64mi | 3/2.0 | 1,501 (-1%) | 11mo | $283,442 | $189 | 59 |
| 1616 Lightered Knot Ct | 0.64mi | 3/2.0 | 1,618 (+6%) | 4mo | $264,000 | $163 | 56 |
| 1590 Lightered Knot Ct SE | 0.60mi | 3/2.0 | 1,656 (+9%) | 2mo | $315,000 | $190 | 56 |
| 1592 Carmelina Dr SE | 0.33mi | 3/2.0 | 1,698 (+12%) | 12mo | $315,000 | $186 | 55 |
| 1561 Pleasant Hollow Ct SE | 0.55mi | 3/2.0 | 1,642 (+8%) | 11mo | $310,000 | $189 | 52 |
| 1401 Pindo Ct SE | 0.57mi | 3/2.0 | 1,709 (+12%) | 5mo | $425,650 | $249 | 48 |
| 1641 Culdees Ln SE | 0.56mi | 3/2.0 | 1,370 (-10%) | 13mo | $280,000 | $204 | 47 |
| 1505 Pleasant Hollow Ct SE | 0.56mi | 3/2.5 | 1,360 (-10%) | 15mo | $258,900 | $190 | 42 |
Match score weights: distance 35% · size 25% · config 20% · recency 20%. Top-matched comps best support the ARV.
Projected returns pro-forma
-3.0% appreciation · 3.0% rent growth · sell at horizon
- IRR
- -15.7%
- Equity multiple
- 0.44×
- Total profit
- $-42,871
- Equity at exit
- $41,003
- IRR
- -7.3%
- Equity multiple
- 0.54×
- Total profit
- $-35,427
- Equity at exit
- $23,777
Cash invested: $77,000 (down + closing). Projections, not guarantees.
Landlord ↔ Tenant lean methodology
- Overall (STATE)
- 85 Strongly Landlord-Friendly
- State North Carolina
- 85 Strongly Landlord-Friendly · R+3
- County
- — inherits STATE
- City
- — inherits STATE
ZIP-level market 28422
- Home prices YoY
- -23.8%
- Active inventory
- 575
- Price-to-rent
- 10.6×
Monthly cashflow live
- Estimated rent
- $2,170 medium interval (Pro) →
- Mortgage (P&I)
- −$1,442
- Tax from tax record
- −$80 /mo · $958/yr
- Insurance
- −$115
- HOA
- −$50
- Vacancy / Maint / Mgmt
- −$456
- Net cashflow
- $28
Break-even live
Sensitivity live
| Price | -10% $184 | -5% $106 | +0% $28 | +5% $-50 | +10% $-128 |
|---|---|---|---|---|---|
| Rent | -10% $-143 | -5% $-58 | +0% $28 | +5% $114 | +10% $200 |
| Rate | -1.0pp $167 | -0.5pp $98 | base $28 | +0.5pp $-43 | +1.0pp $-116 |
UW: 25.0% down · 7.5% · 30yr · 1.5% tax · 5.0% vac · 8.0% maint · 8.0% mgmt
Financing live
Cash to close
- Down payment
- $68,750
- Closing costs
- $8,250
- Reserves months
- —
- Total cash needed
- —
Loan-product check · same deal, 3 products live
Conventional
25% down · 7.5% · 30yr
- Down + closing
- —
- Monthly P&I
- —
- Monthly cashflow
- —
- DSCR
- —
- Eligible?
- —
Personal DTI + credit; lowest rate.
DSCR
20% down · 8.5% · 30yr
- Down + closing
- —
- Monthly P&I
- —
- Monthly cashflow
- —
- DSCR
- —
- Eligible?
- —
No personal income docs; deal must DSCR.
Hard money
10% down · 12.0% · 12mo
- Down + closing
- —
- Monthly P&I
- —
- Monthly cashflow
- —
- DSCR
- —
- Eligible?
- —
Short-term bridge; refi at stabilization.
Rent comps 4 comps
| Address | Beds | Baths | Sqft | Rent | $/sqft | DOM | Units | Dist |
|---|---|---|---|---|---|---|---|---|
| 2208 Lakefront Dr SE Bolivia, NC | 3.0–4.0 | 2.0–2.5 | 1595 | $1,825 | $1.14 | 16d | 61 | 1.02mi |
| 4024 Cypress Forest Way Bolivia, NC | 3.0 | 2.0 | 1256 | $1,700 | $1.35 | 25d | 1 | 1.21mi |
| 2157 Grande Palms Trl SE Bolivia, NC | 3.0 | 2.0 | 1256 | $1,850 | $1.47 | 25d | 1 | 1.32mi |
| 514 Silky Oak Dr SE Bolivia, NC | 3.0 | 2.0 | 1672 | $2,400 | $1.44 | 25d | 1 | 1.34mi |
HOA detail
- Monthly dues
- $50 · $600/yr
Listing history 6 events
-
2026-05-06status Pending
-
2026-03-16$275,000 Active
-
2024-05-09soldstatus $210,000
-
2022-09-21soldstatus $1,360,000
-
2018-08-31soldstatus $8,386,000
-
2011-08-04soldstatus $1,953,000
ⓘ Source: listings_history table (triggers on properties + properties_extension) + one-shot
backfill from property_details.listing_events for pre-trigger history.
Tax reassessment forecast NC · Resets to sale price
- Current annual tax
- $958 · $80/mo
- Projected year-2 tax
- $2,255 · $188/mo
- Expected delta
- +$1,297/yr (+$108/mo · 135.3%)
ⓘ Screening estimate from a state-policy table — verify with the county assessor before closing.
Climate risk First Street
- Flood 6/10 Major FEMA zone X (unshaded) · 70% chance over 30 yrs
- Wildfire 7/10 Severe
- Heat 9/10 Extreme 7 d/yr ≥104°F today · 19 d/yr by 30 yrs out
- Wind 8/10 Severe 99% chance of damaging wind over 30 yrs
- Air quality 1/10 Low 0 unhealthy d/yr today · 0 by 30 yrs out
Nearby sold comps map
Loading sold comps map…
Walkable amenities ~0.75 mi
Loading nearby amenities…
Taxation est. · year 1
- Rental income
- $26,046
- − Mortgage interest
- −$15,404
- − Property taxes
- −$958
- − Insurance
- −$1,375
- − Repairs & maintenance
- −$2,084
- − Management
- −$2,084
- − HOA
- −$600
- − Depreciation
- −$8,000
- Taxable loss
- −$4,459
- Est. tax savings @ 24.0%
- +$1,070
- After-tax cash flow
- $1,407/yr
For passive investors: Depreciation is non-cash, so a rental often shows a tax loss while cash-flowing — sheltering income. Rental losses are passive: they offset passive income freely, and up to $25,000/yr can offset ordinary (W-2) income if you actively participate and your MAGI is under $100k (phasing out to $0 by $150k); unused losses carry forward. On sale, claimed depreciation is recaptured at up to 25%, and gains may owe capital-gains tax (a 1031 exchange can defer both). Figures are a year-1 estimate at your 24.0% rate — not tax advice; consult a CPA.
Schools (NCES district)
- District
- Brunswick County Schools
- NCES district ID
- 3700420
- Math proficiency
- 45% ▲ 4.00%
- Reading proficiency
- 47% ▲ 4.00%
- Median HH income
- $47,494
- Composite
- 39.23/100
- National rank
- #4011
- State rank
- #82 of 178 in NC
Livability — Varnamtown
- Score
- 60/100
- State rank
- #521
- US rank
- #19194
Category grades
Schools grade is shown separately in the Schools card above.
Census & demographics
- County
- Brunswick County · 131,536 people
- Metro
- Myrtle Beach-Conway-North Myrtle Beach, SC-NC
- Population (ZIP)
- 10,059
- Household income
- $69,412
- Rent vs Own
- Severe rent burden
- 243.0
Population outlook (Brunswick County) Hauer SSP2
- Today (2025)
- 152,111 people
- By 2030
- 165,705 · +8.9%
- By 2040
- 188,494 · +23.9%
- By 2050
- 206,228 · +35.6%
- By 2075
- 237,876 · +56.4%
- By 2100
- 251,451 · +65.3%
Race, ethnicity, and origin ACS 2023
- Neighborhood character
- Predominantly White (80%)
- Race & ethnicity
- White 80% Black 9% Two or more races 8% Hispanic / Latino 3% Native American 1%
- Common ancestry
- Slovak 4% Lithuanian 3% Romanian 2%
- Foreign-born
- 3% · Canada
- Languages at home
- 95% English-only · Spanish 4%
Political lean MEDSL · Brunswick
- 2024 margin
- Strong R (+24.9) · D 37.2% · R 62.0%
- 2008→2024 swing
- -6.9pp toward R · 2008: -17.9pp · 2024: -24.9pp
- All cycles
- 2024: R+24.9 2020: R+25.0 2016: R+28.7 2012: R+22.2 2008: R+17.9
Not yet ingested
- Civics
- —
Market trends
- HPI YoY
- ▼ -44.19%
- Current HPI
- 141.1956
- Rent YoY
- —
- Metro
- Myrtle Beach-Conway-North Myrtle Beach, SC-NC
- State GDP YoY
- ▲ 3.28%
- F500 in state
- 26
Industry mix (Fortune 500 HQ in NC)
| Industry | F500 HQs | Revenue |
|---|---|---|
| Financial Services | 2 | $213B |
|
||
| Retail | 2 | $95B |
|
||
| Industrial Conglomerate | 1 | $38B |
|
||
| Metals / Steel | 1 | $35B |
|
||
| Utilities | 1 | $30B |
|
||
| Industrial Machinery | 1 | $19B |
|
||
Price history
-85.9% since first listed6 events — show timeline
- 2026-05-06 Pending — Hive MLS
- 2026-03-16 Listed $275,000 Hive MLS
- 2024-05-09 Sold (Public Records) $210,000 Public Records
- 2022-09-21 Sold (Public Records) $1,360,000 Public Records
- 2018-08-31 Sold (Public Records) $8,386,000 Public Records
- 2011-08-04 Sold (Public Records) $1,953,000 Public Records
Property tax history
+50.3%/yrLatest (2025): $958 · +586.0% YoY. Source: county tax records.
Cash-flow waterfall
monthlySold comps — $/sqft
last 12 mo · ≤1 miLoading sold comps…