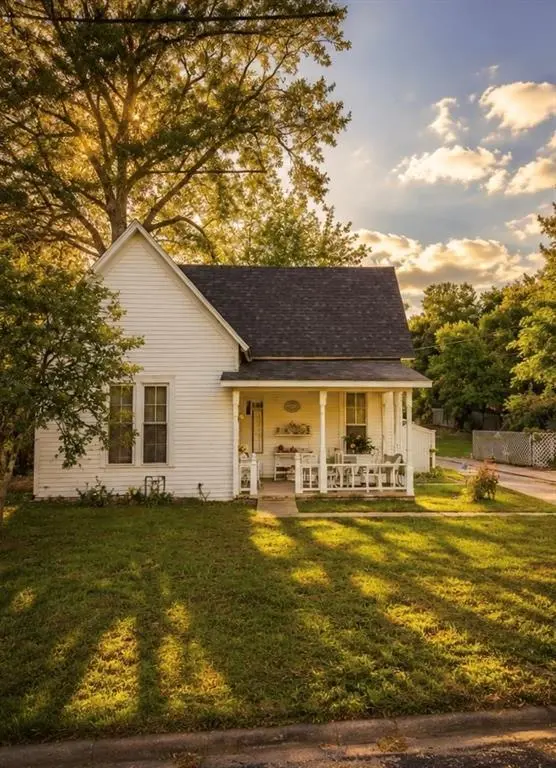
911 N Main St · Winnsboro, TX
Flood risk 1/10 · Minimal
- FEMA flood zone
- —
- Chance of flooding over 30 yrs
- 0.0%
- Est. flood insurance / yr
- —
Fire risk 4/10 · Minor
- Est. fire insurance / yr
- $1,222 – $2,270
Heat risk 7/10 · Major
- Hot days now (above 110°F)
- 7 days/yr
- Hot days in 30 yrs
- 24 days/yr
Wind risk 6/10 · Moderate
- Chance of severe wind over 30 yrs
- 27.0%
Air-quality risk 2/10 · Minimal
- Unhealthy air days now
- 0 days/yr
- Unhealthy air days in 30 yrs
- 1 days/yr
Risk factors via First Street. Map © Google.
Why this score? — see what drove the C- grade
The composite is a weighted blend of 9 inputs, each scored 0–100. Each bar is that input's sub-score; the figure is the points it added to the 100-point composite (weight × sub-score).
- Cash flow +20.8/30.0
- ARV discount +7.5/15.0
- DSCR +6.6/10.0
- 1% rule +5.5/10.0
- Schools +3.6/10.0
- Livability +3.5/5.0
- Rent growth +2.5/5.0
- Condition / age +2.5/5.0
- Appreciation +0.0/10.0
$151,900
🖨 Deal sheet 📄 Offer letter ✓ Due diligence
Listing remarks
Welcome to one of Winnsboro’s hidden gems — a historic home filled with character, charm, and possibility, located less than half a mile from downtown boutiques, coffee shops, restaurants, live music, and everything that makes this East Texas town so loved. Situated on an oversized lot with a circle drive extending behind the home, this unique property offers flexibility rarely found: ideal as a full-time residence, weekend retreat, Airbnb investment, boutique office, or downsized home for those seeking a slower pace without sacrificing convenience. This historic property allows buyers to enjoy its existing charm while adding their own vision over time. Inside, soaring ceilings,
Key facts
- Attached half bath
- Circle drive
- Oversized lot
Tags
Property features AI
Finance
- Other: Property type: Single Family Residence; Lot: Less than 0.5 acre (approx. 0.364 acres); Listing status: Active; Possession at closing/funding; Special listing conditions: Standard
- Financial info: Acceptable financing: Cash, Conventional, FHA, VA; Loan type: Treat As Clear; Second mortgage: No
- HOA & community: No homeowners association
Exterior
- Parking: Driveway; Additional parking
- Utilities: City water; City sewer; Municipal utility district: No
- Home design: Single family residence; Residential property; One story; Property is not attached; Subdivision: G B King
- Construction: Built in 1960; Wood construction; Composition roof; Pillar/post/pier foundation
- Exterior features: Covered patio/porch
Interior
- Kitchen: Dishwasher; Electric cooktop; Electric oven; Microwave
- Bedrooms: 1 bedroom (Primary Bedroom on level 1)
- Flooring: Luxury vinyl plank
- Bathrooms: 1 full bathroom; 1 half bathroom
- Heating & cooling: Central heating; Central air; Electric cooling
- Interior features: Natural woodwork; Ceiling fan(s); One living area; One dining area; Room count: 2; Levels: One
- Laundry & utility: Stacked washer/dryer area; Washer hookup; Electric water heater
Neighborhood map
What this means for you Summary
Snapshot
- This is a 1-bed/1.0-bath single-family listed at $152k.
Deal economics
- At list price, monthly cash flow is $208 ($2k/yr) — positive.
- The deal already cash-flows at list — no discount required.
- Meets the 1% rule at list price ($2k rent vs $152k).
- Recommended offer: $150k (1.5% below list) — sets the bar for market timing.
- Cap rate 7.9% vs local median 3.8% in Winnsboro — top-decile yield for the area; either an underpriced asset or a hidden risk that comps aren't pricing in. Stress-test before assuming the spread holds.
Location & tenants
- Location reads 69/100 on livability (#416 in TX) — a middle-class / working-renter tenant base. Strengths: cost of living A+, housing A+, crime B; Watch: employment D+, amenities F, commute F.
- Winnsboro ISD (town): math 46% / reading 40% proficiency, ranked #330 of 826 in TX (top 40%) — families likely to look elsewhere, expect single-tenant / working-renter base with shorter leases.
- Zoned schools: Winnsboro El (355 students, 71% FRL) — zoned schools average 71% FRL vs 49% district-wide (22 pts higher); higher-poverty schools than district average — tighter screening recommended.
- Market conditions: 217 active listings in the ZIP; 1 comparable units currently listed for rent nearby; 7 units permitted in Franklin County in 2024 (0 in 5+ unit buildings).
Forward outlook
- Local home prices are declining (-3.0%/yr); year-one equity from $1k of loan paydown is wiped out by about $5k of value loss. Plan a longer hold.
Negotiation context
- It's been on market 15 days — a 2% lower offer ($150k) is reasonable based on typical stale-listing flexibility.
Risks & watch-outs
- Climate carrying-cost: major wind risk, 27% chance of damaging wind over 30y; extreme-heat days projected 7→24/yr by 2055 (HVAC capex compounding) — expect insurance premiums to compound above CPI over the hold.
Questions for the listing agent
- Built in 1960 — when were the roof, HVAC, electrical panel, plumbing, and water heater last replaced?
- Is there a deadline driving the sale (1031 exchange, divorce, estate, relocation)? That informs how much negotiation room exists.
- What's the average days-on-market for RENTAL listings here right now (not sales)? A rising rental-DOM trend means longer vacancies and softer asking-rent achievability than the comps imply.
- What's the recent tenant-quality profile in this submarket — average credit score on applications, eviction rate, late-payment / NSF rate, and stable-employment percentage? A property-management company in the area should have these aggregated.
- How much new for-sale + rental construction is in the pipeline within 1–3 miles? Heavy new supply typically softens prices + rents 12–24 months out; constrained supply supports both.
Investment metrics
- 1% rule
- 1.05% ✓
- Cap rate
- 7.94%
- Cash-on-cash
- 5.87%
- DSCR
- 1.26
- GRM
- 7.9
CMA / ARV
No comps found within radius.
Projected returns pro-forma
-3.0% appreciation · 3.0% rent growth · sell at horizon
- IRR
- -7.2%
- Equity multiple
- 0.73×
- Total profit
- $-11,326
- Equity at exit
- $22,649
- IRR
- 2.4%
- Equity multiple
- 1.17×
- Total profit
- $7,326
- Equity at exit
- $13,134
Cash invested: $42,532 (down + closing). Projections, not guarantees.
Landlord ↔ Tenant lean methodology
- Overall (STATE)
- 87 Strongly Landlord-Friendly
- State Texas
- 87 Strongly Landlord-Friendly · R+5
- County
- — inherits STATE
- City
- — inherits STATE
ZIP-level market 75494
- Home prices YoY
- -10.9%
- Active inventory
- 217
- Price-to-rent
- 7.9×
Monthly cashflow live
- Estimated rent
- $1,600 medium interval (Pro) →
- Mortgage (P&I)
- −$797
- Tax from tax record
- −$196 /mo · $2,351/yr
- Insurance
- −$63
- HOA
- −$0
- Vacancy / Maint / Mgmt
- −$336
- Net cashflow
- $208
Break-even live
UW: 25.0% down · 7.5% · 30yr · 1.5% tax · 5.0% vac · 8.0% maint · 8.0% mgmt
Financing live
Cash to close
- Down payment
- $37,975
- Closing costs
- $4,557
- Reserves months
- —
- Total cash needed
- —
Loan-product check · same deal, 3 products live
Conventional
25% down · 7.5% · 30yr
- Down + closing
- —
- Monthly P&I
- —
- Monthly cashflow
- —
- DSCR
- —
- Eligible?
- —
Personal DTI + credit; lowest rate.
DSCR
20% down · 8.5% · 30yr
- Down + closing
- —
- Monthly P&I
- —
- Monthly cashflow
- —
- DSCR
- —
- Eligible?
- —
No personal income docs; deal must DSCR.
Hard money
10% down · 12.0% · 12mo
- Down + closing
- —
- Monthly P&I
- —
- Monthly cashflow
- —
- DSCR
- —
- Eligible?
- —
Short-term bridge; refi at stabilization.
Rent comps 1 comps
| Address | Beds | Baths | Sqft | Rent | $/sqft | DOM | Units | Dist |
|---|---|---|---|---|---|---|---|---|
| 1124 N Main St Winnsboro, TX | 1.0 | 1.5 | 1200 | $1,600 | $1.33 | 43d | 1 | 0.60mi |
Listing history 13 events
-
2026-06-18days on market $151,900 Active 15 DOM
-
2026-06-17days on market $151,900 Active 14 DOM
-
2026-06-16days on market $151,900 Active 13 DOM
-
2026-06-15days on market $151,900 Active 12 DOM
-
2026-06-15days on market $151,900 Active 11 DOM
-
2026-06-13days on market $151,900 Active 10 DOM
-
2026-06-12days on market $151,900 Active 9 DOM
-
2026-06-09days on market $151,900 Active 6 DOM
-
2026-06-08days on market $151,900 Active 5 DOM
-
2026-06-08days on market $151,900 Active 4 DOM
-
2026-06-07days on market $151,900 Active 3 DOM
-
2026-06-04remarks 687-char remark
-
2026-06-04$151,900 Active 1 DOM
ⓘ Source: listings_history table (triggers on properties + properties_extension) + one-shot
backfill from property_details.listing_events for pre-trigger history.
Tax reassessment forecast TX · Resets to sale price
- Current annual tax
- $2,351 · $196/mo
- Projected year-2 tax
- $2,780 · $232/mo
- Expected delta
- +$429/yr (+$36/mo · 18.2%)
ⓘ Screening estimate from a state-policy table — verify with the county assessor before closing.
Climate risk First Street
- Flood 1/10 Low 0% chance over 30 yrs
- Wildfire 4/10 Moderate
- Heat 7/10 Severe 7 d/yr ≥110°F today · 24 d/yr by 30 yrs out
- Wind 6/10 Major 27% chance of damaging wind over 30 yrs
- Air quality 2/10 Low 0 unhealthy d/yr today · 1 by 30 yrs out
Nearby sold comps map
Loading sold comps map…
Walkable amenities ~0.75 mi
Loading nearby amenities…
Taxation est. · year 1
- Rental income
- $19,200
- − Mortgage interest
- −$8,509
- − Property taxes
- −$2,351
- − Insurance
- −$760
- − Repairs & maintenance
- −$1,536
- − Management
- −$1,536
- − Depreciation
- −$4,419
- Taxable income
- $90
- Est. tax owed @ 24.0%
- −$22
- After-tax cash flow
- $2,477/yr
For passive investors: Depreciation is non-cash, so a rental often shows a tax loss while cash-flowing — sheltering income. Rental losses are passive: they offset passive income freely, and up to $25,000/yr can offset ordinary (W-2) income if you actively participate and your MAGI is under $100k (phasing out to $0 by $150k); unused losses carry forward. On sale, claimed depreciation is recaptured at up to 25%, and gains may owe capital-gains tax (a 1031 exchange can defer both). Figures are a year-1 estimate at your 24.0% rate — not tax advice; consult a CPA.
Schools (NCES district)
- District
- Winnsboro ISD
- NCES district ID
- 4846200
- Math proficiency
- 46% ▼ -4.00%
- Reading proficiency
- 40% ▼ -10.00%
- Median HH income
- $40,192
- Composite
- 36.07/100
- National rank
- #4769
- State rank
- #330 of 826 in TX
Livability — Winnsboro
- Score
- 69/100
- State rank
- #416
- US rank
- #8564
Category grades
Schools grade is shown separately in the Schools card above.
Census & demographics
- Census place
- Winnsboro, TX
- Population (ZIP)
- 11,685
Population outlook (Franklin County) Hauer SSP2
- Today (2025)
- 10,621 people
- By 2030
- 10,648 · +0.3%
- By 2040
- 10,629 · +0.1%
- By 2050
- 10,486 · -1.3%
- By 2075
- 10,038 · -5.5%
- By 2100
- 8,816 · -17.0%
Race, ethnicity, and origin ACS 2023
- Neighborhood character
- Predominantly White (82%)
- Race & ethnicity
- White 82% Hispanic / Latino 13% Two or more races 10% Black 1% Asian 1%
- Hispanic origin (detail)
- Mexican 12%
- Common ancestry
- Serbian 2% Iranian 2% Slovak 1%
- Foreign-born
- 7% · Canada, South Korea
- Languages at home
- 89% English-only · Spanish 8% German/W. Germanic 1% Arabic 1%
Political lean MEDSL · Franklin
- 2024 margin
- Solid R (+68.9) · D 15.3% · R 84.2%
- 2008→2024 swing
- -16.5pp toward R · 2008: -52.5pp · 2024: -68.9pp
- All cycles
- 2024: R+68.9 2020: R+67.0 2016: R+67.0 2012: R+63.4 2008: R+52.5
Not yet ingested
- Civics
- —
Market trends
- HPI YoY
- ▼ -28.64%
- Current HPI
- 234.6203
- Rent YoY
- —
- Metro
- —
- State GDP YoY
- ▲ 3.95%
- F500 in state
- 110
Industry mix (Fortune 500 HQ in TX)
| Industry | F500 HQs | Revenue |
|---|---|---|
| Energy | 16 | $1,198B |
|
||
| Technology | 5 | $198B |
|
||
| Engineering / Construction | 4 | $72B |
|
||
| Energy Services | 3 | $60B |
|
||
| Utilities | 3 | $41B |
|
||
| Healthcare | 2 | $330B |
|
||
Price history
3 events — show timeline
- 2026-05-26 Listed $151,900 NTREIS
- 1992-03-13 Sold (Public Records) — Public Records
- 1992-02-14 Sold (Public Records) — Public Records
Property tax history
+12.1%/yrLatest (2025): $2,351 · +0.5% YoY. Source: county tax records.
Cash-flow waterfall
monthlySold comps — $/sqft
last 12 mo · ≤1 miLoading sold comps…