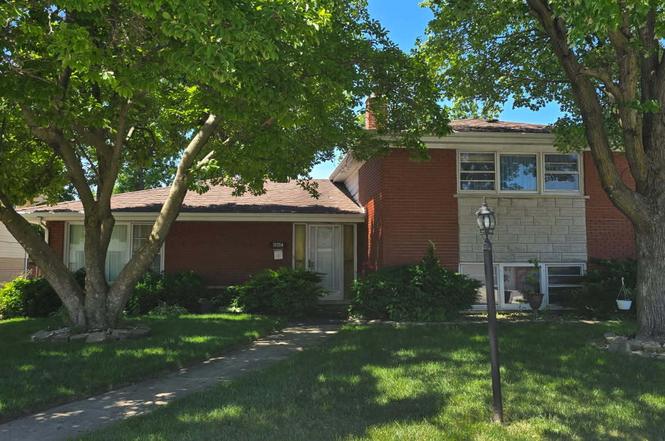
15354 Dobson Ave · South Holland, IL
Flood risk 1/10 · Minimal
- FEMA flood zone
- X (unshaded)
- Chance of flooding over 30 yrs
- 0.0%
- Est. flood insurance / yr
- $507 – $1,088
Fire risk 1/10 · Minimal
- Est. fire insurance / yr
- $804 – $1,492
Heat risk 3/10 · Minor
- Hot days now (above 101°F)
- 7 days/yr
- Hot days in 30 yrs
- 15 days/yr
Wind risk 2/10 · Minimal
- Chance of severe wind over 30 yrs
- 0.0%
Air-quality risk 4/10 · Minor
- Unhealthy air days now
- 4 days/yr
- Unhealthy air days in 30 yrs
- 5 days/yr
Risk factors via First Street. Map © Google.
Why this score? — see what drove the C+ grade
The composite is a weighted blend of 9 inputs, each scored 0–100. Each bar is that input's sub-score; the figure is the points it added to the 100-point composite (weight × sub-score).
- Cash flow +24.3/30.0
- ARV discount +11.1/15.0
- 1% rule +8.0/10.0
- DSCR +7.8/10.0
- Livability +3.9/5.0
- Rent growth +2.5/5.0
- Condition / age +2.5/5.0
- Schools +0.7/10.0
- Appreciation +0.0/10.0
$199,000
🖨 Deal sheet 📄 Offer letter ✓ Due diligence
Listing remarks
NEW ON THE MARKET, NEW PRICE! This spacious multi level single familly home is ready for a FIRST TIME BUYER or FIX AND FLIP! Huge, carpeted living and dining rooms, modern kitchen with island, stainless steel appliances, half bathroom on main level, second level consists of a full bathroom, 3 big bedrooms with hardwood floors, updated mechanicals, with a lower level to entertain or extend as a family room. Great bones, solid , 2 car garage with driveway, plenty of yard space for hosting those family summer BBQs. Located in a highly desirable part of South Holland and available NOW!! Schedule YOUR private showing TODAY!
Key facts
- Full bathroom
- Updated mechanicals
- Hardwood floors
Tags
Property features AI
Finance
- Other: Ownership: Fee simple
- HOA & community: No master association fee required
Exterior
- Parking: Detached garage (2 garage spaces); Parking for up to 5 vehicles total; Concrete driveway
- Utilities: Public water; Public sewer
- Home design: Detached single-family home; Tri-level / split-level with sub-basement
- Construction: Built 51–60 years ago; Aluminum siding and brick exterior; Built before 1978
- Exterior features: Lot dimensions approximately 61 x 113; Lot size less than 0.25 acre; School bus service available
Interior
- Kitchen: Kitchen with breakfast bar, island and breakfast room (15 x 10); Hardwood flooring in kitchen
- Bedrooms: Three bedrooms total; Master bedroom on second floor (hardwood flooring); Second bedroom on second floor (12 x 14); Third bedroom on second floor (11 x 10)
- Flooring: Hardwood flooring in kitchen and master bedroom
- Bathrooms: One full bathroom; One half bathroom
- Heating & cooling: Natural gas heating; Central air conditioning
- Interior features: Finished basement with exterior entry and walk-out access; Separate dining room; Seven total rooms
- Laundry & utility: Basement laundry (4 x 6); Utility room in basement (8 x 12)
Neighborhood map
What this means for you Summary
Snapshot
- This is a 4-bed/1.5-bath single-family listed at $199k.
Deal economics
- At list price, monthly cash flow is $400 ($5k/yr) — positive.
- The deal already cash-flows at list — no discount required.
- Meets the 1% rule at list price ($3k rent vs $199k).
- Recommended offer: $175k (12.0% below list) — sets the bar for market timing.
Location & tenants
- Location reads 77/100 on livability (#167 in IL, #3,071 nationally) — a middle-class / working-renter tenant base. Strengths: commute A+, housing A+, cost of living A; Watch: crime C-, amenities C-, schools D+.
- Thornton Twp Hsd 205 (suburban): math 7% / reading 8% proficiency, ranked #594 of 620 in IL (top 96%) — low school quality limits family demand, transient renter base, plan for 1-2y turnover.
- Market conditions: 135 active listings in the ZIP; 19 comparable units currently listed for rent nearby; rentals leasing fast (median 8d on market — plan ~1-2 weeks tenant-placement turnaround); 6,272 units permitted in Cook County in 2024 (4,658 in 5+ unit buildings).
Forward outlook
- Local home prices are declining (-3.0%/yr); year-one equity from $1k of loan paydown is wiped out by about $6k of value loss. Plan a longer hold.
Negotiation context
- It's been on market 133 days — a 12% lower offer ($175k) is reasonable based on typical stale-listing flexibility.
- 3 sale attempts with the ask held roughly flat each time — persistent listings suggest the price (not the market) is what's stuck; bring a comps-based counter.
- Current owner paid $165k; 21% above their basis — modest negotiation headroom, anchor on the comps not their cost.
Risks & watch-outs
- Watch-outs: property tax is 3.1% of price.
Questions for the listing agent
- It's been on market 133 days. Have you received any prior offers? Is the seller open to a 12% concession, seller financing, or rate buy-down credit?
- Built in 1966 — when were the roof, HVAC, electrical panel, plumbing, and water heater last replaced?
- Property tax is high relative to price — has the assessment been appealed recently, and will the sale trigger a re-assessment?
- Why hasn't it sold? Are there any deal-killer items the seller is aware of (foundation, flood, title, zoning, code violations)?
- Is there a deadline driving the sale (1031 exchange, divorce, estate, relocation)? That informs how much negotiation room exists.
- Schools are D-rated, which usually means shorter tenancies and higher turnover. Who's the typical renter profile here, and what's been the actual vacancy rate?
- What's the average days-on-market for RENTAL listings here right now (not sales)? A rising rental-DOM trend means longer vacancies and softer asking-rent achievability than the comps imply.
- What's the recent tenant-quality profile in this submarket — average credit score on applications, eviction rate, late-payment / NSF rate, and stable-employment percentage? A property-management company in the area should have these aggregated.
- How much new for-sale + rental construction is in the pipeline within 1–3 miles? Heavy new supply typically softens prices + rents 12–24 months out; constrained supply supports both.
Investment metrics
- 1% rule
- 1.30% ✓
- Cap rate
- 8.70%
- Cash-on-cash
- 8.61%
- DSCR
- 1.38
- GRM
- 6.4
CMA / ARV
- ARV (on-the-fly)
- $216,376
- Comps found
- 12
Show comp detail 12 sales within ~0.75 mi
| Address | Dist | Beds/Ba | Sqft | Sold | Price | $/sf | Match |
|---|---|---|---|---|---|---|---|
| 15439 University Ave | 0.19mi | 3/1.5 (-1) | 1,428 (-2%) | 1mo | $250,000 | $175 | 82 |
| 15230 Meadow Ln | 0.30mi | 4/2.5 | 1,452 (-1%) | 5mo | $117,000 | $81 | 77 |
| 15115 Meadow Ln | 0.43mi | 4/2.0 | 1,487 (+2%) | 4mo | $220,000 | $148 | 71 |
| 15203 Waterman Dr | 0.28mi | 3/2.0 (-1) | 1,548 (+6%) | 0mo | $280,000 | $181 | 70 |
| 15265 Drexel Ave | 0.18mi | 3/2.0 (-1) | 1,344 (-8%) | 2mo | $155,000 | $115 | 69 |
| 746 E 157th St | 0.55mi | 4/2.0 | 1,403 (-4%) | 3mo | $180,000 | $128 | 63 |
| 15547 Drexel Ave | 0.32mi | 3/2.5 (-1) | 1,600 (+9%) | 2mo | $187,500 | $117 | 58 |
| 15518 Maple St | 0.73mi | 4/2.0 | 1,345 (-8%) | 1mo | $120,000 | $89 | 50 |
| 15607 Gouwens Ln | 0.58mi | 3/1.5 (-1) | 1,317 (-10%) | 5mo | $237,000 | $180 | 48 |
| 15923 Woodlawn East Ave | 0.71mi | 4/2.0 | 1,609 (+10%) | 5mo | $325,000 | $202 | 44 |
| 1012 E 159th Pl | 0.70mi | 3/2.0 (-1) | 1,600 (+9%) | 1mo | $190,000 | $119 | 44 |
| 615 E 156th Pl | 0.64mi | 3/2.0 (-1) | 1,300 (-11%) | 2mo | $198,650 | $153 | 43 |
Match score weights: distance 35% · size 25% · config 20% · recency 20%. Top-matched comps best support the ARV.
Projected returns pro-forma
-3.0% appreciation · 3.0% rent growth · sell at horizon
- IRR
- -3.1%
- Equity multiple
- 0.88×
- Total profit
- $-6,564
- Equity at exit
- $29,672
- IRR
- 6.7%
- Equity multiple
- 1.50×
- Total profit
- $27,929
- Equity at exit
- $17,206
Cash invested: $55,720 (down + closing). Projections, not guarantees.
Landlord ↔ Tenant lean methodology
- Overall (STATE)
- 43 Moderately Tenant-Leaning
- State Illinois
- 43 Moderately Tenant-Leaning · D+7
- County
- — inherits STATE
- City
- — inherits STATE
ZIP-level market 60473
- Active inventory
- 135
- Price-to-rent
- 6.4×
Monthly cashflow live
- Estimated rent
- $2,593 high interval (Pro) →
- Mortgage (P&I)
- −$1,044
- Tax from tax record
- −$522 /mo · $6,266/yr
- Insurance
- −$83
- HOA
- −$0
- Vacancy / Maint / Mgmt
- −$545
- Net cashflow
- $400
Break-even live
UW: 25.0% down · 7.5% · 30yr · 1.5% tax · 5.0% vac · 8.0% maint · 8.0% mgmt
Financing live
Cash to close
- Down payment
- $49,750
- Closing costs
- $5,970
- Reserves months
- —
- Total cash needed
- —
Loan-product check · same deal, 3 products live
Conventional
25% down · 7.5% · 30yr
- Down + closing
- —
- Monthly P&I
- —
- Monthly cashflow
- —
- DSCR
- —
- Eligible?
- —
Personal DTI + credit; lowest rate.
DSCR
20% down · 8.5% · 30yr
- Down + closing
- —
- Monthly P&I
- —
- Monthly cashflow
- —
- DSCR
- —
- Eligible?
- —
No personal income docs; deal must DSCR.
Hard money
10% down · 12.0% · 12mo
- Down + closing
- —
- Monthly P&I
- —
- Monthly cashflow
- —
- DSCR
- —
- Eligible?
- —
Short-term bridge; refi at stabilization.
Rent comps 19 comps
| Address | Beds | Baths | Sqft | Rent | $/sqft | DOM | Units | Dist |
|---|---|---|---|---|---|---|---|---|
| 15231 Hastings Dr Dolton, IL | 4.0 | 1.5 | 1487 | $2,146 | $1.44 | 7d | 1 | 0.29mi |
| 15509 Park Ln South Holland, IL | 4.0 | 1.5 | 1200 | $3,400 | $2.83 | 24d | 1 | 0.60mi |
| 15509 Park Ln South Holland, IL | 4.0 | 1.5 | 1200 | $3,400 | $2.83 | 7d | 1 | 0.60mi |
| 15707 Dante Dr South Holland, IL | 3.0 | 2.0 | 1800 | $2,950 | $1.64 | 2d | 1 | 0.64mi |
| 14916 Langley Ave Dolton, IL | 3.0 | 1.5 | 1418 | $2,500 | $1.76 | 24d | 1 | 0.69mi |
| 16001 Avalon Ave South Holland, IL | 3.0 | 2.0 | 1136 | $3,330 | $2.93 | 6d | 1 | 0.84mi |
| 14716 Dorchester Ave Dolton, IL | 3.0 | 2.0 | 1250 | $2,800 | $2.24 | 19d | 1 | 0.90mi |
| 14738 Blackstone Ave Dolton, IL | 3.0 | 1.0 | 1017 | $2,400 | $2.36 | 10d | 1 | 0.93mi |
| 660 Clyde Ave Calumet City, IL | 3.0 | 1.5 | 1400 | $1,750 | $1.25 | 3d | 1 | 1.07mi |
| 15400 Merrill Ave South Holland, IL | 4.0 | 2.0 | 1508 | $3,330 | $2.21 | 22d | 1 | 1.07mi |
| 14610 Blackstone Ave Dolton, IL | 3.0 | 1.0 | 1017 | $2,400 | $2.36 | 6d | 1 | 1.09mi |
| 409 Madison Ave Unit 2 Calumet City, IL | 3.0 | 1.5 | 1200 | $1,795 | $1.50 | 3d | 1 | 1.10mi |
| 1429 Kasten Dr Dolton, IL | 3.0 | 1.0 | 1600 | $2,500 | $1.56 | 1d | 1 | 1.13mi |
| 16246 Dobson Ave South Holland, IL | 3.0 | 2.0 | 1250 | $3,170 | $2.54 | 2d | 1 | 1.13mi |
| 14433 Woodlawn Ave Dolton, IL | 4.0 | 2.0 | 1300 | $2,000 | $1.54 | 18d | 1 | 1.14mi |
| 659 Paxton Ave Calumet City, IL | 3.0 | 2.0 | 1255 | $2,461 | $1.96 | 10d | 1 | 1.22mi |
| 405 Clyde Ave Calumet City, IL | 3.0 | 1.0 | 973 | $2,300 | $2.36 | 1d | 1 | 1.26mi |
| 14305 Irving Ave Unit 2 Dolton, IL | 3.0 | 1.0 | 1100 | $2,200 | $2.00 | 24d | 1 | 1.41mi |
| 1860 State St Calumet City, IL | 3.0 | 1.0 | 1100 | $1,800 | $1.64 | 17d | 1 | 1.48mi |
Listing history 24 events
-
2026-06-18days on market $199,000 Active 133 DOM
-
2026-06-17days on market $199,000 Active 132 DOM
-
2026-06-16days on market $199,000 Active 131 DOM
-
2026-06-15days on market $199,000 Active 130 DOM
-
2026-06-13days on market $199,000 Active 128 DOM
-
2026-06-13days on market $199,000 Active 127 DOM
-
2026-06-09days on market $199,000 Active 124 DOM
-
2026-06-08days on market $199,000 Active 123 DOM
-
2026-06-07days on market $199,000 Active 122 DOM
-
2026-06-04days on market $199,000 Active 119 DOM
-
2026-06-03days on market $199,000 Active 118 DOM
-
2026-06-02days on market $199,000 Active 117 DOM
-
2026-06-01days on market $199,000 Active 116 DOM
-
2026-05-31days on market $199,000 Active 115 DOM
-
2026-03-23status Active
-
2026-03-14historical Contingent - No Showings
-
2026-02-05$199,000 Active
-
2025-12-31historical
-
2025-10-20price
-
2025-08-19Active
-
2024-05-14soldstatus $165,000
-
2024-04-10soldstatus $133,500
-
1992-03-24soldstatus $87,500
-
1984-11-01soldstatus $72,900
ⓘ Source: listings_history table (triggers on properties + properties_extension) + one-shot
backfill from property_details.listing_events for pre-trigger history.
Tax reassessment forecast IL · Partial reset (capped growth)
- Current annual tax
- $6,266 · $522/mo
- Projected year-2 tax
- $6,266 · $522/mo
- Expected delta
- $0/yr ($0/mo · 0.0%)
ⓘ Screening estimate from a state-policy table — verify with the county assessor before closing.
Climate risk First Street
- Flood 1/10 Low FEMA zone X (unshaded) · 0% chance over 30 yrs
- Wildfire 1/10 Low
- Heat 3/10 Moderate 7 d/yr ≥101°F today · 15 d/yr by 30 yrs out
- Wind 2/10 Low 0% chance of damaging wind over 30 yrs
- Air quality 4/10 Moderate 4 unhealthy d/yr today · 5 by 30 yrs out
Nearby sold comps map
Loading sold comps map…
Walkable amenities ~0.75 mi
Loading nearby amenities…
Taxation est. · year 1
- Rental income
- $31,118
- − Mortgage interest
- −$11,147
- − Property taxes
- −$6,266
- − Insurance
- −$995
- − Repairs & maintenance
- −$2,489
- − Management
- −$2,489
- − Depreciation
- −$5,789
- Taxable income
- $1,942
- Est. tax owed @ 24.0%
- −$466
- After-tax cash flow
- $4,334/yr
For passive investors: Depreciation is non-cash, so a rental often shows a tax loss while cash-flowing — sheltering income. Rental losses are passive: they offset passive income freely, and up to $25,000/yr can offset ordinary (W-2) income if you actively participate and your MAGI is under $100k (phasing out to $0 by $150k); unused losses carry forward. On sale, claimed depreciation is recaptured at up to 25%, and gains may owe capital-gains tax (a 1031 exchange can defer both). Figures are a year-1 estimate at your 24.0% rate — not tax advice; consult a CPA.
Schools (NCES district)
- District
- Thornton Twp Hsd 205
- NCES district ID
- 1738970
- Math proficiency
- 7% ▬ 0.00%
- Reading proficiency
- 8% ▼ -2.00%
- Median HH income
- $43,392
- Composite
- 6.92/100
- National rank
- #9976
- State rank
- #594 of 620 in IL
Livability — South Holland
- Score
- 77/100
- State rank
- #167
- US rank
- #3071
Category grades
Schools grade is shown separately in the Schools card above.
Census & demographics
- Census place
- South Holland, IL
- City population
- 21,407
- Population (ZIP)
- 21,407
Population outlook (Cook County) Hauer SSP2
- Today (2025)
- 5,347,519 people
- By 2030
- 5,357,703 · +0.2%
- By 2040
- 5,324,924 · -0.4%
- By 2050
- 5,230,762 · -2.2%
- By 2075
- 4,785,735 · -10.5%
- By 2100
- 4,188,836 · -21.7%
Race, ethnicity, and origin ACS 2023
- Neighborhood character
- Predominantly Black (75%)
- Race & ethnicity
- Black 75% White 10% Hispanic / Latino 10% Two or more races 3% Asian 1%
- Hispanic origin (detail)
- Mexican 9% Puerto Rican 1%
- Common ancestry
- Iranian 3% Romanian 2%
- Foreign-born
- 6% · Canada, China
- Languages at home
- 87% English-only · Spanish 8% Other Asian/Pacific 1% Russian/Polish/Slavic 1%
Political lean MEDSL · Cook
- 2024 margin
- Solid D (+42.0) · D 70.4% · R 28.4% · Other 1.2%
- 2008→2024 swing
- -11.4pp toward R · 2008: 53.4pp · 2024: 42.0pp
- All cycles
- 2024: D+42.0 2020: D+50.3 2016: D+53.0 2012: D+49.4 2008: D+53.4
Not yet ingested
- Civics
- —
Market trends
- HPI YoY
- ▼ -114.36%
- Current HPI
- 201.2479
- Rent YoY
- —
- Metro
- —
- State GDP YoY
- ▲ 1.59%
- F500 in state
- 60
Industry mix (Fortune 500 HQ in IL)
| Industry | F500 HQs | Revenue |
|---|---|---|
| Insurance | 4 | $201B |
|
||
| Consumer Goods | 4 | $87B |
|
||
| Industrial Machinery | 3 | $64B |
|
||
| Healthcare | 2 | $55B |
|
||
| Retail / Pharmacy | 1 | $148B |
|
||
| Agriculture / Food | 1 | $86B |
|
||
Price history
+173.0% since first listed10 events — show timeline
- 2026-03-23 Relisted — MRED as Distributed by MLS Grid
- 2026-03-14 Contingent — MRED as Distributed by MLS Grid
- 2026-02-05 Listed $199,000 MRED as Distributed by MLS Grid
- 2025-12-31 Listing Removed — MRED as Distributed by MLS Grid
- 2025-10-20 Price Changed — MRED as Distributed by MLS Grid
- 2025-08-19 Listed — MRED as Distributed by MLS Grid
- 2024-05-14 Sold (Public Records) $165,000 Public Records
- 2024-04-10 Sold (Public Records) $133,500 Public Records
- 1992-03-24 Sold (Public Records) $87,500 Public Records
- 1984-11-01 Sold (Public Records) $72,900 Public Records
Property tax history
+2.7%/yrLatest (2023): $6,266 · +321.5% YoY. Source: county tax records.
Cash-flow waterfall
monthlySold comps — $/sqft
last 12 mo · ≤1 miLoading sold comps…