1735 NW Lyman Rd Lot 13 · Topeka, KS
Flood risk 7/10 · Major
- FEMA flood zone
- X
- Chance of flooding over 30 yrs
- 0.75%
- Est. flood insurance / yr
- $507 – $1,088
Fire risk 2/10 · Minimal
- Est. fire insurance / yr
- $1,154 – $2,142
Heat risk 5/10 · Moderate
- Hot days now (above 107°F)
- 7 days/yr
- Hot days in 30 yrs
- 17 days/yr
Wind risk 2/10 · Minimal
- Chance of severe wind over 30 yrs
- —
Air-quality risk 2/10 · Minimal
- Unhealthy air days now
- 1 days/yr
- Unhealthy air days in 30 yrs
- 2 days/yr
Risk factors via First Street. Map © Google.
Why this score? — see what drove the B+ grade
The composite is a weighted blend of 9 inputs, each scored 0–100. Each bar is that input's sub-score; the figure is the points it added to the 100-point composite (weight × sub-score).
- Cash flow +30.0/30.0
- 1% rule +10.0/10.0
- DSCR +10.0/10.0
- ARV discount +7.5/15.0
- Appreciation +7.5/10.0
- Livability +3.5/5.0
- Schools +3.1/10.0
- Rent growth +2.5/5.0
- Condition / age +2.2/5.0
$65,000
🖨 Deal sheet 📄 Offer letter ✓ Due diligence
Listing remarks
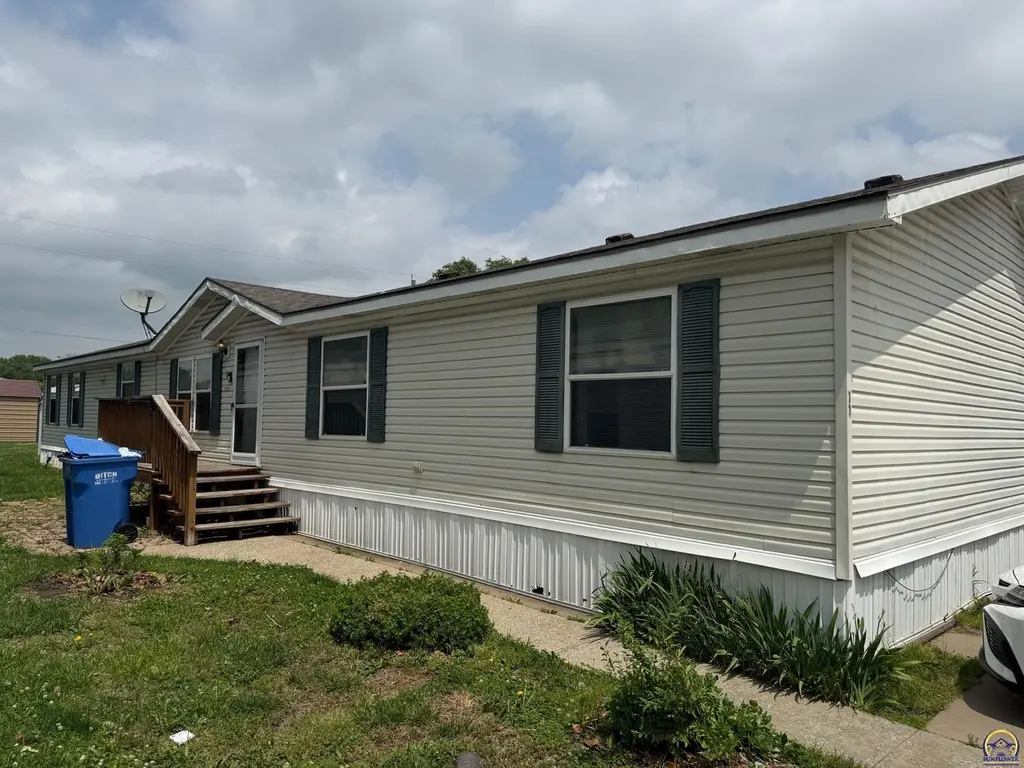
Affordable living meets space and comfort in this well-maintained 4 bedroom, 2 bathroom home located in Brittany Place Manufactured Home Community. Built in 1998 and featuring a brand new A/C unit, this home offers an efficient layout with plenty of room to spread out while remaining budget friendly. Residents of Brittany Place enjoy amenities including a swimming pool, community events, lighted streets, off-street parking, and a pet-friendly atmosphere. Conveniently located within the Seaman School District, this move-in ready home is a fantastic opportunity for anyone looking for affordable homeownership without sacrificing comfort or convenience.
Key facts
- Swimming pool
- Brand new a/c unit
- Off-street parking
Tags
Property features AI
Finance
- HOA & community: Community pool
Exterior
- Utilities: Public water; Public sewer
- Home design: Residential mobile home
- Construction: Composition roof; Approximately 2,001 square feet above grade
- Exterior features: Cul-de-sac lot
Interior
- Kitchen: Gas Range; Dishwasher; Refrigerator
- Flooring: Carpet
- Bathrooms: 2 full bathrooms
- Heating & cooling: Central air conditioning
- Interior features: Gas Range; Dishwasher; Refrigerator
- Laundry & utility: Main-level laundry
Neighborhood map
What this means for you Summary
Snapshot
- This is a 4-bed/2.0-bath manufactured listed at $65k. Condition is rated fair.
Deal economics
- At list price, monthly cash flow is $597 ($7k/yr) — positive.
- The deal already cash-flows at list — no discount required.
- Meets the 1% rule at list price ($1k rent vs $65k).
- Recommended offer: $64k (1.5% below list) — sets the bar for market timing.
- Cap rate 18.6% vs local median 4.3% in Topeka — top-decile yield for the area; either an underpriced asset or a hidden risk that comps aren't pricing in. Stress-test before assuming the spread holds.
Location & tenants
- Location reads 69/100 on livability (#195 in KS) — a middle-class / working-renter tenant base. Strengths: cost of living A+, housing A+, health & safety A+; Watch: employment C-, crime F, commute F.
- Seaman (suburban): math 32% / reading 37% proficiency, ranked #51 of 169 in KS (top 30%) — families likely to look elsewhere, expect single-tenant / working-renter base with shorter leases.
- Zoned schools: Logan Elementary (math 22% / reading 32%, grade F, #507 of 684 statewide, top 78%, 624 students, 61% FRL); Seaman Middle School (math 17% / reading 23%, grade F, #146 of 219 statewide, top 67%, 585 students, 37% FRL); Seaman High (math 17% / reading 22%, grade F, #216 of 327 statewide, top 70%, 1,239 students, 31% FRL) — zoned schools average 43% FRL vs 26% district-wide (17 pts higher); higher-poverty schools than district average — tighter screening recommended.
- Zoned-school proficiency averages 22% at this address vs 34% district-wide (-12 pts) — the specific schools serving this property underperform the Seaman average; the district grade overstates school quality for this exact location.
- Market conditions: 32 active listings in the ZIP; 219 units permitted in Shawnee County in 2024 (25 in 5+ unit buildings).
Forward outlook
- In year one you build about $4k of equity ($449 loan paydown + $3k appreciation (5.0% local appreciation)).
- Shawnee County population projected to shrink 7% by 2050 — rents likely to lag national; underwrite the cash flow, not the appreciation.
- At projected returns (5.0% appreciation + 3.0% rent growth), your $18k cash investment doubles in ~2 years — after that, you're playing with house money.
- By year 9, paydown + projected appreciation supports a ~$33k cash-out refi (75% LTV) — recoverable capital for the next deal without selling this one.
Negotiation context
- It's been on market 30 days — a 2% lower offer ($64k) is reasonable based on typical stale-listing flexibility.
Risks & watch-outs
- Watch-outs: flood insurance adds $66/mo.
- Climate carrying-cost: major flood risk; extreme-heat days projected 7→17/yr by 2055 (HVAC capex compounding) — expect insurance premiums to compound above CPI over the hold.
Questions for the listing agent
- Have any recent inspections been done? Can we get a copy of the seller's disclosures and any deferred-maintenance estimates?
- What's the actual annual flood-insurance premium (NFIP or private), and is the property in a SFHA with mandatory coverage?
- Is there a deadline driving the sale (1031 exchange, divorce, estate, relocation)? That informs how much negotiation room exists.
- Schools are D-rated, which usually means shorter tenancies and higher turnover. Who's the typical renter profile here, and what's been the actual vacancy rate?
- Crime grade is F in this area — have there been break-ins, vandalism, or insurance claims at this property in the last 3 years? What carrier currently insures it and at what premium?
- What's the average days-on-market for RENTAL listings here right now (not sales)? A rising rental-DOM trend means longer vacancies and softer asking-rent achievability than the comps imply.
- What's the recent tenant-quality profile in this submarket — average credit score on applications, eviction rate, late-payment / NSF rate, and stable-employment percentage? A property-management company in the area should have these aggregated.
- How much new for-sale + rental construction is in the pipeline within 1–3 miles? Heavy new supply typically softens prices + rents 12–24 months out; constrained supply supports both.
Investment metrics
- 1% rule
- 2.17% ✓
- Cap rate
- 18.55%
- Cash-on-cash
- 43.78%
- DSCR
- 2.95
- GRM
- 3.8
CMA / ARV
No comps found within radius.
Projected returns pro-forma
5.04% appreciation · 3.0% rent growth · sell at horizon
- IRR
- 47.9%
- Equity multiple
- 3.92×
- Total profit
- $53,234
- Equity at exit
- $36,979
- IRR
- 45.7%
- Equity multiple
- 8.04×
- Total profit
- $128,094
- Equity at exit
- $63,940
Cash invested: $18,200 (down + closing). Projections, not guarantees.
Landlord ↔ Tenant lean methodology
- Overall (STATE)
- 83 Strongly Landlord-Friendly
- State Kansas
- 83 Strongly Landlord-Friendly · R+10
- County
- — inherits STATE
- City
- — inherits STATE
ZIP-level market 66608
- Home prices YoY
- 2.3%
- Active inventory
- 32
- Price-to-rent
- 3.8×
Monthly cashflow live
- Estimated rent
- $1,409 medium interval (Pro) →
- Mortgage (P&I)
- −$341
- Tax est. 1.5%
- −$81 /mo · $975/yr
- Insurance
- −$27
- Flood insurance flood zone
- −$66 /mo · $798/yr
- HOA
- −$0
- Vacancy / Maint / Mgmt
- −$296
- Net cashflow
- $597
Break-even live
UW: 25.0% down · 7.5% · 30yr · 1.5% tax · 5.0% vac · 8.0% maint · 8.0% mgmt
Financing live
Cash to close
- Down payment
- $16,250
- Closing costs
- $1,950
- Reserves months
- —
- Total cash needed
- —
Loan-product check · same deal, 3 products live
Conventional
25% down · 7.5% · 30yr
- Down + closing
- —
- Monthly P&I
- —
- Monthly cashflow
- —
- DSCR
- —
- Eligible?
- —
Personal DTI + credit; lowest rate.
DSCR
20% down · 8.5% · 30yr
- Down + closing
- —
- Monthly P&I
- —
- Monthly cashflow
- —
- DSCR
- —
- Eligible?
- —
No personal income docs; deal must DSCR.
Hard money
10% down · 12.0% · 12mo
- Down + closing
- —
- Monthly P&I
- —
- Monthly cashflow
- —
- DSCR
- —
- Eligible?
- —
Short-term bridge; refi at stabilization.
Listing history 16 events
-
2026-06-19days on market $65,000 Active 30 DOM
-
2026-06-18days on market $65,000 Active 29 DOM
-
2026-06-17days on market $65,000 Active 28 DOM
-
2026-06-16days on market $65,000 Active 27 DOM
-
2026-06-15days on market $65,000 Active 26 DOM
-
2026-06-14days on market $65,000 Active 24 DOM
-
2026-06-13days on market $65,000 Active 23 DOM
-
2026-06-10days on market $65,000 Active 21 DOM
-
2026-06-09days on market $65,000 Active 20 DOM
-
2026-06-08days on market $65,000 Active 19 DOM
-
2026-06-07days on market $65,000 Active 18 DOM
-
2026-06-02days on market $65,000 Active 13 DOM
-
2026-06-01days on market $65,000 Active 12 DOM
-
2026-05-31days on market $65,000 Active 11 DOM
-
2026-05-30days on market $65,000 Active 10 DOM
-
2026-05-20$65,000 Active
ⓘ Source: listings_history table (triggers on properties + properties_extension) + one-shot
backfill from property_details.listing_events for pre-trigger history.
Climate risk First Street
- Flood 7/10 Severe FEMA zone X · 75% chance over 30 yrs
- Wildfire 2/10 Low
- Heat 5/10 Major 7 d/yr ≥107°F today · 17 d/yr by 30 yrs out
- Wind 2/10 Low
- Air quality 2/10 Low 1 unhealthy d/yr today · 2 by 30 yrs out
Nearby sold comps map
Loading sold comps map…
Walkable amenities ~0.75 mi
Loading nearby amenities…
Taxation est. · year 1
- Rental income
- $16,909
- − Mortgage interest
- −$3,641
- − Property taxes
- −$975
- − Insurance
- −$1,122
- − Repairs & maintenance
- −$1,353
- − Management
- −$1,353
- − Depreciation
- −$1,891
- Taxable income
- $6,574
- Est. tax owed @ 24.0%
- −$1,578
- After-tax cash flow
- $5,592/yr
For passive investors: Depreciation is non-cash, so a rental often shows a tax loss while cash-flowing — sheltering income. Rental losses are passive: they offset passive income freely, and up to $25,000/yr can offset ordinary (W-2) income if you actively participate and your MAGI is under $100k (phasing out to $0 by $150k); unused losses carry forward. On sale, claimed depreciation is recaptured at up to 25%, and gains may owe capital-gains tax (a 1031 exchange can defer both). Figures are a year-1 estimate at your 24.0% rate — not tax advice; consult a CPA.
Condition & rehab AI · 13 photos
This manufactured home requires moderate repairs and updates to its exterior and interior to improve its condition and value.
Repairs flagged
- Major exterior siding — Significant wear and tear
- Major interior walls — Peeling paint and worn wallpaper
- Major bathroom fixtures — Worn and outdated design
- Major kitchen cabinets — Worn and outdated design
Value-add opportunities
- Both exterior siding replacement — Enhances curb appeal and value
- Both interior wall and ceiling paint — Refreshes the interior and enhances value
- Both bathroom fixtures and tile — Modernizes the space and enhances value
- Both kitchen cabinets and countertops — Modernizes the space and enhances value
Renovation cost estimate screening
| Repair item | Severity | Est. cost |
|---|---|---|
| exterior siding · Significant wear and tear | Major | $15,000–50,000 |
| interior walls · Peeling paint and worn wallpaper | Major | $15,000–50,000 |
| bathroom fixtures · Worn and outdated design | Major | $15,000–50,000 |
| kitchen cabinets · Worn and outdated design | Major | $15,000–50,000 |
| Total estimated repair cost · 4 items | $60,000–200,000 |
Value-add ROI direction
- Both exterior siding replacement — Enhances curb appeal and value ↑
- Both interior wall and ceiling paint — Refreshes the interior and enhances value ↑
- Both bathroom fixtures and tile — Modernizes the space and enhances value ↑
- Both kitchen cabinets and countertops — Modernizes the space and enhances value ↑
ⓘ Cost ranges are severity-bucket heuristics (US national rule-of-thumb). Get contractor quotes + a written scope before underwriting a rehab budget.
Schools (NCES district)
- District
- Seaman
- NCES district ID
- 2011490
- Math proficiency
- 32% ▼ -5.00%
- Reading proficiency
- 37% ▬ 0.00%
- Median HH income
- $65,842
- Composite
- 31.43/100
- National rank
- #5985
- State rank
- #51 of 169 in KS
Livability — Topeka
- Score
- 69/100
- State rank
- #195
- US rank
- #8848
Category grades
Schools grade is shown separately in the Schools card above.
Census & demographics
- Census place
- Topeka, KS
- City population
- 118,130
- Population (ZIP)
- 4,789
Population outlook (Shawnee County) Hauer SSP2
- Today (2025)
- 179,277 people
- By 2030
- 177,762 · -0.8%
- By 2040
- 172,341 · -3.9%
- By 2050
- 166,330 · -7.2%
- By 2075
- 152,417 · -15.0%
- By 2100
- 134,782 · -24.8%
Race, ethnicity, and origin ACS 2023
- Neighborhood character
- Predominantly White (78%)
- Race & ethnicity
- White 78% Black 10% Two or more races 8% Hispanic / Latino 7%
- Hispanic origin (detail)
- Mexican 6%
- Common ancestry
- Lithuanian 2% Romanian 2% Iranian 2%
- Foreign-born
- 1% · Canada, South Korea
- Languages at home
- 95% English-only · Spanish 4% Korean 1%
Political lean MEDSL · Shawnee
- 2024 margin
- Toss-up / Even · D 49.3% · R 48.8% · Other 2.0%
- 2008→2024 swing
- +0.8pp no change · 2008: -0.3pp · 2024: 0.5pp
- All cycles
- 2024: D+0.5 2020: D+3.0 2016: R+2.8 2012: R+1.7 2008: R+0.3
Not yet ingested
- Civics
- —
Market trends
- HPI YoY
- ▲ 5.04%
- Current HPI
- 223.2676
- Rent YoY
- —
- Metro
- —
- State GDP YoY
- —
- F500 in state
- 0
Price history
1 event — show timeline
- 2026-05-20 Listed $65,000 Sunflower MLS as distributed by MLS GRID
Cash-flow waterfall
monthlySold comps — $/sqft
last 12 mo · ≤1 miLoading sold comps…