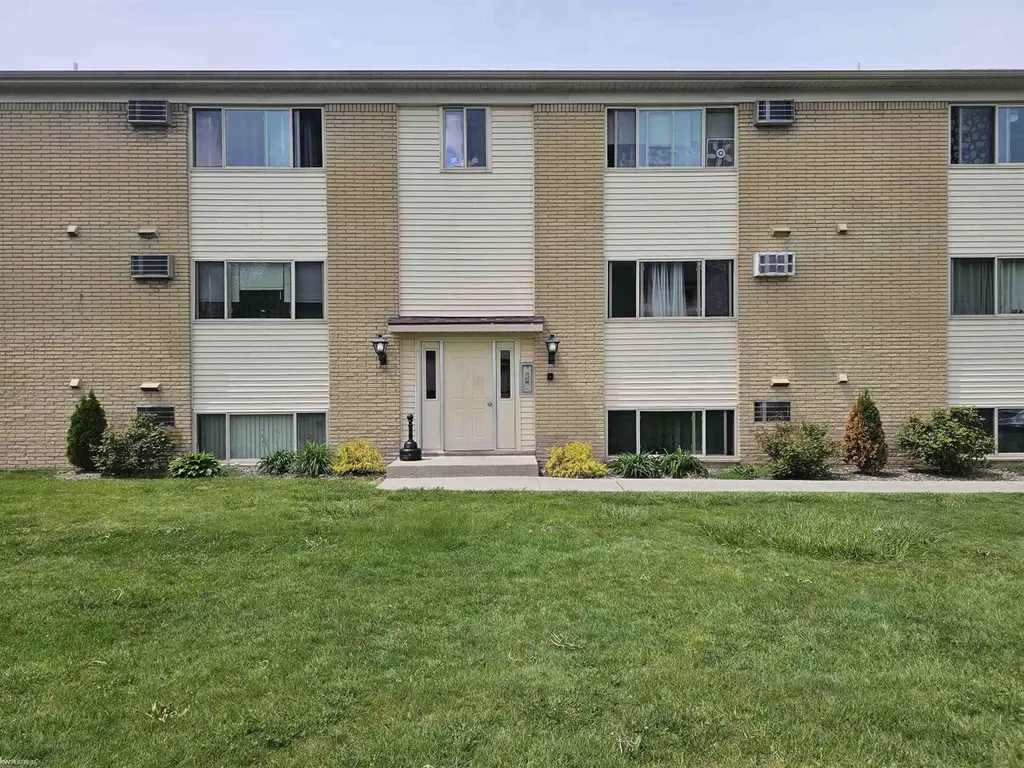
1875 Michigan Ave Unit 6 E · Marysville, MI
Flood risk 1/10 · Minimal
- FEMA flood zone
- X (unshaded)
- Chance of flooding over 30 yrs
- 0.0%
- Est. flood insurance / yr
- $507 – $1,088
Fire risk 1/10 · Minimal
- Est. fire insurance / yr
- $784 – $1,456
Heat risk 3/10 · Minor
- Hot days now (above 97°F)
- 7 days/yr
- Hot days in 30 yrs
- 14 days/yr
Wind risk 1/10 · Minimal
- Chance of severe wind over 30 yrs
- —
Air-quality risk 3/10 · Minor
- Unhealthy air days now
- 2 days/yr
- Unhealthy air days in 30 yrs
- 3 days/yr
Risk factors via First Street. Map © Google.
Why this score? — see what drove the C grade
The composite is a weighted blend of 9 inputs, each scored 0–100. Each bar is that input's sub-score; the figure is the points it added to the 100-point composite (weight × sub-score).
- Cash flow +20.4/30.0
- 1% rule +9.7/10.0
- ARV discount +7.5/15.0
- DSCR +6.5/10.0
- Schools +4.2/10.0
- Condition / age +4.0/5.0
- Livability +3.9/5.0
- Rent growth +2.5/5.0
- Appreciation +0.0/10.0
$64,900
🖨 Deal sheet (PDF) 📄 Offer letter ✓ Due diligence
Listing remarks
Great opportunity for home ownership or a low maintenance rental investment. This 2nd floor, one bedroom/one bath condo unit, features updated paint, waterproof vinyl plank flooring, air conditioning (wall mounted), ceiling fans, light fixtures, kitchen appliances, garbage disposal and commode. The monthly HOA fee of $220. includes heat, water/sewer, trash removal, snow removal and all exterior maintenance of the building, landscaping and common areas. On-sight coin operated washers and dryers are located in the basement for resident’s use. Assigned parking includes a carport and one additional space. Close to all amenities - healthcare, shopping, commuting, golf courses, Marysville p
Key facts
- Air conditioning
- Kitchen appliances
- Garbage disposal
Tags
Property features AI
Finance
- Other: Zoned multi-family/residential; City/County roads; Not in a floodplain
- HOA & community: Association: Wildwood Condominiums; Monthly association fee of $220; Association fee includes lawn maintenance, snow removal, trash removal, water/sewer, exterior maintenance, and heating; Community amenities include grounds maintenance, laundry facility, sidewalks, and street lights; Pets are not allowed
Exterior
- Parking: Carport; Covered parking for 1 vehicle
- Utilities: Public water; Public sanitary sewer; Electric heat/fuel; Electric water heater
- Home design: Condominium; Condo/ranch unit on second floor or above; Built in 1977; Unit/Building number: 6 E
- Construction: Basement foundation (common, full, block)
- Exterior features: Brick and vinyl siding exterior; Sidewalks; Street lights; Located within city limits; Road frontage
Interior
- Kitchen: Range/oven; Refrigerator; Disposal
- Bedrooms: Primary bedroom on the second floor (approx. 14 x 12)
- Bathrooms: One full bathroom; Bathroom floor: vinyl
- Heating & cooling: Baseboard heating; Wall/window air conditioning; Electric water heater
- Interior features: Cable/internet available; Living room
- Laundry & utility: Has basement
Neighborhood map
What this means for you Summary
Snapshot
- This is a 1-bed/1.0-bath condo listed at $65k. Condition is rated good.
Deal economics
- At list price, monthly cash flow is $84 ($1k/yr) — positive.
- The deal already cash-flows at list — no discount required.
- Meets the 1% rule at list price ($952 rent vs $65k).
- Cap rate 7.8% vs local median 4.3% in Marysville — top-decile yield for the area; either an underpriced asset or a hidden risk that comps aren't pricing in. Stress-test before assuming the spread holds.
Location & tenants
- Location reads 78/100 on livability (#114 in MI, #2,700 nationally) — a middle-class / working-renter tenant base. Strengths: crime A+, cost of living A+, housing A+; Watch: amenities C-, employment D+, health & safety D.
- Marysville Public Schools (suburban): math 42% / reading 53% proficiency, ranked #115 of 540 in MI (top 21%) — families likely to look elsewhere, expect single-tenant / working-renter base with shorter leases.
- Market conditions: 85 active listings in the ZIP; 2 comparable units currently listed for rent nearby; 232 units permitted in St. Clair County in 2024 (0 in 5+ unit buildings).
Forward outlook
- Local home prices are declining (-3.0%/yr); year-one equity from $449 of loan paydown is wiped out by about $2k of value loss. Plan a longer hold.
- St. Clair County population projected at -20% by 2050 — secular population decline; favor cash flow + early exit over multi-decade hold.
Negotiation context
- Only 7 days on market — expect competitive offers; lowballing is unlikely to land.
Risks & watch-outs
- Watch-outs: HOA is 23% of rent.
Questions for the listing agent
- Built in 1977 — when were the roof, HVAC, electrical panel, plumbing, and water heater last replaced?
- What does the HOA fee cover, when was the last increase, and are there any pending special assessments or reserve-fund shortfalls?
- Any open or pending special assessments — roof, HVAC, plumbing, elevator, façade? What's the per-unit balance and payoff schedule, and is the seller paying it off at close or rolling it to the buyer?
- Is there a deadline driving the sale (1031 exchange, divorce, estate, relocation)? That informs how much negotiation room exists.
- Schools are B-rated — typically a magnet for longer-tenancy family renters. What's the average tenant stay here, and is there a school-zone premium baked into asking?
- What's the average days-on-market for RENTAL listings here right now (not sales)? A rising rental-DOM trend means longer vacancies and softer asking-rent achievability than the comps imply.
- What's the recent tenant-quality profile in this submarket — average credit score on applications, eviction rate, late-payment / NSF rate, and stable-employment percentage? A property-management company in the area should have these aggregated.
- How much new apartment / multifamily construction is in the pipeline within 1–3 miles? Heavy new supply (>2% of stock underway) typically softens rents 12–24 months out; light construction supports rent growth.
Investment metrics
- 1% rule
- 1.47% ✓
- Cap rate
- 7.84%
- Cash-on-cash
- 5.54%
- DSCR
- 1.25
- GRM
- 5.7
CMA / ARV
No comps found within radius.
Projected returns pro-forma
-3.0% appreciation · 3.0% rent growth · sell at horizon
- IRR
- -7.5%
- Equity multiple
- 0.72×
- Total profit
- $-5,022
- Equity at exit
- $9,677
- IRR
- 2.4%
- Equity multiple
- 1.17×
- Total profit
- $3,117
- Equity at exit
- $5,611
Cash invested: $18,172 (down + closing). Projections, not guarantees.
Landlord ↔ Tenant lean methodology
- Overall (STATE)
- 62 Landlord-Friendly
- State Michigan
- 62 Landlord-Friendly · EVEN
- County
- — inherits STATE
- City
- — inherits STATE
ZIP-level market 48040
- Home prices YoY
- -34.4%
- Active inventory
- 85
- Price-to-rent
- 5.7×
Monthly cashflow live
- Estimated rent
- $952 medium interval (Pro) →
- Mortgage (P&I)
- −$340
- Tax est. 1.5%
- −$81 /mo · $974/yr
- Insurance
- −$27
- HOA
- −$220
- Vacancy / Maint / Mgmt
- −$200
- Net cashflow
- $84
Break-even live
Sensitivity live
| Price | -10% $129 | -5% $106 | +0% $84 | +5% $61 | +10% $39 |
|---|---|---|---|---|---|
| Rent | -10% $9 | -5% $46 | +0% $84 | +5% $122 | +10% $159 |
| Rate | -1.0pp $117 | -0.5pp $100 | base $84 | +0.5pp $67 | +1.0pp $50 |
UW: 25.0% down · 7.5% · 30yr · 1.5% tax · 5.0% vac · 8.0% maint · 8.0% mgmt
Financing live
Cash to close
- Down payment
- $16,225
- Closing costs
- $1,947
- Reserves months
- —
- Total cash needed
- —
Loan-product check · same deal, 3 products live
Conventional
25% down · 7.5% · 30yr
- Down + closing
- —
- Monthly P&I
- —
- Monthly cashflow
- —
- DSCR
- —
- Eligible?
- —
Personal DTI + credit; lowest rate.
DSCR
20% down · 8.5% · 30yr
- Down + closing
- —
- Monthly P&I
- —
- Monthly cashflow
- —
- DSCR
- —
- Eligible?
- —
No personal income docs; deal must DSCR.
Hard money
10% down · 12.0% · 12mo
- Down + closing
- —
- Monthly P&I
- —
- Monthly cashflow
- —
- DSCR
- —
- Eligible?
- —
Short-term bridge; refi at stabilization.
Rent comps 2 comps
| Address | Beds | Baths | Sqft | Rent | $/sqft | DOM | Units | Dist |
|---|---|---|---|---|---|---|---|---|
| 1875 Michigan Ave Unit 6 Marysville, MI | 1.0 | 1.0 | 654 | $950 | $1.45 | 6d | 1 | 0.16mi |
| 1490 Aspen Dr Marysville, MI | 2.0 | 1.0–2.0 | 576 | $970 | $1.68 | 0d | 7 | 0.99mi |
HOA detail condo
- Monthly dues
- $220 · $2,640/yr
- Likely covers
- watersewertrashlandscapingsnow removalexterior maint.parking
- Assessments
- None detected in remarks — confirm with the listing agent.
Listing history 1 events
-
2026-05-22$64,900 Active
ⓘ Source: listings_history table (triggers on properties + properties_extension) + one-shot
backfill from property_details.listing_events for pre-trigger history.
Climate risk First Street
- Flood 1/10 Low FEMA zone X (unshaded) · 0% chance over 30 yrs
- Wildfire 1/10 Low
- Heat 3/10 Moderate 7 d/yr ≥97°F today · 14 d/yr by 30 yrs out
- Wind 1/10 Low
- Air quality 3/10 Moderate 2 unhealthy d/yr today · 3 by 30 yrs out
Nearby sold comps map
Loading sold comps map…
Walkable amenities ~0.75 mi
Loading nearby amenities…
Taxation est. · year 1
- Rental income
- $11,429
- − Mortgage interest
- −$3,635
- − Property taxes
- −$974
- − Insurance
- −$324
- − Repairs & maintenance
- −$914
- − Management
- −$914
- − HOA
- −$2,640
- − Depreciation
- −$1,888
- Taxable income
- $139
- Est. tax owed @ 24.0%
- −$33
- After-tax cash flow
- $974/yr
For passive investors: Depreciation is non-cash, so a rental often shows a tax loss while cash-flowing — sheltering income. Rental losses are passive: they offset passive income freely, and up to $25,000/yr can offset ordinary (W-2) income if you actively participate and your MAGI is under $100k (phasing out to $0 by $150k); unused losses carry forward. On sale, claimed depreciation is recaptured at up to 25%, and gains may owe capital-gains tax (a 1031 exchange can defer both). Figures are a year-1 estimate at your 24.0% rate — not tax advice; consult a CPA.
Condition & rehab AI · 14 photos
This 2nd floor, one-bedroom/one-bath condo unit is in good condition with updated appliances and flooring. It's a low-maintenance rental investment with a good return on investment.
Value-add opportunities
- Both Painting exterior and interior walls — Enhances curb appeal and interior aesthetics
- Both Landscaping and curb appeal improvements — Improves property's visual appeal and marketability
- Both HVAC maintenance and tune-up — Ensures efficient heating and cooling, reducing energy costs and improving comfort
Renovation cost estimate screening
Value-add ROI direction
- Both Painting exterior and interior walls — Enhances curb appeal and interior aesthetics ↑
- Both Landscaping and curb appeal improvements — Improves property's visual appeal and marketability ↑
- Both HVAC maintenance and tune-up — Ensures efficient heating and cooling, reducing energy costs and improving comfort ↑
ⓘ Cost ranges are severity-bucket heuristics (US national rule-of-thumb). Get contractor quotes + a written scope before underwriting a rehab budget.
Schools (NCES district)
- District
- Marysville Public Schools
- NCES district ID
- 2623040
- Math proficiency
- 42% ▼ -14.00%
- Reading proficiency
- 53% ▼ -12.00%
- Median HH income
- $58,817
- Composite
- 41.51/100
- National rank
- #3454
- State rank
- #115 of 540 in MI
Livability — Marysville
- Score
- 78/100
- State rank
- #114
- US rank
- #2700
Category grades
Schools grade is shown separately in the Schools card above.
Census & demographics
- Census place
- Marysville, MI
- City population
- 9,942
- Population (ZIP)
- 9,942
Population outlook (St. Clair County) Hauer SSP2
- Today (2025)
- 154,587 people
- By 2030
- 150,031 · -2.9%
- By 2040
- 138,177 · -10.6%
- By 2050
- 124,390 · -19.5%
- By 2075
- 95,825 · -38.0%
- By 2100
- 68,672 · -55.6%
Race, ethnicity, and origin ACS 2023
- Neighborhood character
- Predominantly White (93%)
- Race & ethnicity
- White 93% Two or more races 3% Hispanic / Latino 1% Asian 1% Black 1%
- Common ancestry
- Romanian 11% Iranian 6% Lithuanian 5%
- Foreign-born
- 2% · Canada, Philippines
- Languages at home
- 98% English-only · Other Asian/Pacific 1%
Political lean MEDSL · St. Clair
- 2024 margin
- Solid R (+34.6) · D 32.0% · R 66.6% · Other 1.4%
- 2008→2024 swing
- -37.3pp toward R · 2008: 2.6pp · 2024: -34.6pp
- All cycles
- 2024: R+34.6 2020: R+30.2 2016: R+31.4 2012: R+7.1 2008: D+2.6
Not yet ingested
- Civics
- —
Market trends
- HPI YoY
- ▼ -98.64%
- Current HPI
- 188.3932
- Rent YoY
- —
- Metro
- —
- State GDP YoY
- ▲ 1.37%
- F500 in state
- 28
Industry mix (Fortune 500 HQ in MI)
| Industry | F500 HQs | Revenue |
|---|---|---|
| Automotive Parts | 3 | $48B |
|
||
| Automotive | 2 | $372B |
|
||
| Chemicals | 1 | $45B |
|
||
| Automotive Retail | 1 | $29B |
|
||
| Healthcare / Medical Devices | 1 | $23B |
|
||
| Automotive Technology | 1 | $20B |
|
||
Price history
1 event — show timeline
- 2026-05-22 Listed $64,900 MiRealSource-MiMLS
Cash-flow waterfall
monthlySold comps — $/sqft
last 12 mo · ≤1 miLoading sold comps…