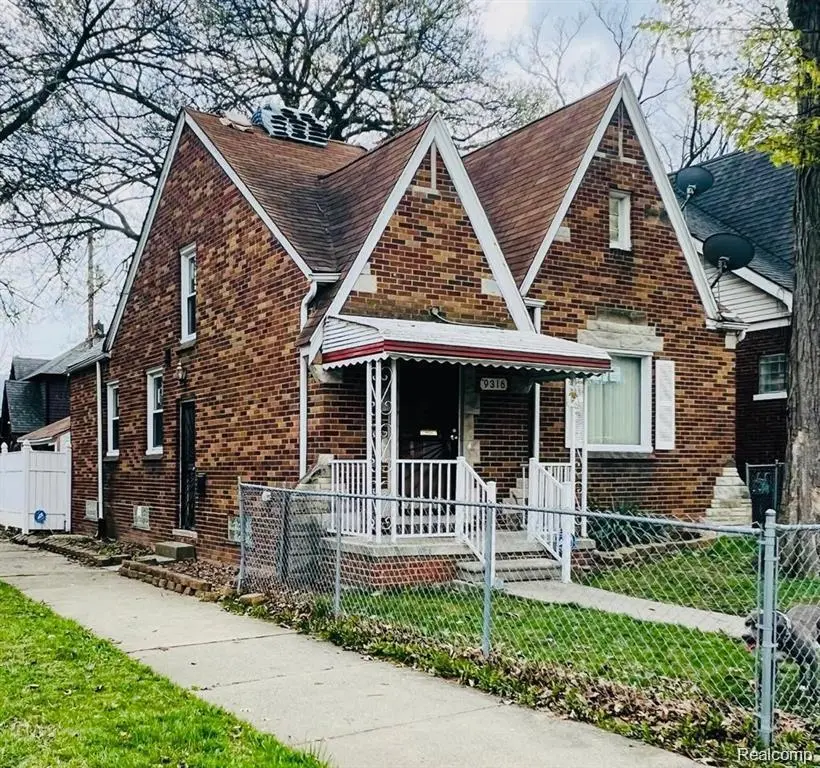
9316 Mckinney St · Detroit, MI
Flood risk 1/10 · Minimal
- FEMA flood zone
- X (unshaded)
- Chance of flooding over 30 yrs
- 0.0%
- Est. flood insurance / yr
- $473 – $860
Fire risk 1/10 · Minimal
- Est. fire insurance / yr
- $784 – $1,456
Heat risk 3/10 · Minor
- Hot days now (above 95°F)
- 7 days/yr
- Hot days in 30 yrs
- 15 days/yr
Wind risk 2/10 · Minimal
- Chance of severe wind over 30 yrs
- —
Air-quality risk 3/10 · Minor
- Unhealthy air days now
- 2 days/yr
- Unhealthy air days in 30 yrs
- 5 days/yr
Risk factors via First Street. Map © Google.
Why this score? — see what drove the C grade
The composite is a weighted blend of 9 inputs, each scored 0–100. Each bar is that input's sub-score; the figure is the points it added to the 100-point composite (weight × sub-score).
- Cash flow +28.9/30.0
- DSCR +10.0/10.0
- 1% rule +8.7/10.0
- Livability +3.7/5.0
- Rent growth +2.7/5.0
- Condition / age +2.5/5.0
- Schools +1.3/10.0
- ARV discount +0.0/15.0
- Appreciation +0.0/10.0
$125,000
🖨 Deal sheet 📄 Offer letter ✓ Due diligence
Listing remarks MLS
Built during Detroit’s mid-century housing boom, homes in Yorkshire Woods are known for their quality craftsmanship and enduring appeal. Expect classic features such as hardwood floors, coved ceilings, arched entryways, and detailed brickwork, all set along tree lined streets that give the neighborhood its warm, established feel. Yorkshire Woods features an impressive mix of brick bungalows, Tudor-style homes, and Colonial Revivals, many built between the 1930s–1960s, offering charm rarely found in newer construction. The neighborhood is supported by an active community organization that hosts events, clean-ups, and beautification projects like the Four Angels Garden, helping maintain pride of ownership and neighborhood stability. Property is currently being rented for $1,875 per month. Property is 1 of 11 in a portfolio being sold all within the Downtown Area. Buy 1 or as many as you would like. MLS#s for the other 10 properties: 20261015005, 20261015035, 20261015052, 20261015057, 20261015574, 20261015576, 20261015577, 20261015578, 20261015586, 20261015683
Key facts
- Brick bungalows
- Detailed brickwork
- Coved ceilings
Tags
Neighborhood map
What this means for you Summary
Snapshot
- This is a 5-bed/1.0-bath single-family listed at $125k.
Deal economics
- At list price, monthly cash flow is $424 ($5k/yr) — positive.
- The deal already cash-flows at list — no discount required.
- Meets the 1% rule at list price ($2k rent vs $125k).
- Recommended offer: $114k (9.0% below list) — sets the bar for market timing.
Location & tenants
- Location reads 73/100 on livability (#218 in MI) — a middle-class / working-renter tenant base. Strengths: amenities A+, commute A+, cost of living A+; Watch: schools F, crime F, employment F.
- Detroit Public Schools Community District (urban): math 10% / reading 24% proficiency, ranked #499 of 540 in MI (top 92%) — low school quality limits family demand, transient renter base, plan for 1-2y turnover; 90% free/reduced lunch — lower-income household profile, screen leases tightly.
- Market conditions: Rents flat; 484 active listings in the ZIP; 6 comparable units currently listed for rent nearby; rentals lingering (median 44d on market — plan ~5-8 weeks vacancy on turnover, expect pricing pressure); 50% of comp listings sitting > 30 days — soft ceiling on asking rent; lower-income renter base — watch delinquency; 2,639 units permitted in Wayne County in 2024 (1,216 in 5+ unit buildings).
- At $1,716/mo this rent would consume 46% of the median local household income ($45k/yr) (locally 2515% of renters already pay >50% of income on rent) — very limited rent-growth headroom before tenants either downsize or default.
Forward outlook
- Local home prices are declining (-3.0%/yr); year-one equity from $864 of loan paydown is wiped out by about $4k of value loss. Plan a longer hold.
- Wayne County population projected at -17% by 2050 — secular population decline; favor cash flow + early exit over multi-decade hold.
Negotiation context
- It's been on market 93 days — a 9% lower offer ($114k) is reasonable based on typical stale-listing flexibility.
- 6 sale attempts since 31y ago; this cycle's ask has dropped $25k (17%) from the opening price — seller is motivated, your offer sets the floor, not the list.
Risks & watch-outs
- Watch-outs: built in 1938 — expect roof / HVAC / electrical / plumbing capex.
Questions for the listing agent
- It's been on market 93 days. Have you received any prior offers? Is the seller open to a 9% concession, seller financing, or rate buy-down credit?
- Built in 1938 — when were the roof, HVAC, electrical panel, plumbing, and water heater last replaced?
- Why hasn't it sold? Are there any deal-killer items the seller is aware of (foundation, flood, title, zoning, code violations)?
- Is there a deadline driving the sale (1031 exchange, divorce, estate, relocation)? That informs how much negotiation room exists.
- Schools are F-rated, which usually means shorter tenancies and higher turnover. Who's the typical renter profile here, and what's been the actual vacancy rate?
- Crime grade is F in this area — have there been break-ins, vandalism, or insurance claims at this property in the last 3 years? What carrier currently insures it and at what premium?
- What's the average days-on-market for RENTAL listings here right now (not sales)? A rising rental-DOM trend means longer vacancies and softer asking-rent achievability than the comps imply.
- What's the recent tenant-quality profile in this submarket — average credit score on applications, eviction rate, late-payment / NSF rate, and stable-employment percentage? A property-management company in the area should have these aggregated.
- How much new for-sale + rental construction is in the pipeline within 1–3 miles? Heavy new supply typically softens prices + rents 12–24 months out; constrained supply supports both.
Investment metrics
- 1% rule
- 1.37% ✓
- Cap rate
- 10.36%
- Cash-on-cash
- 14.52%
- DSCR
- 1.65
- GRM
- 6.1
CMA / ARV
- ARV (median comp)
- $104,940
- List price
- $125,000
- Delta
- 19.12%
- Verdict
- OVERPRICED
- Comps
- 20 within 1.0 mi
Show comp detail 12 sales within ~0.75 mi
| Address | Dist | Beds/Ba | Sqft | Sold | Price | $/sf | Match |
|---|---|---|---|---|---|---|---|
| 9215 Bedford St | 0.15mi | 5/1.5 | 1,450 (+3%) | 12mo | $55,000 | $38 | 76 |
| 9444 Beaconsfield St | 0.28mi | 5/1.5 | 1,369 (-3%) | 6mo | $135,000 | $99 | 75 |
| 9211 Devonshire Rd | 0.06mi | 4/1.0 (-1) | 1,291 (-8%) | 10mo | $135,000 | $105 | 70 |
| 9142 Yorkshire Rd | 0.53mi | 5/1.5 | 1,450 (+3%) | 9mo | $65,000 | $45 | 60 |
| 5935 Devonshire Rd | 0.22mi | 4/1.0 (-1) | 1,560 (+11%) | 10mo | $165,000 | $106 | 59 |
| 9969 Bishop St | 0.52mi | 4/1.5 (-1) | 1,452 (+3%) | 8mo | $180,000 | $124 | 57 |
| 10024 Balfour Rd | 0.22mi | 4/2.0 (-1) | 1,600 (+14%) | 5mo | $155,000 | $97 | 54 |
| 9241 Manistique St | 0.66mi | 4/1.0 (-1) | 1,424 (+1%) | 14mo | $75,000 | $53 | 51 |
| 10442 Lakepointe St | 0.40mi | 4/2.0 (-1) | 1,314 (-7%) | 15mo | $142,000 | $108 | 49 |
| 5545 Maryland St | 0.68mi | 4/1.0 (-1) | 1,251 (-11%) | 6mo | $140,000 | $112 | 40 |
| 11161 Stockwell St | 0.71mi | 4/1.5 (-1) | 1,300 (-8%) | 12mo | $126,900 | $98 | 37 |
| 9184 Manistique St | 0.64mi | 4/1.0 (-1) | 1,237 (-12%) | 14mo | $47,000 | $38 | 33 |
Match score weights: distance 35% · size 25% · config 20% · recency 20%. Top-matched comps best support the ARV.
Projected returns pro-forma
-3.0% appreciation · 0.73% rent growth · sell at horizon
- IRR
- 2.3%
- Equity multiple
- 1.08×
- Total profit
- $2,957
- Equity at exit
- $18,638
- IRR
- 9.4%
- Equity multiple
- 1.64×
- Total profit
- $22,559
- Equity at exit
- $10,808
Cash invested: $35,000 (down + closing). Projections, not guarantees.
Landlord ↔ Tenant lean methodology
- Overall (STATE)
- 62 Landlord-Friendly
- State Michigan
- 62 Landlord-Friendly · EVEN
- County
- — inherits STATE
- City
- — inherits STATE
ZIP-level market 48224
- Rents YoY
- 0.7%
- Active inventory
- 484
- Price-to-rent
- 6.1×
Monthly cashflow live
- Estimated rent
- $1,716 high interval (Pro) →
- Mortgage (P&I)
- −$656
- Tax from tax record
- −$225 /mo · $2,698/yr
- Insurance
- −$52
- HOA
- −$0
- Vacancy / Maint / Mgmt
- −$360
- Net cashflow
- $424
Break-even live
UW: 25.0% down · 7.5% · 30yr · 1.5% tax · 5.0% vac · 8.0% maint · 8.0% mgmt
Financing live
Cash to close
- Down payment
- $31,250
- Closing costs
- $3,750
- Reserves months
- —
- Total cash needed
- —
Loan-product check · same deal, 3 products live
Conventional
25% down · 7.5% · 30yr
- Down + closing
- —
- Monthly P&I
- —
- Monthly cashflow
- —
- DSCR
- —
- Eligible?
- —
Personal DTI + credit; lowest rate.
DSCR
20% down · 8.5% · 30yr
- Down + closing
- —
- Monthly P&I
- —
- Monthly cashflow
- —
- DSCR
- —
- Eligible?
- —
No personal income docs; deal must DSCR.
Hard money
10% down · 12.0% · 12mo
- Down + closing
- —
- Monthly P&I
- —
- Monthly cashflow
- —
- DSCR
- —
- Eligible?
- —
Short-term bridge; refi at stabilization.
Rent comps 6 comps
| Address | Beds | Baths | Sqft | Rent | $/sqft | DOM | Units | Dist |
|---|---|---|---|---|---|---|---|---|
| 9635 Everts St Detroit, MI | 4.0 | 2.0 | 1450 | $1,650 | $1.14 | 44d | 1 | 0.34mi |
| 9142 Yorkshire Rd Detroit, MI | 5.0 | 1.5 | 1450 | $1,700 | $1.17 | 2d | 1 | 0.51mi |
| 10030 Bishop St Detroit, MI | 5.0 | 2.0 | 1721 | $1,200 | $0.70 | 17d | 1 | 0.52mi |
| 9171 Bishop St Detroit, MI | 4.0 | 1.0 | 1508 | $1,300 | $0.86 | 44d | 1 | 0.54mi |
| 11911 Lansdowne St Detroit, MI | 4.0 | 1.0 | 1350 | $1,400 | $1.04 | 44d | 1 | 1.03mi |
| 13395 Maiden St Detroit, MI | 5.0 | 2.0 | 1750 | $1,600 | $0.91 | 24d | 1 | 1.09mi |
Listing history 27 events
-
2026-06-18days on market $125,000 Active 93 DOM
-
2026-06-17days on market $125,000 Active 92 DOM
-
2026-06-15days on market $125,000 Active 90 DOM
-
2026-06-13days on market $125,000 Active 88 DOM
-
2026-06-13days on market $125,000 Active 87 DOM
-
2026-06-09days on market $125,000 Active 84 DOM
-
2026-06-08days on market $125,000 Active 83 DOM
-
2026-06-07days on market $125,000 Active 82 DOM
-
2026-06-04days on market $125,000 Active 79 DOM
-
2026-06-03days on market $125,000 Active 78 DOM
-
2026-06-01days on market $125,000 Active 76 DOM
-
2026-05-31days on market $125,000 Active 75 DOM
-
2026-03-17$150,000 Active 1085-char remark
Show marketing remark (1092 chars)
Built during Detroit's mid-century housing boom, homes in Yorkshire Woods are known for their quality craftsmanship and enduring appeal. Expect classic features such as hardwood floors, coved ceilings, arched entryways, and detailed brickwork, all set along tree lined streets that give the neighborhood its warm, established feel. Yorkshire Woods features an impressive mix of brick bungalows, Tudor-style homes, and Colonial Revivals, many built between the 1930s–1960s, offering charm rarely found in newer construction. The neighborhood is supported by an active community organization that hosts events, clean-ups, and beautification projects like the Four Angels Garden, helping maintain pride of ownership and neighborhood stability. Property is currently being rented for $1,875 per month. Property is 1 of 11 in a portfolio being sold all within the Downtown Area. Buy 1 or as many as you would like. MLS#s for the other 10 properties: 20261015005, 20261015035, 20261015052, 20261015057, 20261015574, 20261015576, 20261015577, 20261015578, 20261015586, 20261015683
-
2026-03-17$150,000 Active 1092-char remark
Show marketing remark (1092 chars)
Built during Detroit's mid-century housing boom, homes in Yorkshire Woods are known for their quality craftsmanship and enduring appeal. Expect classic features such as hardwood floors, coved ceilings, arched entryways, and detailed brickwork, all set along tree lined streets that give the neighborhood its warm, established feel. Yorkshire Woods features an impressive mix of brick bungalows, Tudor-style homes, and Colonial Revivals, many built between the 1930s–1960s, offering charm rarely found in newer construction. The neighborhood is supported by an active community organization that hosts events, clean-ups, and beautification projects like the Four Angels Garden, helping maintain pride of ownership and neighborhood stability. Property is currently being rented for $1,875 per month. Property is 1 of 11 in a portfolio being sold all within the Downtown Area. Buy 1 or as many as you would like. MLS#s for the other 10 properties: 20261015005, 20261015035, 20261015052, 20261015057, 20261015574, 20261015576, 20261015577, 20261015578, 20261015586, 20261015683
-
2026-02-21historical
-
2026-02-21historical
-
2025-10-06$149,900 Active
-
2025-10-06$149,900 Active
-
2023-05-19soldstatus $139,000
-
1997-02-12soldstatus $45,000
-
1997-01-24soldstatus $45,000
-
1997-01-18historical
-
1996-11-14$45,900
-
1995-11-21soldstatus $16,500
-
1995-11-02soldstatus $16,500
-
1995-03-29historical
-
1995-02-24$22,000
ⓘ Source: listings_history table (triggers on properties + properties_extension) + one-shot
backfill from property_details.listing_events for pre-trigger history.
Tax reassessment forecast MI · Partial reset (capped growth)
- Current annual tax
- $2,698 · $225/mo
- Projected year-2 tax
- $2,698 · $225/mo
- Expected delta
- $0/yr ($0/mo · 0.0%)
ⓘ Screening estimate from a state-policy table — verify with the county assessor before closing.
Climate risk First Street
- Flood 1/10 Low FEMA zone X (unshaded) · 0% chance over 30 yrs
- Wildfire 1/10 Low
- Heat 3/10 Moderate 7 d/yr ≥95°F today · 15 d/yr by 30 yrs out
- Wind 2/10 Low
- Air quality 3/10 Moderate 2 unhealthy d/yr today · 5 by 30 yrs out
Nearby sold comps map
Loading sold comps map…
Walkable amenities ~0.75 mi
Loading nearby amenities…
Taxation est. · year 1
- Rental income
- $20,598
- − Mortgage interest
- −$7,002
- − Property taxes
- −$2,698
- − Insurance
- −$625
- − Repairs & maintenance
- −$1,648
- − Management
- −$1,648
- − Depreciation
- −$3,636
- Taxable income
- $3,341
- Est. tax owed @ 24.0%
- −$802
- After-tax cash flow
- $4,281/yr
For passive investors: Depreciation is non-cash, so a rental often shows a tax loss while cash-flowing — sheltering income. Rental losses are passive: they offset passive income freely, and up to $25,000/yr can offset ordinary (W-2) income if you actively participate and your MAGI is under $100k (phasing out to $0 by $150k); unused losses carry forward. On sale, claimed depreciation is recaptured at up to 25%, and gains may owe capital-gains tax (a 1031 exchange can defer both). Figures are a year-1 estimate at your 24.0% rate — not tax advice; consult a CPA.
Schools (NCES district)
- District
- Detroit Public Schools Community District
- NCES district ID
- 2601103
- Math proficiency
- 10% ▼ -2.00%
- Reading proficiency
- 24% ▲ 6.00%
- Median HH income
- $25,815
- Composite
- 13.06/100
- National rank
- #9564
- State rank
- #499 of 540 in MI
Livability — Detroit
- Score
- 73/100
- State rank
- #218
- US rank
- #5427
Category grades
Schools grade is shown separately in the Schools card above.
Census & demographics
- Census place
- Detroit, MI
- County
- Wayne County · 1,562,939 people
- City population
- 572,865
- Metro
- Detroit-Warren-Dearborn, MI
- Population (ZIP)
- 39,668
- Household income
- $44,856
- Rent vs Own
- Severe rent burden
- 2515.0
Population outlook (Wayne County) Hauer SSP2
- Today (2025)
- 1,675,273 people
- By 2030
- 1,620,300 · -3.3%
- By 2040
- 1,502,341 · -10.3%
- By 2050
- 1,384,039 · -17.4%
- By 2075
- 1,124,592 · -32.9%
- By 2100
- 881,193 · -47.4%
Race, ethnicity, and origin ACS 2023
- Neighborhood character
- Predominantly Black (88%)
- Race & ethnicity
- Black 88% White 8% Two or more races 3% Hispanic / Latino 1%
- Common ancestry
- Iranian 1% Romanian 1% Lithuanian 1%
- Foreign-born
- 1%
- Languages at home
- 97% English-only · Spanish 2%
Political lean MEDSL · Wayne
- 2024 margin
- Strong D (+29.0) · D 62.7% · R 33.7% · Other 3.6%
- 2008→2024 swing
- -20.5pp toward R · 2008: 49.5pp · 2024: 29.0pp
- All cycles
- 2024: D+29.0 2020: D+38.1 2016: D+37.3 2012: D+46.9 2008: D+49.5
Not yet ingested
- Civics
- —
Market trends
- HPI YoY
- ▼ -226.38%
- Current HPI
- 161.886
- Rent YoY
- ▲ 0.73%
- Metro
- Detroit-Warren-Dearborn, MI
- State GDP YoY
- ▲ 1.37%
- F500 in state
- 28
Industry mix (Fortune 500 HQ in MI)
| Industry | F500 HQs | Revenue |
|---|---|---|
| Automotive Parts | 3 | $48B |
|
||
| Automotive | 2 | $372B |
|
||
| Chemicals | 1 | $45B |
|
||
| Automotive Retail | 1 | $29B |
|
||
| Healthcare / Medical Devices | 1 | $23B |
|
||
| Automotive Technology | 1 | $20B |
|
||
Price history
+581.8% since first listed15 events — show timeline
- 2026-03-17 Listed $150,000 REALCOMP
- 2026-03-17 Listed $150,000 MiRealSource-MiMLS
- 2026-02-21 Listing Removed — MiRealSource-MiMLS
- 2026-02-21 Listing Removed — REALCOMP
- 2025-10-06 Listed $149,900 REALCOMP
- 2025-10-06 Listed $149,900 MiRealSource-MiMLS
- 2023-05-19 Sold (Public Records) $139,000 Public Records
- 1997-02-12 Sold (Public Records) $45,000 Public Records
- 1997-01-24 Sold (MLS) $45,000 MiRealSource-MiMLS
- 1997-01-18 Listing Removed — MiRealSource-MiMLS
- 1996-11-14 Listed $45,900 MiRealSource-MiMLS
- 1995-11-21 Sold (Public Records) $16,500 Public Records
- 1995-11-02 Sold (MLS) $16,500 MiRealSource-MiMLS
- 1995-03-29 Listing Removed — MiRealSource-MiMLS
- 1995-02-24 Listed $22,000 MiRealSource-MiMLS
Property tax history
+3.4%/yrLatest (2025): $2,698 · -38.0% YoY. Source: county tax records.
Cash-flow waterfall
monthlySold comps — $/sqft
last 12 mo · ≤1 miLoading sold comps…