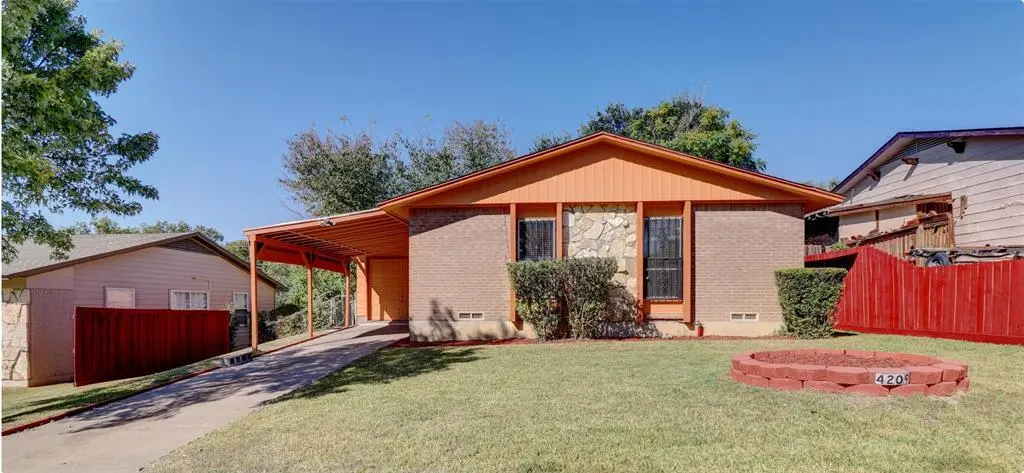
4209 Leland College Dr · Dallas, TX
Flood risk 1/10 · Minimal
- FEMA flood zone
- X (unshaded)
- Chance of flooding over 30 yrs
- 0.0%
- Est. flood insurance / yr
- $507 – $1,088
Fire risk 3/10 · Minor
- Est. fire insurance / yr
- $1,222 – $2,270
Heat risk 7/10 · Major
- Hot days now (above 110°F)
- 7 days/yr
- Hot days in 30 yrs
- 25 days/yr
Wind risk 6/10 · Moderate
- Chance of severe wind over 30 yrs
- 27.0%
Air-quality risk 2/10 · Minimal
- Unhealthy air days now
- 1 days/yr
- Unhealthy air days in 30 yrs
- 2 days/yr
Risk factors via First Street. Map © Google.
Why this score? — see what drove the C- grade
The composite is a weighted blend of 9 inputs, each scored 0–100. Each bar is that input's sub-score; the figure is the points it added to the 100-point composite (weight × sub-score).
- Cash flow +15.5/30.0
- ARV discount +14.7/15.0
- 1% rule +4.9/10.0
- DSCR +4.8/10.0
- Livability +4.0/5.0
- Schools +2.8/10.0
- Condition / age +2.5/5.0
- Rent growth +1.8/5.0
- Appreciation +0.0/10.0
$195,000
🖨 Deal sheet 📄 Offer letter ✓ Due diligence
Listing remarks MLS
Motivated Seller. If you are looking for the perfect home, great curb appeal, and lots of parking. Stop looking because this is the home for you. Home offers 3 bedroom, one and a half bath. Laminate floors, fresh paint and good size rooms. Master has his and hers closets. Perfect home for entertaining, downsizing or the perfect stater and forever home. Large backyard perfect if you need additional parking, love to do projects, or perfect for family gatherings. Walking distance from the park. Easy access to shopping, freeways, schools, close to downtown. Come see it today.. Seller is offering 5k to the Buyers for upgrades or towards closing cost but will not do any repairs.
Key facts
- Laminate floors
- Fresh paint
- Lots of parking
Tags
Neighborhood map
What this means for you Summary
Snapshot
- This is a 3-bed/1.5-bath single-family listed at $195k.
Deal economics
- At list price, monthly cash flow is $78 ($940/yr) — positive.
- The deal already cash-flows at list — no discount required.
- To meet the 1% rule (rent ≥ 1% of price), the offer needs to be $193k (0.9% below list).
- Recommended offer: $193k (0.9% below list) — sets the bar for 1% rule.
- Cap rate 6.8% vs local median 2.3% in Dallas — top-decile yield for the area; either an underpriced asset or a hidden risk that comps aren't pricing in. Stress-test before assuming the spread holds.
Location & tenants
- Location reads 81/100 on livability (#24 in TX, #1,380 nationally) — a professional / high-income tenant draw. Strengths: amenities A+, commute A+, housing A+; Watch: schools C-, crime F.
- Dallas ISD (urban): math 31% / reading 36% proficiency, ranked #559 of 826 in TX (top 68%) — families likely to look elsewhere, expect single-tenant / working-renter base with shorter leases; 83% free/reduced lunch — lower-income household profile, screen leases tightly.
- Market conditions: Rents soft (-2.8%/yr); 207 active listings in the ZIP; 20 comparable units currently listed for rent nearby; rentals at typical pace (median 17d on market — plan ~3-4 weeks tenant-placement turnaround); 12,577 units permitted in Dallas County in 2024 (6,829 in 5+ unit buildings).
- This rent runs 43% of the median local income ($54k/yr) — at the standard rent-burdened threshold; future hikes will face affordability resistance.
Forward outlook
- Local home prices are declining (-3.0%/yr); year-one equity from $1k of loan paydown is wiped out by about $6k of value loss. Plan a longer hold.
- Dallas County population projected at +35% by 2050 — long-run rental-demand tailwind backs the buy-and-hold thesis.
Negotiation context
- Only 12 days on market — expect competitive offers; lowballing is unlikely to land.
- 2 sale attempts with the ask held roughly flat each time — persistent listings suggest the price (not the market) is what's stuck; bring a comps-based counter.
- Current owner paid $20k; list at $195k implies a 877% gain — meaningful room to come down on a strong offer.
Risks & watch-outs
- Climate carrying-cost: major wind risk, 27% chance of damaging wind over 30y; extreme-heat days projected 7→25/yr by 2055 (HVAC capex compounding) — expect insurance premiums to compound above CPI over the hold.
Questions for the listing agent
- Built in 1966 — when were the roof, HVAC, electrical panel, plumbing, and water heater last replaced?
- Is there a deadline driving the sale (1031 exchange, divorce, estate, relocation)? That informs how much negotiation room exists.
- Crime grade is F in this area — have there been break-ins, vandalism, or insurance claims at this property in the last 3 years? What carrier currently insures it and at what premium?
- What's the average days-on-market for RENTAL listings here right now (not sales)? A rising rental-DOM trend means longer vacancies and softer asking-rent achievability than the comps imply.
- What's the recent tenant-quality profile in this submarket — average credit score on applications, eviction rate, late-payment / NSF rate, and stable-employment percentage? A property-management company in the area should have these aggregated.
- How much new for-sale + rental construction is in the pipeline within 1–3 miles? Heavy new supply typically softens prices + rents 12–24 months out; constrained supply supports both.
Investment metrics
- 1% rule
- 0.99% ✗
- Cap rate
- 6.78%
- Cash-on-cash
- 1.72%
- DSCR
- 1.08
- GRM
- 8.4
CMA / ARV
- ARV (median comp)
- $232,026
- List price
- $195,000
- Delta
- -15.96%
- Verdict
- UNDERPRICED
- Comps
- 20 within 1.0 mi
Show comp detail 12 sales within ~0.75 mi
| Address | Dist | Beds/Ba | Sqft | Sold | Price | $/sf | Match |
|---|---|---|---|---|---|---|---|
| 4209 Leland College Dr | 0.00mi | 3/1.5 | 1,108 (0%) | 1mo | $195,000 | $176 | 99 |
| 6347 Racer Summit Dr | 0.17mi | 3/2.0 | 1,175 (+6%) | 1mo | $294,900 | $251 | 80 |
| 6331 Crosswood Ln | 0.19mi | 3/2.0 | 1,175 (+6%) | 1mo | $295,900 | $252 | 78 |
| 4270 Rust College Dr | 0.20mi | 3/1.5 | 1,048 (-5%) | 6mo | $199,000 | $190 | 76 |
| 6334 Racer Summit Dr | 0.18mi | 3/2.0 | 1,175 (+6%) | 8mo | $291,900 | $248 | 73 |
| 4079 Lava Forest Dr | 0.27mi | 3/2.0 | 1,175 (+6%) | 5mo | $291,900 | $248 | 72 |
| 4139 Silverhill Dr | 0.29mi | 3/2.0 | 1,175 (+6%) | 4mo | $288,900 | $246 | 71 |
| 4215 Sweet Fennel Dr | 0.29mi | 3/2.0 | 1,175 (+6%) | 8mo | $268,900 | $229 | 68 |
| 4250 Mehalia Dr | 0.40mi | 3/1.0 | 1,044 (-6%) | 7mo | $185,000 | $177 | 64 |
| 3707 Stateoak Dr | 0.65mi | 3/1.0 | 1,221 (+10%) | 5mo | $194,000 | $159 | 46 |
| 3832 Stateoak Dr | 0.59mi | 3/2.0 | 1,250 (+13%) | 7mo | $199,000 | $159 | 43 |
| 5952 Golden Gate Dr | 0.55mi | 4/2.0 (+1) | 1,272 (+15%) | 6mo | $239,000 | $188 | 37 |
Match score weights: distance 35% · size 25% · config 20% · recency 20%. Top-matched comps best support the ARV.
Projected returns pro-forma
-3.0% appreciation · 0.0% rent growth · sell at horizon
- IRR
- -17.2%
- Equity multiple
- 0.41×
- Total profit
- $-32,178
- Equity at exit
- $29,075
- IRR
- -16.6%
- Equity multiple
- 0.21×
- Total profit
- $-43,104
- Equity at exit
- $16,860
Cash invested: $54,600 (down + closing). Projections, not guarantees.
Landlord ↔ Tenant lean methodology
- Overall (STATE)
- 87 Strongly Landlord-Friendly
- State Texas
- 87 Strongly Landlord-Friendly · R+5
- County
- — inherits STATE
- City
- — inherits STATE
ZIP-level market 75241
- Home prices YoY
- -16.9%
- Rents YoY
- -2.8%
- Active inventory
- 207
- Price-to-rent
- 8.4×
Monthly cashflow live
- Estimated rent
- $1,932 high interval (Pro) →
- Mortgage (P&I)
- −$1,023
- Tax from tax record
- −$344 /mo · $4,128/yr
- Insurance
- −$81
- HOA
- −$0
- Vacancy / Maint / Mgmt
- −$406
- Net cashflow
- $78
Break-even live
UW: 25.0% down · 7.5% · 30yr · 1.5% tax · 5.0% vac · 8.0% maint · 8.0% mgmt
Financing live
Cash to close
- Down payment
- $48,750
- Closing costs
- $5,850
- Reserves months
- —
- Total cash needed
- —
Loan-product check · same deal, 3 products live
Conventional
25% down · 7.5% · 30yr
- Down + closing
- —
- Monthly P&I
- —
- Monthly cashflow
- —
- DSCR
- —
- Eligible?
- —
Personal DTI + credit; lowest rate.
DSCR
20% down · 8.5% · 30yr
- Down + closing
- —
- Monthly P&I
- —
- Monthly cashflow
- —
- DSCR
- —
- Eligible?
- —
No personal income docs; deal must DSCR.
Hard money
10% down · 12.0% · 12mo
- Down + closing
- —
- Monthly P&I
- —
- Monthly cashflow
- —
- DSCR
- —
- Eligible?
- —
Short-term bridge; refi at stabilization.
Rent comps 20 comps
| Address | Beds | Baths | Sqft | Rent | $/sqft | DOM | Units | Dist |
|---|---|---|---|---|---|---|---|---|
| 4140 Wilshire Blvd Dallas, TX | 3.0 | 2.0 | 1125 | $1,795 | $1.60 | 17d | 1 | 0.18mi |
| 6347 Racer Summit Dr Dallas, TX | 3.0 | 2.0 | 1175 | $1,965 | $1.67 | 24d | 1 | 0.21mi |
| 6319 Crosswood Ln Dallas, TX | 3.0 | 2.0 | 1316 | $2,060 | $1.57 | 20d | 1 | 0.25mi |
| 6445 Baraboo Dr Dallas, TX | 4.0 | 1.5 | 1218 | $1,650 | $1.35 | 43d | 1 | 0.32mi |
| 4281 Lava Forest Dr Dallas, TX | 3.0–5.0 | 2.0–2.5 | 1840 | $2,050 | $1.11 | 1d | 1 | 0.35mi |
| 3623 Softcloud Dr Dallas, TX | 3.0 | 2.0 | 1477 | $1,910 | $1.29 | 43d | 1 | 0.81mi |
| 3440 Simpson Stuart Rd Dallas, TX | 1.0–3.0 | 1.0–2.0 | 942 | $2,103 | $2.23 | 1d | 9 | 0.93mi |
| 3806 Castle Hills Dr Dallas, TX | 4.0 | 2.0 | 1422 | $1,900 | $1.34 | 16d | 1 | 1.00mi |
| 3522 Tioga St Dallas, TX | 4.0 | 3.0 | 1438 | $2,095 | $1.46 | 4d | 1 | 1.02mi |
| 3835 Basswood Dr Dallas, TX | 3.0 | 2.0 | 1000 | $1,625 | $1.62 | 24d | 1 | 1.04mi |
| 6654 Cool Morn Dr Dallas, TX | 3.0 | 2.0 | 1446 | $2,300 | $1.59 | 43d | 1 | 1.04mi |
| 5850 Highland Hills Dr Dallas, TX | 2.0–4.0 | 1.0–2.0 | 910 | $1,083 | $1.19 | 2d | 9 | 1.12mi |
| 5821 Bonnie View Rd Dallas, TX | 1.0–3.0 | 1.0–2.0 | 820 | $1,101 | $1.34 | 7d | 7 | 1.13mi |
| 6436 Moonhill Dr Dallas, TX | 4.0 | 2.0 | 1200 | $1,961 | $1.63 | 2d | 1 | 1.15mi |
| 3528 Keyridge Dr Dallas, TX | 3.0 | 2.0 | 1362 | $1,795 | $1.32 | 20d | 1 | 1.22mi |
| 6327 Hidden Trail Dr Dallas, TX | 3.0 | 2.0 | 1187 | $1,795 | $1.51 | 43d | 1 | 1.24mi |
| 6520 Warm Moon Ln Dallas, TX | 4.0 | 2.0 | 1237 | $1,995 | $1.61 | 4d | 1 | 1.25mi |
| 5761 Highland Hills Dr Dallas, TX | 1.0–3.0 | 1.0–2.0 | 1040 | $1,749 | $1.68 | 3d | 7 | 1.27mi |
| 3131 Simpson Stuart Rd Dallas, TX | 1.0–3.0 | 1.0–2.0 | 1024 | $1,694 | $1.65 | 3d | 33 | 1.28mi |
| 3210 Little River Dr Dallas, TX | 3.0 | 2.0 | 1202 | $1,950 | $1.62 | 4d | 1 | 1.47mi |
Listing history 8 events
-
2026-05-03status Pending 683-char remark
Show marketing remark (683 chars)
Motivated Seller. If you are looking for the perfect home, great curb appeal, and lots of parking. Stop looking because this is the home for you. Home offers 3 bedroom, one and a half bath. Laminate floors, fresh paint and good size rooms. Master has his and hers closets. Perfect home for entertaining, downsizing or the perfect stater and forever home. Large backyard perfect if you need additional parking, love to do projects, or perfect for family gatherings. Walking distance from the park. Easy access to shopping, freeways, schools, close to downtown. Come see it today.. Seller is offering 5k to the Buyers for upgrades or towards closing cost but will not do any repairs.
-
2026-05-02historical Active Option Contract 683-char remark
Show marketing remark (683 chars)
Motivated Seller. If you are looking for the perfect home, great curb appeal, and lots of parking. Stop looking because this is the home for you. Home offers 3 bedroom, one and a half bath. Laminate floors, fresh paint and good size rooms. Master has his and hers closets. Perfect home for entertaining, downsizing or the perfect stater and forever home. Large backyard perfect if you need additional parking, love to do projects, or perfect for family gatherings. Walking distance from the park. Easy access to shopping, freeways, schools, close to downtown. Come see it today.. Seller is offering 5k to the Buyers for upgrades or towards closing cost but will not do any repairs.
-
2026-04-21$195,000 Active 683-char remark
Show marketing remark (683 chars)
Motivated Seller. If you are looking for the perfect home, great curb appeal, and lots of parking. Stop looking because this is the home for you. Home offers 3 bedroom, one and a half bath. Laminate floors, fresh paint and good size rooms. Master has his and hers closets. Perfect home for entertaining, downsizing or the perfect stater and forever home. Large backyard perfect if you need additional parking, love to do projects, or perfect for family gatherings. Walking distance from the park. Easy access to shopping, freeways, schools, close to downtown. Come see it today.. Seller is offering 5k to the Buyers for upgrades or towards closing cost but will not do any repairs.
-
2026-04-15historical
-
2025-10-15$209,000 Active
-
1997-10-13soldstatus
-
1997-09-16soldstatus $19,950
-
1997-09-10soldstatus
ⓘ Source: listings_history table (triggers on properties + properties_extension) + one-shot
backfill from property_details.listing_events for pre-trigger history.
Tax reassessment forecast TX · Resets to sale price
- Current annual tax
- $4,128 · $344/mo
- Projected year-2 tax
- $4,128 · $344/mo
- Expected delta
- $0/yr ($0/mo · 0.0%)
ⓘ Screening estimate from a state-policy table — verify with the county assessor before closing.
Climate risk First Street
- Flood 1/10 Low FEMA zone X (unshaded) · 0% chance over 30 yrs
- Wildfire 3/10 Moderate
- Heat 7/10 Severe 7 d/yr ≥110°F today · 25 d/yr by 30 yrs out
- Wind 6/10 Major 27% chance of damaging wind over 30 yrs
- Air quality 2/10 Low 1 unhealthy d/yr today · 2 by 30 yrs out
Nearby sold comps map
Loading sold comps map…
Walkable amenities ~0.75 mi
Loading nearby amenities…
Taxation est. · year 1
- Rental income
- $23,183
- − Mortgage interest
- −$10,923
- − Property taxes
- −$4,128
- − Insurance
- −$975
- − Repairs & maintenance
- −$1,855
- − Management
- −$1,855
- − Depreciation
- −$5,673
- Taxable loss
- −$2,225
- Est. tax savings @ 24.0%
- +$534
- After-tax cash flow
- $1,474/yr
For passive investors: Depreciation is non-cash, so a rental often shows a tax loss while cash-flowing — sheltering income. Rental losses are passive: they offset passive income freely, and up to $25,000/yr can offset ordinary (W-2) income if you actively participate and your MAGI is under $100k (phasing out to $0 by $150k); unused losses carry forward. On sale, claimed depreciation is recaptured at up to 25%, and gains may owe capital-gains tax (a 1031 exchange can defer both). Figures are a year-1 estimate at your 24.0% rate — not tax advice; consult a CPA.
Schools (NCES district)
- District
- Dallas ISD
- NCES district ID
- 4816230
- Math proficiency
- 31% ▼ -16.00%
- Reading proficiency
- 36% ▼ -4.00%
- Median HH income
- $42,881
- Composite
- 28.41/100
- National rank
- #6763
- State rank
- #559 of 826 in TX
Livability — Dallas
- Score
- 81/100
- State rank
- #24
- US rank
- #1380
Category grades
Schools grade is shown separately in the Schools card above.
Census & demographics
- Census place
- Dallas, TX
- County
- Dallas County · 2,612,404 people
- City population
- 1,168,437
- Metro
- Dallas-Fort Worth-Arlington, TX
- Population (ZIP)
- 33,840
- Household income
- $53,998
- Rent vs Own
- Severe rent burden
- 1076.0
Population outlook (Dallas County) Hauer SSP2
- Today (2025)
- 2,979,839 people
- By 2030
- 3,191,823 · +7.1%
- By 2040
- 3,619,611 · +21.5%
- By 2050
- 4,026,915 · +35.1%
- By 2075
- 4,957,073 · +66.4%
- By 2100
- 5,508,725 · +84.9%
Race, ethnicity, and origin ACS 2023
- Neighborhood character
- Majority Black (62%)
- Race & ethnicity
- Black 62% Hispanic / Latino 30% Two or more races 8% White 5% Native American 2%
- Hispanic origin (detail)
- Mexican 24%
- Foreign-born
- 13% · Canada
- Languages at home
- 73% English-only · Spanish 25%
Political lean MEDSL · Dallas
- 2024 margin
- Strong D (+22.2) · D 60.2% · R 38.0% · Other 1.8%
- 2008→2024 swing
- +6.9pp toward D · 2008: 15.3pp · 2024: 22.2pp
- All cycles
- 2024: D+22.2 2020: D+31.6 2016: D+26.2 2012: D+15.4 2008: D+15.3
Not yet ingested
- Civics
- —
Market trends
- HPI YoY
- ▼ -72.36%
- Current HPI
- 356.2348
- Rent YoY
- ▼ -2.75%
- Metro
- Dallas-Fort Worth-Arlington, TX
- State GDP YoY
- ▲ 3.95%
- F500 in state
- 110
Industry mix (Fortune 500 HQ in TX)
| Industry | F500 HQs | Revenue |
|---|---|---|
| Energy | 16 | $1,198B |
|
||
| Technology | 5 | $198B |
|
||
| Engineering / Construction | 4 | $72B |
|
||
| Energy Services | 3 | $60B |
|
||
| Utilities | 3 | $41B |
|
||
| Healthcare | 2 | $330B |
|
||
Price history
+877.4% since first listed8 events — show timeline
- 2026-05-03 Pending — NTREIS
- 2026-05-02 Contingent — NTREIS
- 2026-04-21 Listed $195,000 NTREIS
- 2026-04-15 Listing Removed — NTREIS
- 2025-10-15 Listed $209,000 NTREIS
- 1997-10-13 Sold (Public Records) — Public Records
- 1997-09-16 Sold (Public Records) $19,950 Public Records
- 1997-09-10 Sold (Public Records) — Public Records
Property tax history
+10.2%/yrLatest (2025): $4,128 · -8.8% YoY. Source: county tax records.
Cash-flow waterfall
monthlySold comps — $/sqft
last 12 mo · ≤1 miLoading sold comps…