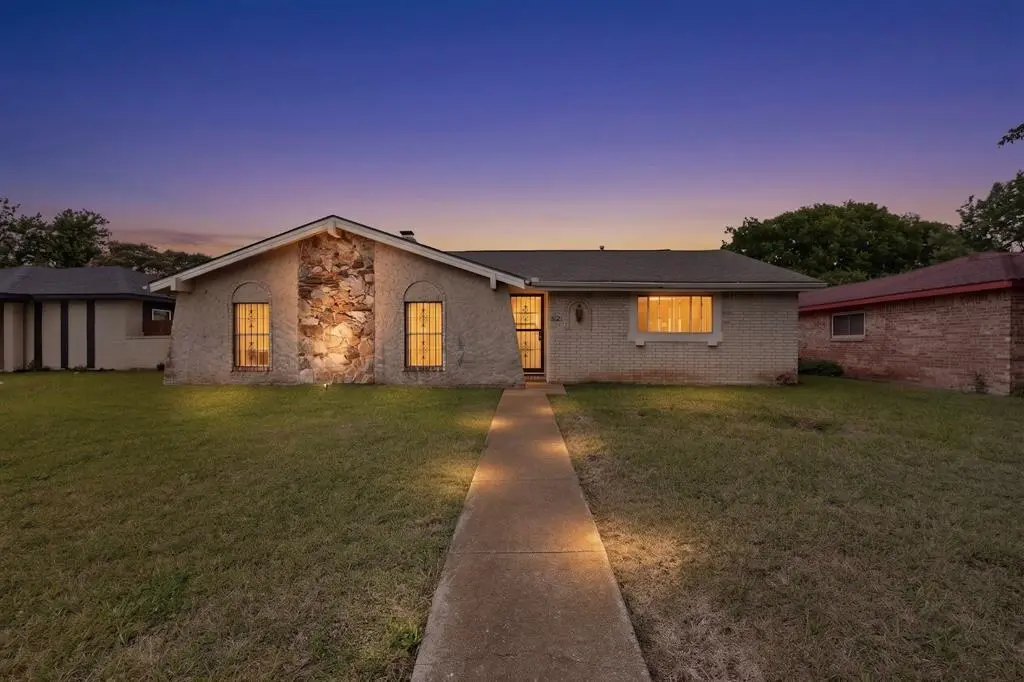
821 Cherry Hills Dr · Lancaster, TX
Flood risk 1/10 · Minimal
- FEMA flood zone
- X (unshaded)
- Chance of flooding over 30 yrs
- 0.0%
- Est. flood insurance / yr
- $507 – $1,088
Fire risk 3/10 · Minor
- Est. fire insurance / yr
- $1,222 – $2,270
Heat risk 7/10 · Major
- Hot days now (above 110°F)
- 7 days/yr
- Hot days in 30 yrs
- 25 days/yr
Wind risk 6/10 · Moderate
- Chance of severe wind over 30 yrs
- 27.0%
Air-quality risk 2/10 · Minimal
- Unhealthy air days now
- 2 days/yr
- Unhealthy air days in 30 yrs
- 2 days/yr
Risk factors via First Street. Map © Google.
Why this score? — see what drove the C- grade
The composite is a weighted blend of 9 inputs, each scored 0–100. Each bar is that input's sub-score; the figure is the points it added to the 100-point composite (weight × sub-score).
- Cash flow +15.6/30.0
- ARV discount +15.0/15.0
- 1% rule +5.4/10.0
- DSCR +4.8/10.0
- Livability +3.1/5.0
- Rent growth +2.6/5.0
- Condition / age +2.5/5.0
- Schools +2.1/10.0
- Appreciation +0.0/10.0
$220,000
🖨 Deal sheet 📄 Offer letter ✓ Due diligence
Listing remarks
Welcome home to 821 Cherry Hills Drive in Lancaster, Texas! This well-maintained single-story ranch-style home offers 3 bedrooms, 2 bathrooms, and timeless charm with thoughtful updates throughout. Built in the 1970s, the home features updated bathrooms, an enclosed garage that provides additional flexible living space, and a roof that is only six years old for added peace of mind. Situated on a spacious lot, there's plenty of room to enjoy outdoor entertaining, gardening, or simply relaxing in your private backyard. The home is within walking distance of Dallas College Cedar Valley Campus and the Lancaster Veteran's Memorial Park. The functional floor plan provides comfortable living space
Key facts
- Enclosed garage
- Private backyard
- Spacious lot
Tags
Property features AI
Finance
- Other: Lot is less than 0.5 acre (approx. 0.165 acre); Subdivision: Brookhaven Estates; County: Dallas
- Financial info: Listing accepts Cash, Conventional, FHA, FHA-203K, Texas Vet, and VA loans
- HOA & community: No association
Exterior
- Parking: No garage or covered parking
- Security: Owned security system; Audio and video surveillance present
- Utilities: City water; City sewer; Cable available
- Home design: Single-family residence; One story; Residential property
- Construction: Built in 1974; Brick and frame construction; Slab foundation; Composition roof
- Exterior features: Chain link fencing; Alley access; Driveway
Interior
- Kitchen: Electric range
- Bedrooms: Primary bedroom on level 1 with ensuite bath (approx. 14 x 14)
- Bathrooms: 2 full bathrooms
- Heating & cooling: Central heating
- Interior features: Cable TV available; High-speed internet available; Attic fan; Ceiling fans
Neighborhood map
What this means for you Summary
Snapshot
- This is a 4-bed/2.0-bath single-family listed at $220k.
Deal economics
- At list price, monthly cash flow is $92 ($1k/yr) — positive.
- The deal already cash-flows at list — no discount required.
- Meets the 1% rule at list price ($2k rent vs $220k).
- Recommended offer: $217k (1.5% below list) — sets the bar for market timing.
- Cap rate 6.8% vs local median 4.8% in Lancaster — top-decile yield for the area; either an underpriced asset or a hidden risk that comps aren't pricing in. Stress-test before assuming the spread holds.
Location & tenants
- Location reads 62/100 on livability (#926 in TX) — a middle-class / working-renter tenant base. Strengths: cost of living A+, housing A+; Watch: employment C-, crime F, amenities F.
- Lancaster ISD (suburban): math 19% / reading 29% proficiency, ranked #714 of 826 in TX (top 86%) — low school quality limits family demand, transient renter base, plan for 1-2y turnover; 78% free/reduced lunch — lower-income household profile, screen leases tightly.
- Zoned schools: Pleasant Run El (math 22% / reading 22%, grade F, #3,333 of 4,322 statewide, top 80%, 622 students, 99% FRL) — zoned schools average 99% FRL vs 78% district-wide (21 pts higher); higher-poverty schools than district average — tighter screening recommended.
- Market conditions: Rents flat; 102 active listings in the ZIP; 40 comparable units currently listed for rent nearby; rentals at typical pace (median 24d on market — plan ~3-4 weeks tenant-placement turnaround); 42% of comp listings sitting > 30 days — soft ceiling on asking rent; 12,577 units permitted in Dallas County in 2024 (6,829 in 5+ unit buildings).
- This rent runs 39% of the median local income ($70k/yr) — at the standard rent-burdened threshold; future hikes will face affordability resistance.
Forward outlook
- Local home prices are declining (-3.0%/yr); year-one equity from $2k of loan paydown is wiped out by about $7k of value loss. Plan a longer hold.
- Dallas County population projected at +35% by 2050 — long-run rental-demand tailwind backs the buy-and-hold thesis.
Negotiation context
- It's been on market 17 days — a 2% lower offer ($217k) is reasonable based on typical stale-listing flexibility.
- Current owner paid $56k; list at $220k implies a 293% gain — meaningful room to come down on a strong offer.
Risks & watch-outs
- Watch-outs: property tax is 2.6% of price.
- Climate carrying-cost: major wind risk, 27% chance of damaging wind over 30y; extreme-heat days projected 7→25/yr by 2055 (HVAC capex compounding) — expect insurance premiums to compound above CPI over the hold.
Questions for the listing agent
- Built in 1974 — when were the roof, HVAC, electrical panel, plumbing, and water heater last replaced?
- Property tax is high relative to price — has the assessment been appealed recently, and will the sale trigger a re-assessment?
- Is there a deadline driving the sale (1031 exchange, divorce, estate, relocation)? That informs how much negotiation room exists.
- Schools are D-rated, which usually means shorter tenancies and higher turnover. Who's the typical renter profile here, and what's been the actual vacancy rate?
- Crime grade is F in this area — have there been break-ins, vandalism, or insurance claims at this property in the last 3 years? What carrier currently insures it and at what premium?
- What's the average days-on-market for RENTAL listings here right now (not sales)? A rising rental-DOM trend means longer vacancies and softer asking-rent achievability than the comps imply.
- What's the recent tenant-quality profile in this submarket — average credit score on applications, eviction rate, late-payment / NSF rate, and stable-employment percentage? A property-management company in the area should have these aggregated.
- How much new for-sale + rental construction is in the pipeline within 1–3 miles? Heavy new supply typically softens prices + rents 12–24 months out; constrained supply supports both.
Investment metrics
- 1% rule
- 1.04% ✓
- Cap rate
- 6.79%
- Cash-on-cash
- 1.78%
- DSCR
- 1.08
- GRM
- 8.0
CMA / ARV
- ARV (on-the-fly)
- $282,720
- Comps found
- 12
Show comp detail 12 sales within ~0.75 mi
| Address | Dist | Beds/Ba | Sqft | Sold | Price | $/sf | Match |
|---|---|---|---|---|---|---|---|
| 813 Cherry Hills Dr | 0.02mi | 4/2.0 | 1,946 (+7%) | 3mo | $284,999 | $146 | 85 |
| 2315 Rogers Ave | 0.47mi | 4/2.0 | 1,823 (-0%) | 1mo | $305,000 | $167 | 77 |
| 2923 E Pepperidge Dr | 0.27mi | 3/2.0 (-1) | 1,770 (-3%) | 2mo | $269,999 | $153 | 75 |
| 908 W Wintergreen Rd | 0.53mi | 3/2.0 (-1) | 1,761 (-4%) | 4mo | $275,750 | $157 | 61 |
| 2503 Gerry Way St | 0.67mi | 4/2.0 | 1,747 (-4%) | 2mo | $260,000 | $149 | 60 |
| 919 Cresthaven Dr | 0.39mi | 4/2.0 | 1,607 (-12%) | 11mo | $265,000 | $165 | 53 |
| 2321 Arcady Ln | 0.44mi | 4/2.0 | 1,612 (-12%) | 12mo | $249,900 | $155 | 51 |
| 748 Balkan Dr | 0.48mi | 3/2.5 (-1) | 1,959 (+7%) | 12mo | $415,000 | $212 | 48 |
| 2541 Everton Dr | 0.74mi | 4/2.5 | 1,966 (+8%) | 2mo | $399,000 | $203 | 48 |
| 2803 Amber Waves Ln | 0.71mi | 3/2.0 (-1) | 1,974 (+8%) | 10mo | $290,000 | $147 | 40 |
| 705 Yale Dr | 0.55mi | 3/2.0 (-1) | 1,592 (-13%) | 12mo | $209,920 | $132 | 38 |
| 533 Donlee Rd | 0.73mi | 3/2.0 (-1) | 1,610 (-12%) | 12mo | $235,000 | $146 | 31 |
Match score weights: distance 35% · size 25% · config 20% · recency 20%. Top-matched comps best support the ARV.
Projected returns pro-forma
-3.0% appreciation · 0.33% rent growth · sell at horizon
- IRR
- -16.8%
- Equity multiple
- 0.42×
- Total profit
- $-35,640
- Equity at exit
- $32,803
- IRR
- -15.3%
- Equity multiple
- 0.25×
- Total profit
- $-46,156
- Equity at exit
- $19,022
Cash invested: $61,600 (down + closing). Projections, not guarantees.
Landlord ↔ Tenant lean methodology
- Overall (STATE)
- 87 Strongly Landlord-Friendly
- State Texas
- 87 Strongly Landlord-Friendly · R+5
- County
- — inherits STATE
- City
- — inherits STATE
ZIP-level market 75134
- Home prices YoY
- -17.1%
- Rents YoY
- 0.3%
- Active inventory
- 102
- Price-to-rent
- 8.0×
Monthly cashflow live
- Estimated rent
- $2,285 high interval (Pro) →
- Mortgage (P&I)
- −$1,154
- Tax from tax record
- −$468 /mo · $5,615/yr
- Insurance
- −$92
- HOA
- −$0
- Vacancy / Maint / Mgmt
- −$480
- Net cashflow
- $92
Break-even live
UW: 25.0% down · 7.5% · 30yr · 1.5% tax · 5.0% vac · 8.0% maint · 8.0% mgmt
Financing live
Cash to close
- Down payment
- $55,000
- Closing costs
- $6,600
- Reserves months
- —
- Total cash needed
- —
Loan-product check · same deal, 3 products live
Conventional
25% down · 7.5% · 30yr
- Down + closing
- —
- Monthly P&I
- —
- Monthly cashflow
- —
- DSCR
- —
- Eligible?
- —
Personal DTI + credit; lowest rate.
DSCR
20% down · 8.5% · 30yr
- Down + closing
- —
- Monthly P&I
- —
- Monthly cashflow
- —
- DSCR
- —
- Eligible?
- —
No personal income docs; deal must DSCR.
Hard money
10% down · 12.0% · 12mo
- Down + closing
- —
- Monthly P&I
- —
- Monthly cashflow
- —
- DSCR
- —
- Eligible?
- —
Short-term bridge; refi at stabilization.
Rent comps 40 comps
| Address | Beds | Baths | Sqft | Rent | $/sqft | DOM | Units | Dist |
|---|---|---|---|---|---|---|---|---|
| 834 Apple Valley Dr Lancaster, TX | 3.0 | 2.0 | 1425 | $2,275 | $1.60 | 43d | 1 | 0.03mi |
| 2654 Hartford Ln Lancaster, TX | 4.0 | 2.0 | 1657 | $2,015 | $1.22 | 43d | 1 | 0.15mi |
| 2746 Town North Dr Lancaster, TX | 4.0 | 2.0 | 1377 | $2,000 | $1.45 | 7d | 1 | 0.22mi |
| 719 Westover Dr Lancaster, TX | 3.0 | 2.0 | 1248 | $1,900 | $1.52 | 24d | 1 | 0.22mi |
| 2617 Arcady Cir Lancaster, TX | 3.0 | 2.0 | 1361 | $1,950 | $1.43 | 20d | 1 | 0.24mi |
| 2617 Arcady Cir Lancaster, TX | 3.0 | 2.0 | 1361 | $1,950 | $1.43 | 43d | 1 | 0.24mi |
| 2922 E Pepperidge Dr Lancaster, TX | 4.0 | 2.0 | 1444 | $2,000 | $1.39 | 43d | 1 | 0.25mi |
| 907 Cresthaven Dr Lancaster, TX | 3.0 | 2.0 | 1366 | $1,850 | $1.35 | 24d | 1 | 0.38mi |
| 1252 Payne Dr Lancaster, TX | 4.0 | 2.0 | 1577 | $2,239 | $1.42 | 2d | 1 | 0.48mi |
| 633 Rutgers Dr Lancaster, TX | 4.0 | 2.0 | 2065 | $1,995 | $0.97 | 10d | 1 | 0.52mi |
| 633 Rutgers Dr Lancaster, TX | 4.0 | 2.0 | 2065 | $1,995 | $0.97 | 4d | 1 | 0.52mi |
| 1314 Roan Dr Lancaster, TX | 4.0 | 2.5 | 1913 | $2,375 | $1.24 | 43d | 1 | 0.56mi |
| 721 Lindenwood Dr Lancaster, TX | 3.0 | 2.0 | 1606 | $1,895 | $1.18 | 15d | 1 | 0.72mi |
| 721 Lindenwood Dr Lancaster, TX | 3.0 | 2.0 | 1606 | $1,895 | $1.18 | 7d | 1 | 0.72mi |
| 1533 Prescott Dr Lancaster, TX | 3.0 | 2.0 | 1500 | $1,975 | $1.32 | 4d | 1 | 0.79mi |
| 1021 Badger Run Lancaster, TX | 3.0 | 2.0 | 1811 | $2,235 | $1.23 | 43d | 1 | 0.83mi |
| 1532 Linda Ln Lancaster, TX | 3.0 | 2.0 | 1380 | $2,000 | $1.45 | 24d | 1 | 0.85mi |
| 1326 Johns Ave Lancaster, TX | 4.0 | 2.0 | 1236 | $2,100 | $1.70 | 43d | 1 | 0.92mi |
| 2904 Crimson Clover Dr Lancaster, TX | 4.0 | 2.5 | 2512 | $2,359 | $0.94 | 16d | 1 | 0.94mi |
| 2912 Crimson Clover Dr Lancaster, TX | 3.0 | 2.0 | 1735 | $2,075 | $1.20 | 7d | 1 | 0.95mi |
| 509 Arbor Ln Lancaster, TX | 3.0 | 2.0 | 1494 | $1,875 | $1.26 | 43d | 1 | 0.97mi |
| 1244 Flower Ridge Dr Lancaster, TX | 3.0 | 2.0 | 1818 | $2,099 | $1.15 | 43d | 1 | 0.99mi |
| 1811 Kings Cross Dr Lancaster, TX | 4.0 | 2.0 | 1812 | $2,200 | $1.21 | 24d | 1 | 1.06mi |
| 1209 Candler Dr Lancaster, TX | 4.0 | 2.0 | 2049 | $2,310 | $1.13 | 43d | 1 | 1.06mi |
| 3124 Crimson Clover Dr Lancaster, TX | 3.0 | 2.0 | 1783 | $2,100 | $1.18 | 43d | 1 | 1.13mi |
| 1563 Nottingham Dr Lancaster, TX | 4.0 | 2.0 | 1894 | $2,299 | $1.21 | 24d | 1 | 1.20mi |
| 1447 Gentle Rain Dr Lancaster, TX | 3.0 | 2.0 | 1735 | $2,200 | $1.27 | 7d | 1 | 1.22mi |
| 3400 New York Ave Lancaster, TX | 4.0 | 2.0 | 2008 | $2,162 | $1.08 | 24d | 1 | 1.27mi |
| 3421 New York Ave Lancaster, TX | 4.0 | 2.0 | 2008 | $2,162 | $1.08 | 43d | 1 | 1.34mi |
| 3416 Tennessee Ave Lancaster, TX | 4.0 | 2.0 | 2008 | $2,162 | $1.08 | 43d | 1 | 1.34mi |
| 120 E Park Place Dr Lancaster, TX | 4.0 | 1.0 | 1536 | $1,900 | $1.24 | 24d | 1 | 1.35mi |
| 3425 New York Ave Lancaster, TX | 4.0 | 2.0 | 2036 | $2,162 | $1.06 | 43d | 1 | 1.35mi |
| 1555 Willowbrook St Lancaster, TX | 3.0 | 2.0 | 1544 | $1,759 | $1.14 | 22d | 1 | 1.35mi |
| 1109 Harvest Hill Ln Lancaster, TX | 3.0 | 2.5 | 2006 | $2,350 | $1.17 | 7d | 1 | 1.35mi |
| 1439 Marvin Gdns Lancaster, TX | 4.0 | 2.0 | 2008 | $2,395 | $1.19 | 43d | 1 | 1.36mi |
| 1748 Cansler Ln Lancaster, TX | 4.0 | 2.0 | 1806 | $2,195 | $1.22 | 43d | 1 | 1.39mi |
| 1217 Meadow Creek Dr Lancaster, TX | 3.0 | 2.0 | 2088 | $1,971 | $0.94 | 12d | 1 | 1.41mi |
| 1217 Meadow Creek Dr Lancaster, TX | 3.0 | 2.0 | 2088 | $1,905 | $0.91 | 7d | 1 | 1.41mi |
| 1750 Oneal St Lancaster, TX | 3.0 | 2.0 | 1460 | $2,100 | $1.44 | 43d | 1 | 1.41mi |
| 2206 Midbury Dr Lancaster, TX | 3.0 | 2.5 | 2140 | $2,240 | $1.05 | 19d | 1 | 1.45mi |
Listing history 12 events
-
2026-06-18days on market $220,000 Active 17 DOM
-
2026-06-17days on market $220,000 Active 16 DOM
-
2026-06-16days on market $220,000 Active 15 DOM
-
2026-06-15days on market $220,000 Active 14 DOM
-
2026-06-13days on market $220,000 Active 12 DOM
-
2026-06-09days on market $220,000 Active 8 DOM
-
2026-06-08days on market $220,000 Active 7 DOM
-
2026-06-07days on market $220,000 Active 6 DOM
-
2026-06-04days on market $220,000 Active 3 DOM
-
2026-06-03days on market $220,000 Active 2 DOM
-
2026-06-02remarks 699-char remark
-
2026-06-02$220,000 Active 1 DOM
ⓘ Source: listings_history table (triggers on properties + properties_extension) + one-shot
backfill from property_details.listing_events for pre-trigger history.
Tax reassessment forecast TX · Resets to sale price
- Current annual tax
- $5,615 · $468/mo
- Projected year-2 tax
- $5,615 · $468/mo
- Expected delta
- $0/yr ($0/mo · 0.0%)
ⓘ Screening estimate from a state-policy table — verify with the county assessor before closing.
Climate risk First Street
- Flood 1/10 Low FEMA zone X (unshaded) · 0% chance over 30 yrs
- Wildfire 3/10 Moderate
- Heat 7/10 Severe 7 d/yr ≥110°F today · 25 d/yr by 30 yrs out
- Wind 6/10 Major 27% chance of damaging wind over 30 yrs
- Air quality 2/10 Low 2 unhealthy d/yr today · 2 by 30 yrs out
Nearby sold comps map
Loading sold comps map…
Walkable amenities ~0.75 mi
Loading nearby amenities…
Taxation est. · year 1
- Rental income
- $27,416
- − Mortgage interest
- −$12,323
- − Property taxes
- −$5,615
- − Insurance
- −$1,100
- − Repairs & maintenance
- −$2,193
- − Management
- −$2,193
- − Depreciation
- −$6,400
- Taxable loss
- −$2,409
- Est. tax savings @ 24.0%
- +$578
- After-tax cash flow
- $1,677/yr
For passive investors: Depreciation is non-cash, so a rental often shows a tax loss while cash-flowing — sheltering income. Rental losses are passive: they offset passive income freely, and up to $25,000/yr can offset ordinary (W-2) income if you actively participate and your MAGI is under $100k (phasing out to $0 by $150k); unused losses carry forward. On sale, claimed depreciation is recaptured at up to 25%, and gains may owe capital-gains tax (a 1031 exchange can defer both). Figures are a year-1 estimate at your 24.0% rate — not tax advice; consult a CPA.
Schools (NCES district)
- District
- Lancaster ISD
- NCES district ID
- 4826670
- Math proficiency
- 19% ▼ -29.00%
- Reading proficiency
- 29% ▼ -11.00%
- Median HH income
- $52,275
- Composite
- 21.41/100
- National rank
- #8349
- State rank
- #714 of 826 in TX
Livability — Lancaster
- Score
- 62/100
- State rank
- #926
- US rank
- #16461
Category grades
Schools grade is shown separately in the Schools card above.
Census & demographics
- Census place
- Lancaster, TX
- County
- Dallas County · 2,612,404 people
- City population
- 44,142
- Metro
- Dallas-Fort Worth-Arlington, TX
- Population (ZIP)
- 19,045
- Household income
- $69,778
- Rent vs Own
- Severe rent burden
- 399.0
Population outlook (Dallas County) Hauer SSP2
- Today (2025)
- 2,979,839 people
- By 2030
- 3,191,823 · +7.1%
- By 2040
- 3,619,611 · +21.5%
- By 2050
- 4,026,915 · +35.1%
- By 2075
- 4,957,073 · +66.4%
- By 2100
- 5,508,725 · +84.9%
Race, ethnicity, and origin ACS 2023
- Neighborhood character
- Predominantly Black (68%)
- Race & ethnicity
- Black 68% Hispanic / Latino 22% Two or more races 9% White 8%
- Hispanic origin (detail)
- Mexican 20%
- Common ancestry
- Slovak 1%
- Foreign-born
- 9% · Canada
- Languages at home
- 79% English-only · Spanish 20%
Political lean MEDSL · Dallas
- 2024 margin
- Strong D (+22.2) · D 60.2% · R 38.0% · Other 1.8%
- 2008→2024 swing
- +6.9pp toward D · 2008: 15.3pp · 2024: 22.2pp
- All cycles
- 2024: D+22.2 2020: D+31.6 2016: D+26.2 2012: D+15.4 2008: D+15.3
Not yet ingested
- Civics
- —
Market trends
- HPI YoY
- ▼ -66.51%
- Current HPI
- 323.4396
- Rent YoY
- ▲ 0.33%
- Metro
- Dallas-Fort Worth-Arlington, TX
- State GDP YoY
- ▲ 3.95%
- F500 in state
- 110
Industry mix (Fortune 500 HQ in TX)
| Industry | F500 HQs | Revenue |
|---|---|---|
| Energy | 16 | $1,198B |
|
||
| Technology | 5 | $198B |
|
||
| Engineering / Construction | 4 | $72B |
|
||
| Energy Services | 3 | $60B |
|
||
| Utilities | 3 | $41B |
|
||
| Healthcare | 2 | $330B |
|
||
Price history
+293.3% since first listed2 events — show timeline
- 2026-05-28 Listed $220,000 NTREIS
- 1993-02-04 Sold (Public Records) $55,940 Public Records
Property tax history
+7.5%/yrLatest (2025): $5,615 · -9.5% YoY. Source: county tax records.
Cash-flow waterfall
monthlySold comps — $/sqft
last 12 mo · ≤1 miLoading sold comps…