 🏷️ Likely Rental
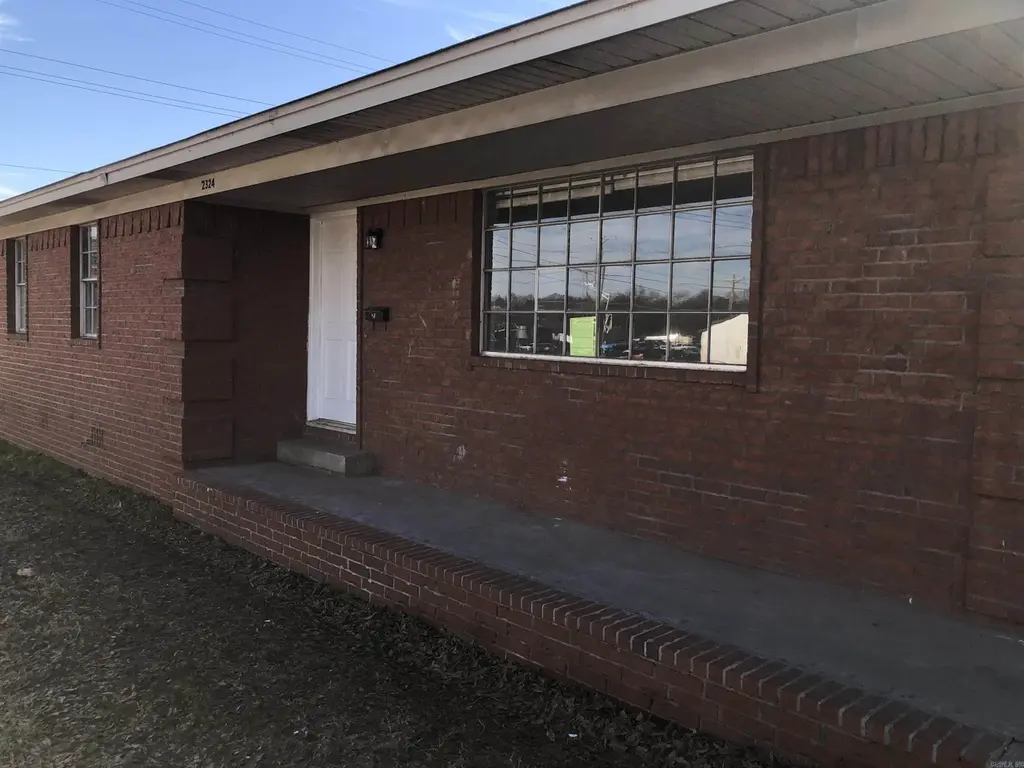
2324 Moss St · North Little Rock, AR
Flood risk 1/10 · Minimal
- FEMA flood zone
- X (unshaded)
- Chance of flooding over 30 yrs
- 0.0%
- Est. flood insurance / yr
- $507 – $1,088
Fire risk 3/10 · Minor
- Est. fire insurance / yr
- $1,499 – $2,785
Heat risk 7/10 · Major
- Hot days now (above 110°F)
- 7 days/yr
- Hot days in 30 yrs
- 18 days/yr
Wind risk 4/10 · Minor
- Chance of severe wind over 30 yrs
- 9.0%
Air-quality risk 2/10 · Minimal
- Unhealthy air days now
- 1 days/yr
- Unhealthy air days in 30 yrs
- 1 days/yr
Risk factors via First Street. Map © Google.
Why this score? — see what drove the B- grade
The composite is a weighted blend of 9 inputs, each scored 0–100. Each bar is that input's sub-score; the figure is the points it added to the 100-point composite (weight × sub-score).
- Cash flow +23.8/30.0
- ARV discount +15.0/15.0
- DSCR +7.7/10.0
- 1% rule +5.3/10.0
- Livability +3.7/5.0
- Appreciation +3.6/10.0
- Rent growth +3.3/5.0
- Condition / age +2.5/5.0
- Schools +2.0/10.0
$116,900
🖨 Deal sheet (PDF) 📄 Offer letter ✓ Due diligence
Listing remarks MLS
* No showings will be permitted without an agreed-upon price and an executed sales contract. * Please do not disturb tenants. Renovated 3-bedroom, 1.5-bath home in North Little Rock featuring stylish updates and durable vinyl plank flooring. A covered carport offers convenient parking, and the clean, modern interior makes this property a great option for investors or future homeowners. Currently leased for $1,095/month with a lease in place through 2/25/2026, offering reliable rental income.
Key facts
- Covered carport
- Detached
- 5,662 sq ft lot
Tags
Neighborhood map
What this means for you Summary
Snapshot
- This is a 3-bed/1.5-bath single-family listed at $117k.
Deal economics
- At list price, monthly cash flow is $224 ($3k/yr) — positive.
- The deal already cash-flows at list — no discount required.
- Meets the 1% rule at list price ($1k rent vs $117k).
- Recommended offer: $103k (12.0% below list) — sets the bar for market timing.
- Cap rate 8.6% vs local median 5.0% in North Little Rock — top-decile yield for the area; either an underpriced asset or a hidden risk that comps aren't pricing in. Stress-test before assuming the spread holds.
Location & tenants
- Location reads 73/100 on livability (#24 in AR) — a middle-class / working-renter tenant base. Strengths: commute A+, cost of living A+, housing A+; Watch: crime F, amenities F, employment D-.
- N. Little Rock School District (urban): math 21% / reading 26% proficiency, ranked #191 of 238 in AR (top 80%) — low school quality limits family demand, transient renter base, plan for 1-2y turnover; 66% free/reduced lunch — lower-income household profile, screen leases tightly.
- Zoned schools: Boone Park Elementary School (math 12% / reading 12%, grade F, #419 of 454 statewide, top 93%, 414 students, 100% FRL); Lakewood Middle School (math 23% / reading 32%, grade F, #155 of 201 statewide, top 77%, 1,115 students, 100% FRL); North Little Rock High School (math 12% / reading 26%, grade F, #248 of 292 statewide, top 86%, 1,949 students, 100% FRL) — zoned schools average 100% FRL vs 66% district-wide (33 pts higher); higher-poverty schools than district average — tighter screening recommended.
- Market conditions: Rents rising (+3.1%/yr); 69 active listings in the ZIP; 40 comparable units currently listed for rent nearby; rentals lingering (median 47d on market — plan ~5-8 weeks vacancy on turnover, expect pricing pressure); 50% of comp listings sitting > 30 days — soft ceiling on asking rent; lower-income renter base — watch delinquency; 1,006 units permitted in Pulaski County in 2024 (0 in 5+ unit buildings).
- At $1,203/mo this rent would consume 48% of the median local household income ($30k/yr) (locally 995% of renters already pay >50% of income on rent) — very limited rent-growth headroom before tenants either downsize or default.
Forward outlook
- Local home prices are declining (-2.7%/yr); year-one equity from $808 of loan paydown is wiped out by about $3k of value loss. Plan a longer hold.
- Pulaski County population projected at +6% by 2050 — modest demand growth; plan on rents tracking national, not racing it.
Negotiation context
- It's been on market 153 days — a 12% lower offer ($103k) is reasonable based on typical stale-listing flexibility.
- 5 sale attempts since 2y ago with the ask held roughly flat each time — persistent listings suggest the price (not the market) is what's stuck; bring a comps-based counter.
- Current owner paid $48k; list at $117k implies a 146% gain — meaningful room to come down on a strong offer.
Risks & watch-outs
- Climate carrying-cost: extreme-heat days projected 7→18/yr by 2055 (HVAC capex compounding) — expect insurance premiums to compound above CPI over the hold.
Questions for the listing agent
- It's been on market 153 days. Have you received any prior offers? Is the seller open to a 12% concession, seller financing, or rate buy-down credit?
- Built in 1972 — when were the roof, HVAC, electrical panel, plumbing, and water heater last replaced?
- Why hasn't it sold? Are there any deal-killer items the seller is aware of (foundation, flood, title, zoning, code violations)?
- Is there a deadline driving the sale (1031 exchange, divorce, estate, relocation)? That informs how much negotiation room exists.
- Schools are D-rated, which usually means shorter tenancies and higher turnover. Who's the typical renter profile here, and what's been the actual vacancy rate?
- Crime grade is F in this area — have there been break-ins, vandalism, or insurance claims at this property in the last 3 years? What carrier currently insures it and at what premium?
- What's the average days-on-market for RENTAL listings here right now (not sales)? A rising rental-DOM trend means longer vacancies and softer asking-rent achievability than the comps imply.
- What's the recent tenant-quality profile in this submarket — average credit score on applications, eviction rate, late-payment / NSF rate, and stable-employment percentage? A property-management company in the area should have these aggregated.
- How much new for-sale + rental construction is in the pipeline within 1–3 miles? Heavy new supply typically softens prices + rents 12–24 months out; constrained supply supports both.
Investment metrics
- 1% rule
- 1.03% ✓
- Cap rate
- 8.59%
- Cash-on-cash
- 8.21%
- DSCR
- 1.37
- GRM
- 8.1
CMA / ARV
- ARV (median comp)
- $185,820
- List price
- $116,900
- Delta
- -37.09%
- Verdict
- UNDERPRICED
- Comps
- 20 within 1.0 mi
Show comp detail 12 sales within ~0.75 mi
| Address | Dist | Beds/Ba | Sqft | Sold | Price | $/sf | Match |
|---|---|---|---|---|---|---|---|
| 421 W 24th St | 0.38mi | 3/2.0 | 1,518 (+5%) | 4mo | $219,900 | $145 | 68 |
| 1516 Sycamore St | 0.73mi | 3/1.0 | 1,418 (-2%) | 2mo | $72,000 | $51 | 59 |
| 1711 W Long 17th St | 0.60mi | 3/2.0 | 1,368 (-5%) | 4mo | $219,900 | $161 | 58 |
| 1623 Marion St | 0.48mi | 3/2.0 | 1,339 (-7%) | 6mo | $153,000 | $114 | 58 |
| 100 E Scenic Dr | 0.42mi | 3/2.0 | 1,328 (-8%) | 10mo | $161,000 | $121 | 57 |
| 2019 W Short 17th St | 0.69mi | 3/2.0 | 1,470 (+2%) | 6mo | $135,000 | $92 | 57 |
| 1519 Schaer St | 0.56mi | 3/1.0 | 1,535 (+6%) | 5mo | $20,000 | $13 | 57 |
| 1620 Chandler St | 0.53mi | 3/2.0 | 1,516 (+5%) | 10mo | $65,000 | $43 | 56 |
| 409 W 21st St | 0.45mi | 3/2.0 | 1,556 (+8%) | 10mo | $56,500 | $36 | 55 |
| 6 Farvu Ct | 0.53mi | 3/2.5 | 1,348 (-6%) | 7mo | $222,000 | $165 | 55 |
| 500 W 17th St | 0.60mi | 4/1.5 (+1) | 1,328 (-8%) | 5mo | $109,000 | $82 | 50 |
| 1812 W Long 17th St | 0.66mi | 3/1.0 | 1,284 (-11%) | 6mo | $34,000 | $26 | 44 |
Match score weights: distance 35% · size 25% · config 20% · recency 20%. Top-matched comps best support the ARV.
Projected returns pro-forma
-2.7% appreciation · 3.14% rent growth · sell at horizon
- IRR
- -2.4%
- Equity multiple
- 0.91×
- Total profit
- $-3,093
- Equity at exit
- $18,969
- IRR
- 6.8%
- Equity multiple
- 1.53×
- Total profit
- $17,489
- Equity at exit
- $12,771
Cash invested: $32,732 (down + closing). Projections, not guarantees.
Landlord ↔ Tenant lean methodology
- Overall (STATE)
- 92 Strongly Landlord-Friendly
- State Arkansas
- 92 Strongly Landlord-Friendly · R+14
- County
- — inherits STATE
- City
- — inherits STATE
ZIP-level market 72114
- Home prices YoY
- -2.2%
- Rents YoY
- 3.1%
- Active inventory
- 69
- Price-to-rent
- 8.1×
Monthly cashflow live
- Estimated rent
- $1,203 high interval (Pro) →
- Mortgage (P&I)
- −$613
- Tax from tax record
- −$64 /mo · $774/yr
- Insurance
- −$49
- HOA
- −$0
- Lot rent
- −$0
- Vacancy / Maint / Mgmt
- −$253
- Net cashflow
- $224
Break-even live
Sensitivity live
| Price | -10% $290 | -5% $257 | +0% $224 | +5% $191 | +10% $158 |
|---|---|---|---|---|---|
| Rent | -10% $129 | -5% $176 | +0% $224 | +5% $271 | +10% $319 |
| Rate | -1.0pp $283 | -0.5pp $254 | base $224 | +0.5pp $194 | +1.0pp $163 |
UW: 25.0% down · 7.5% · 30yr · 1.5% tax · 5.0% vac · 8.0% maint · 8.0% mgmt
Financing live
Cash to close
- Down payment
- $29,225
- Closing costs
- $3,507
- Reserves months
- —
- Total cash needed
- —
Loan-product check · same deal, 3 products live
Conventional
25% down · 7.5% · 30yr
- Down + closing
- —
- Monthly P&I
- —
- Monthly cashflow
- —
- DSCR
- —
- Eligible?
- —
Personal DTI + credit; lowest rate.
DSCR
20% down · 8.5% · 30yr
- Down + closing
- —
- Monthly P&I
- —
- Monthly cashflow
- —
- DSCR
- —
- Eligible?
- —
No personal income docs; deal must DSCR.
Hard money
10% down · 12.0% · 12mo
- Down + closing
- —
- Monthly P&I
- —
- Monthly cashflow
- —
- DSCR
- —
- Eligible?
- —
Short-term bridge; refi at stabilization.
Rent comps 40 comps
| Address | Beds | Baths | Sqft | Rent | $/sqft | DOM | Units | Dist |
|---|---|---|---|---|---|---|---|---|
| 1100 W 24th St North Little Rock, AR | 3.0 | 1.0 | 1036 | $1,295 | $1.25 | 21d | 1 | 0.05mi |
| 2316 Parker St North Little Rock, AR | 4.0 | 1.0 | 1146 | $1,195 | $1.04 | 26d | 1 | 0.09mi |
| 2320 Franklin St North Little Rock, AR | 2.0 | 2.0 | 932 | $750 | $0.80 | 26d | 1 | 0.15mi |
| 823 W 20th St North Little Rock, AR | 3.0 | 2.0 | 1250 | $1,470 | $1.18 | 26d | 1 | 0.27mi |
| 1308 W 21st St North Little Rock, AR | 2.0 | 1.0 | 944 | $945 | $1.00 | 46d | 1 | 0.29mi |
| 5 Cliffwood Cir North Little Rock, AR | 3.0 | 2.0 | 1662 | $1,195 | $0.72 | 26d | 1 | 0.36mi |
| 128 College Park Cir Unit 1 North Little Rock, AR | 2.0 | 1.0 | 975 | $550 | $0.56 | 46d | 1 | 0.46mi |
| 600 W 18th St North Little Rock, AR | 3.0 | 1.0 | 1157 | $895 | $0.77 | 17d | 1 | 0.53mi |
| 1603 W Long 17th St Unit B North Little Rock, AR | 3.0 | 1.0 | 1036 | $650 | $0.63 | 46d | 1 | 0.58mi |
| 1603 Chandler St North Little Rock, AR | 2.0 | 1.0 | 1080 | $895 | $0.83 | 46d | 1 | 0.58mi |
| 1519 W 15th St North Little Rock, AR | 3.0 | 2.0 | 1250 | $1,470 | $1.18 | 46d | 1 | 0.68mi |
| 3423 Chandler St Unit B North Little Rock, AR | 2.0 | 1.0 | 928 | $725 | $0.78 | 46d | 1 | 0.70mi |
| 407 W 33rd St North Little Rock, AR | 3.0 | 2.0 | 1472 | $1,025 | $0.70 | 46d | 1 | 0.71mi |
| 1508 Sycamore St North Little Rock, AR | 2.0 | 1.0 | 1320 | $1,175 | $0.89 | 46d | 1 | 0.75mi |
| 2021 W Long 17th St North Little Rock, AR | 3.0 | 1.0 | 1268 | $895 | $0.71 | 46d | 1 | 0.76mi |
| 508 W 35th St North Little Rock, AR | 2.0 | 1.0 | 876 | $850 | $0.97 | 26d | 1 | 0.77mi |
| 1524 Orange St North Little Rock, AR | 3.0 | 2.0 | 1350 | $1,000 | $0.74 | 26d | 1 | 0.82mi |
| 1416 Willow St North Little Rock, AR | 2.0 | 1.0 | 995 | $1,999 | $2.01 | 46d | 1 | 0.82mi |
| 1920 N Poplar St North Little Rock, AR | 4.0 | 2.0 | 1422 | $1,595 | $1.12 | 17d | 1 | 0.84mi |
| 3619 Sycamore St Unit B North Little Rock, AR | 3.0 | 2.0 | 1220 | $975 | $0.80 | 17d | 1 | 0.87mi |
| 605 W Scenic Dr North Little Rock, AR | 3.0 | 2.0 | 1040 | $1,050 | $1.01 | 46d | 1 | 0.89mi |
| 5 North Little Rock, AR | 1.0–2.0 | 1.0–2.0 | 1145 | $2,394 | $2.09 | 17d | 7 | 0.90mi |
| 1111 Parker St North Little Rock, AR | 3.0 | 2.5 | 1719 | $1,800 | $1.05 | 24d | 1 | 0.90mi |
| 801 W Scenic Dr North Little Rock, AR | 2.0 | 2.5 | 1000 | $995 | $0.99 | 17d | 1 | 0.95mi |
| 127 Crestview Dr Unit 3 North Little Rock, AR | 2.0 | 1.0 | 880 | $825 | $0.94 | 46d | 1 | 0.96mi |
| 300 Cherry Hill Dr Unit 5 North Little Rock, AR | 2.0 | 1.0 | 880 | $825 | $0.94 | 46d | 1 | 0.97mi |
| 1236 W 10th St North Little Rock, AR | 3.0 | 1.0 | 1185 | $795 | $0.67 | 46d | 1 | 1.02mi |
| 1009 W Scenic Dr North Little Rock, AR | 2.0 | 1.5 | 1050 | $1,100 | $1.05 | 46d | 1 | 1.06mi |
| 4116 Moss St North Little Rock, AR | 2.0 | 1.0 | 1139 | $850 | $0.75 | 26d | 1 | 1.07mi |
| 1600 N Olive St North Little Rock, AR | 3.0 | 1.0 | 1100 | $900 | $0.82 | 46d | 1 | 1.07mi |
| 4000 Emerson Dr North Little Rock, AR | 3.0 | 2.0 | 1046 | $1,195 | $1.14 | 21d | 1 | 1.10mi |
| 5 Sweet Rose Ln North Little Rock, AR | 3.0 | 1.5 | 960 | $1,150 | $1.20 | 26d | 1 | 1.12mi |
| 11 Sweet Rose Ln North Little Rock, AR | 3.0 | 1.0 | 950 | $1,150 | $1.21 | 46d | 1 | 1.14mi |
| 4017 Mellene Dr North Little Rock, AR | 3.0 | 1.0 | 1094 | $1,150 | $1.05 | 46d | 1 | 1.14mi |
| 134 Melrose Cir North Little Rock, AR | 3.0 | 2.0 | 1322 | $1,750 | $1.32 | 24d | 1 | 1.15mi |
| 117 Link Rd North Little Rock, AR | 3.0 | 2.0 | 1407 | $1,600 | $1.14 | 46d | 1 | 1.17mi |
| 124 Melrose Cir North Little Rock, AR | 2.0 | 2.0 | 1200 | $1,950 | $1.62 | 17d | 1 | 1.18mi |
| 1220 W 4th St North Little Rock, AR | 2.0 | 1.0 | 1315 | $2,150 | $1.63 | 26d | 1 | 1.31mi |
| 325 W I Ave North Little Rock, AR | 2.0 | 1.0 | 1100 | $1,300 | $1.18 | 17d | 1 | 1.34mi |
| 1120 Rockwater Blvd North Little Rock, AR | 2.0 | 1.0–2.0 | 955 | $2,175 | $2.28 | 46d | 1 | 1.37mi |
Listing history 30 events
-
2026-06-23days on market $116,900 Active 153 DOM
-
2026-06-21days on market $116,900 Active 152 DOM
-
2026-06-18days on market $116,900 Active 149 DOM
-
2026-06-17days on market $116,900 Active 148 DOM
-
2026-06-16days on market $116,900 Active 147 DOM
-
2026-06-15days on market $116,900 Active 146 DOM
-
2026-06-14days on market $116,900 Active 144 DOM
-
2026-06-13days on market $116,900 Active 143 DOM
-
2026-06-10days on market $116,900 Active 141 DOM
-
2026-06-09days on market $116,900 Active 140 DOM
-
2026-06-08days on market $116,900 Active 139 DOM
-
2026-06-07days on market $116,900 Active 138 DOM
-
2026-06-05days on market $116,900 Active 135 DOM
-
2026-06-03days on market $116,900 Active 134 DOM
-
2026-06-02days on market $116,900 Active 133 DOM
-
2026-06-01days on market $116,900 Active 132 DOM
-
2026-05-31days on market $116,900 Active 131 DOM
-
2026-05-31days on market $116,900 Active 130 DOM
-
2026-01-20$116,900 New Listing 497-char remark
Show marketing remark (497 chars)
* No showings will be permitted without an agreed-upon price and an executed sales contract. * Please do not disturb tenants. Renovated 3-bedroom, 1.5-bath home in North Little Rock featuring stylish updates and durable vinyl plank flooring. A covered carport offers convenient parking, and the clean, modern interior makes this property a great option for investors or future homeowners. Currently leased for $1,095/month with a lease in place through 2/25/2026, offering reliable rental income.
-
2025-12-31historical
-
2025-07-08$119,900 New Listing
-
2025-02-28historical $1,095
-
2025-02-19historical $1,095
-
2025-01-04$1,095
-
2024-12-11historical $1,195
-
2024-10-26$1,195
-
2024-07-18$1,195
-
2021-10-28soldstatus $47,500
-
2008-04-04soldstatus $31,518
-
2007-01-12soldstatus $61,000
ⓘ Source: listings_history table (triggers on properties + properties_extension) + one-shot
backfill from property_details.listing_events for pre-trigger history.
Tax reassessment forecast AR · Resets to sale price
- Current annual tax
- $774 · $64/mo
- Projected year-2 tax
- $774 · $64/mo
- Expected delta
- $0/yr ($0/mo · 0.0%)
ⓘ Screening estimate from a state-policy table — verify with the county assessor before closing.
Climate risk First Street
- Flood 1/10 Low FEMA zone X (unshaded) · 0% chance over 30 yrs
- Wildfire 3/10 Moderate
- Heat 7/10 Severe 7 d/yr ≥110°F today · 18 d/yr by 30 yrs out
- Wind 4/10 Moderate 9% chance of damaging wind over 30 yrs
- Air quality 2/10 Low 1 unhealthy d/yr today · 1 by 30 yrs out
Nearby sold comps map
Loading sold comps map…
Walkable amenities ~0.75 mi
Loading nearby amenities…
Taxation est. · year 1
- Rental income
- $14,433
- − Mortgage interest
- −$6,548
- − Property taxes
- −$774
- − Insurance
- −$584
- − Repairs & maintenance
- −$1,155
- − Management
- −$1,155
- − Depreciation
- −$3,401
- Taxable income
- $817
- Est. tax owed @ 24.0%
- −$196
- After-tax cash flow
- $2,492/yr
For passive investors: Depreciation is non-cash, so a rental often shows a tax loss while cash-flowing — sheltering income. Rental losses are passive: they offset passive income freely, and up to $25,000/yr can offset ordinary (W-2) income if you actively participate and your MAGI is under $100k (phasing out to $0 by $150k); unused losses carry forward. On sale, claimed depreciation is recaptured at up to 25%, and gains may owe capital-gains tax (a 1031 exchange can defer both). Figures are a year-1 estimate at your 24.0% rate — not tax advice; consult a CPA.
Schools (NCES district)
- District
- N. Little Rock School District
- NCES district ID
- 0510680
- Math proficiency
- 21% ▼ -11.00%
- Reading proficiency
- 26% ▼ -9.00%
- Median HH income
- $38,325
- Composite
- 19.69/100
- National rank
- #8728
- State rank
- #191 of 238 in AR
Livability — North Little Rock
- Score
- 73/100
- State rank
- #24
- US rank
- #5452
Category grades
Schools grade is shown separately in the Schools card above.
Census & demographics
- Census place
- North Little Rock, AR
- County
- Pulaski County · 372,764 people
- City population
- 55,470
- Metro
- Little Rock-North Little Rock-Conway, AR
- Population (ZIP)
- 10,093
- Household income
- $30,175
- Rent vs Own
- Severe rent burden
- 995.0
Population outlook (Pulaski County) Hauer SSP2
- Today (2025)
- 415,378 people
- By 2030
- 423,720 · +2.0%
- By 2040
- 435,182 · +4.8%
- By 2050
- 440,904 · +6.1%
- By 2075
- 445,521 · +7.3%
- By 2100
- 419,173 · +0.9%
Race, ethnicity, and origin ACS 2023
- Neighborhood character
- Predominantly Black (70%)
- Race & ethnicity
- Black 70% White 23% Hispanic / Latino 4% Two or more races 3%
- Common ancestry
- Slovak 1% Serbian 1%
- Foreign-born
- 3% · Canada, South Korea
- Languages at home
- 96% English-only · Spanish 2% Other Indo-European 1% Other Asian/Pacific 0%
Political lean MEDSL · Pulaski
- 2024 margin
- Strong D (+22.1) · D 59.8% · R 37.7% · Other 2.5%
- 2008→2024 swing
- +10.6pp toward D · 2008: 11.6pp · 2024: 22.1pp
- All cycles
- 2024: D+22.1 2020: D+22.5 2016: D+17.9 2012: D+11.4 2008: D+11.6
Not yet ingested
- Civics
- —
Market trends
- HPI YoY
- ▼ -2.70%
- Current HPI
- 121.4243
- Rent YoY
- ▲ 3.14%
- Metro
- Little Rock-North Little Rock-Conway, AR
- State GDP YoY
- ▲ 3.80%
- F500 in state
- 10
Industry mix (Fortune 500 HQ in AR)
| Industry | F500 HQs | Revenue |
|---|---|---|
| Retail | 1 | $681B |
|
||
| Food / Agriculture | 1 | $53B |
|
||
| Retail / Energy | 1 | $22B |
|
||
| Transportation / Logistics | 1 | $12B |
|
||
| Energy | 1 | $4B |
|
||
Price history
+91.6% since first listed12 events — show timeline
- 2026-01-20 Listed $116,900 CARMLS
- 2025-12-31 Listing Removed — CARMLS
- 2025-07-08 Listed $119,900 CARMLS
- 2025-02-28 Rental Removed $1,095 CARMLS
- 2025-02-19 Rental Removed $1,095 PROPERTYWARE
- 2025-01-04 Listed for Rent $1,095 PROPERTYWARE
- 2024-12-11 Rental Removed $1,195 PROPERTYWARE
- 2024-10-26 Listed for Rent $1,195 CARMLS
- 2024-07-18 Listed for Rent $1,195 PROPERTYWARE
- 2021-10-28 Sold (Public Records) $47,500 Public Records
- 2008-04-04 Sold (Public Records) $31,518 Public Records
- 2007-01-12 Sold (Public Records) $61,000 Public Records
Property tax history
-0.4%/yrLatest (2025): $774 · +6.0% YoY. Source: county tax records.
Cash-flow waterfall
monthlySold comps — $/sqft
last 12 mo · ≤1 miLoading sold comps…