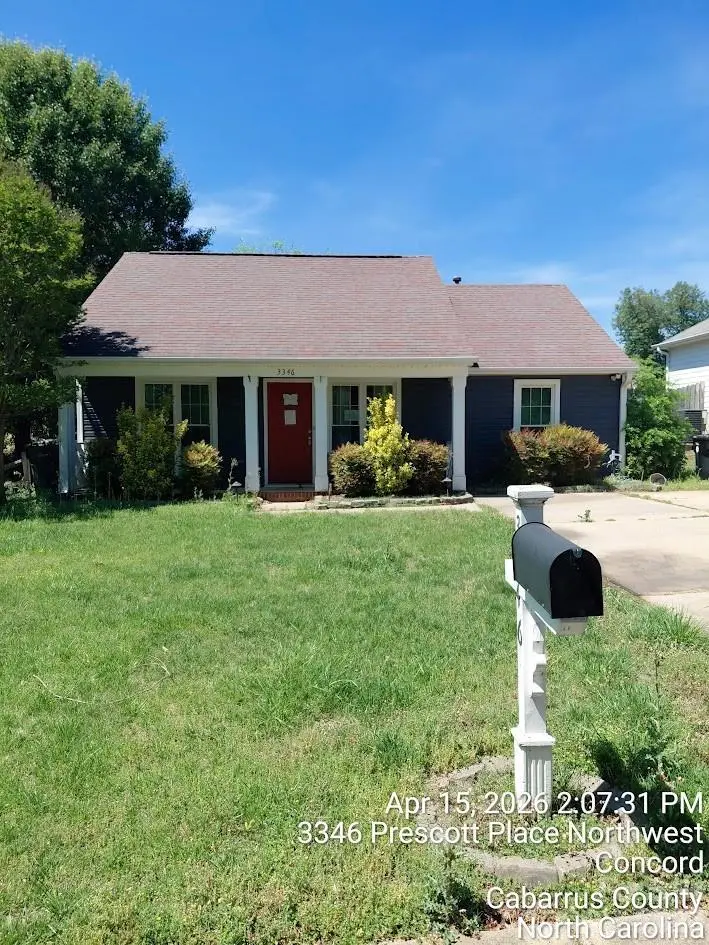
3346 Prescott Pl NW · Concord, NC
Flood risk 1/10 · Minimal
- FEMA flood zone
- X (unshaded)
- Chance of flooding over 30 yrs
- 0.0%
- Est. flood insurance / yr
- $507 – $1,088
Fire risk 3/10 · Minor
- Est. fire insurance / yr
- $906 – $1,684
Heat risk 6/10 · Moderate
- Hot days now (above 106°F)
- 7 days/yr
- Hot days in 30 yrs
- 17 days/yr
Wind risk 5/10 · Moderate
- Chance of severe wind over 30 yrs
- 22.0%
Air-quality risk 3/10 · Minor
- Unhealthy air days now
- 2 days/yr
- Unhealthy air days in 30 yrs
- 5 days/yr
Risk factors via First Street. Map © Google.
Why this score? — see what drove the D- grade
The composite is a weighted blend of 9 inputs, each scored 0–100. Each bar is that input's sub-score; the figure is the points it added to the 100-point composite (weight × sub-score).
- Cash flow +12.3/30.0
- Schools +4.7/10.0
- ARV discount +4.3/15.0
- Livability +4.0/5.0
- DSCR +3.6/10.0
- 1% rule +3.1/10.0
- Rent growth +2.5/5.0
- Condition / age +2.5/5.0
- Appreciation +0.0/10.0
$251,000
🖨 Deal sheet (PDF) 📄 Offer letter ✓ Due diligence
Listing remarks MLS
Beautiful 3 bedroom, 2 bath home located in the desirable Chadbury neighborhood with NO HOA! Home features so many updates including but not limited to, siding, windows and doors in 2017. Quartz countertops in the kitchen and baths in 2020, Luxury vinyl plank flooring in the living room, kitchen, dining, owners' bedroom, and both bathrooms and new Attic insulation in 2020. Home offers a split bedroom floor plan. Sit on the front porch and enjoy the mature landscaping or head out the custom 8ft dining room sliding glass door to the fenced in backyard & relax and enjoy the brand-new fire pit area. Home is owned by the listing agent.
Key facts
- 6,969 sq ft lot
- 2 garage spots
- Built 1993
Property features AI
Finance
- HOA & community: No HOA
Exterior
- Parking: Attached garage; Main-level garage; 2-car garage
- Utilities: City water; Public sewer
- Home design: Single-family residence; Residential property; Planned Unit Development (PUD)
- Construction: Site-built construction; Vinyl and wood exterior materials; Built as one story
- Exterior features: Concrete and paved public road access; Lot included (0.16 acres)
Interior
- Kitchen: Dishwasher; Electric oven; Electric range; Electric water heater
- Bedrooms: Three bedrooms on the main level
- Bathrooms: Two full bathrooms on the main level
- Interior features: Central heating; Central air; One-level home; Slab foundation; Room count: 1
- Laundry & utility: Laundry located inside
Neighborhood map
What this means for you Summary
Snapshot
- This is a 3-bed/2.0-bath single-family listed at $251k.
Deal economics
- At list price, monthly cash flow is $-46 ($-557/yr) — negative.
- To cash-flow at today's rent, offer at most $243k (3.3% below list).
- To meet the 1% rule (rent ≥ 1% of price), the offer needs to be $202k (19.4% below list).
- Recommended offer: $202k (19.4% below list) — sets the bar for 1% rule.
- Cap rate 6.1% vs local median 3.3% in Concord — top-decile yield for the area; either an underpriced asset or a hidden risk that comps aren't pricing in. Stress-test before assuming the spread holds.
Location & tenants
- Location reads 81/100 on livability (#18 in NC, #1,595 nationally) — a professional / high-income tenant draw. Strengths: cost of living A+, housing A+, health & safety A+; Watch: schools C-, commute F.
- Cabarrus County Schools (rural): math 54% / reading 55% proficiency, ranked #44 of 178 in NC (top 25%) — acceptable for families but not a draw, mixed tenant base, ~2y average lease.
- Market conditions: Rents soft (-0.2%/yr); 522 active listings in the ZIP; 2 comparable units currently listed for rent nearby; solid renter incomes; 2,485 units permitted in Cabarrus County in 2024 (677 in 5+ unit buildings).
Forward outlook
- Local home prices are declining (-3.0%/yr); year-one equity from $2k of loan paydown is wiped out by about $8k of value loss. Plan a longer hold.
- Cabarrus County population projected at +44% by 2050 — long-run rental-demand tailwind backs the buy-and-hold thesis.
Negotiation context
- It's been on market 17 days — a 2% lower offer ($247k) is reasonable based on typical stale-listing flexibility.
- 3 sale attempts since 11y ago with the ask held roughly flat each time — persistent listings suggest the price (not the market) is what's stuck; bring a comps-based counter.
Risks & watch-outs
- Climate carrying-cost: moderate wind risk, 22% chance of damaging wind over 30y; extreme-heat days projected 7→17/yr by 2055 (HVAC capex compounding) — expect insurance premiums to compound above CPI over the hold.
Questions for the listing agent
- What do current leases actually rent for vs. the listed asking? Can we see a recent rent roll and the last 12 months of T-12 income?
- Is there a deadline driving the sale (1031 exchange, divorce, estate, relocation)? That informs how much negotiation room exists.
- The area grade is low — what's the realistic commute time and amenity access for the typical tenant pool here? Any planned neighborhood developments (good or bad) we should know about?
- What's the average days-on-market for RENTAL listings here right now (not sales)? A rising rental-DOM trend means longer vacancies and softer asking-rent achievability than the comps imply.
- What's the recent tenant-quality profile in this submarket — average credit score on applications, eviction rate, late-payment / NSF rate, and stable-employment percentage? A property-management company in the area should have these aggregated.
- How much new for-sale + rental construction is in the pipeline within 1–3 miles? Heavy new supply typically softens prices + rents 12–24 months out; constrained supply supports both.
Investment metrics
- 1% rule
- 0.81% ✗
- Cap rate
- 6.07%
- Cash-on-cash
- -0.79%
- DSCR
- 0.96
- GRM
- 10.3
CMA / ARV
- ARV (on-the-fly)
- $234,234
- Comps found
- 10
Show comp detail 10 sales within ~0.75 mi
| Address | Dist | Beds/Ba | Sqft | Sold | Price | $/sf | Match |
|---|---|---|---|---|---|---|---|
| 3660 Fieldcrest Cir NW | 0.21mi | 2/1.0 (-1) | 972 (-4%) | 11mo | $194,000 | $200 | 65 |
| 562 Barrington Pl NW | 0.50mi | 3/1.5 | 1,067 (+5%) | 2mo | $205,000 | $192 | 64 |
| 3724 Patricia Dr NW | 0.35mi | 3/2.0 | 1,106 (+9%) | 7mo | $235,000 | $212 | 62 |
| 3029 Wendover Rd NW | 0.46mi | 3/1.0 | 1,032 (+2%) | 15mo | $275,000 | $266 | 60 |
| 3551 Rock Hill Church Rd | 0.25mi | 3/1.0 | 1,093 (+8%) | 20mo | $275,000 | $252 | 55 |
| 618 Springfield Dr NW | 0.26mi | 3/1.5 | 1,146 (+13%) | 11mo | $265,000 | $231 | 55 |
| 2895 Montford Ave NW | 0.49mi | 3/1.5 | 1,008 (-1%) | 23mo | $287,000 | $285 | 55 |
| 713 Springfield Dr NW | 0.31mi | 3/1.5 | 1,144 (+13%) | 11mo | $300,000 | $262 | 53 |
| 2883 Westfield Ave NW | 0.49mi | 3/1.0 | 1,129 (+11%) | 14mo | $250,000 | $221 | 43 |
| 3405 Eva Dr NW | 0.75mi | 2/1.0 (-1) | 931 (-8%) | 18mo | $190,000 | $204 | 28 |
Match score weights: distance 35% · size 25% · config 20% · recency 20%. Top-matched comps best support the ARV.
Projected returns pro-forma
-3.0% appreciation · 0.0% rent growth · sell at horizon
- IRR
- -20.9%
- Equity multiple
- 0.29×
- Total profit
- $-49,584
- Equity at exit
- $37,425
- IRR
- -22.5%
- Equity multiple
- 0.00×
- Total profit
- $-70,005
- Equity at exit
- $21,702
Cash invested: $70,280 (down + closing). Projections, not guarantees.
Landlord ↔ Tenant lean methodology
- Overall (STATE)
- 85 Strongly Landlord-Friendly
- State North Carolina
- 85 Strongly Landlord-Friendly · R+3
- County
- — inherits STATE
- City
- — inherits STATE
ZIP-level market 28027
- Rents YoY
- -0.2%
- Active inventory
- 522
- Price-to-rent
- 10.3×
Monthly cashflow live
- Estimated rent
- $2,024 medium interval (Pro) →
- Mortgage (P&I)
- −$1,316
- Tax from tax record
- −$225 /mo · $2,695/yr
- Insurance
- −$105
- HOA
- −$0
- Vacancy / Maint / Mgmt
- −$425
- Net cashflow
- $-46
Break-even live
Sensitivity live
| Price | -10% $96 | -5% $25 | +0% $-46 | +5% $-117 | +10% $-188 |
|---|---|---|---|---|---|
| Rent | -10% $-206 | -5% $-126 | +0% $-46 | +5% $34 | +10% $113 |
| Rate | -1.0pp $80 | -0.5pp $17 | base $-46 | +0.5pp $-111 | +1.0pp $-178 |
UW: 25.0% down · 7.5% · 30yr · 1.5% tax · 5.0% vac · 8.0% maint · 8.0% mgmt
Financing live
Cash to close
- Down payment
- $62,750
- Closing costs
- $7,530
- Reserves months
- —
- Total cash needed
- —
Loan-product check · same deal, 3 products live
Conventional
25% down · 7.5% · 30yr
- Down + closing
- —
- Monthly P&I
- —
- Monthly cashflow
- —
- DSCR
- —
- Eligible?
- —
Personal DTI + credit; lowest rate.
DSCR
20% down · 8.5% · 30yr
- Down + closing
- —
- Monthly P&I
- —
- Monthly cashflow
- —
- DSCR
- —
- Eligible?
- —
No personal income docs; deal must DSCR.
Hard money
10% down · 12.0% · 12mo
- Down + closing
- —
- Monthly P&I
- —
- Monthly cashflow
- —
- DSCR
- —
- Eligible?
- —
Short-term bridge; refi at stabilization.
Rent comps 2 comps
| Address | Beds | Baths | Sqft | Rent | $/sqft | DOM | Units | Dist |
|---|---|---|---|---|---|---|---|---|
| 3766 Lake Spring Ave NW Concord, NC | 3.0 | 2.0 | 1245 | $1,925 | $1.55 | 24d | 1 | 0.33mi |
| 335 Cliffwood St NW Unit E Concord, NC | 3.0 | 2.5 | 1338 | $1,850 | $1.38 | 24d | 1 | 1.10mi |
Listing history 12 events
-
2026-06-18days on market $251,000 Active 17 DOM
-
2026-06-15days on market $251,000 Active 16 DOM
-
2026-06-13days on market $251,000 Active 14 DOM
-
2026-06-09days on market $251,000 Active 10 DOM
-
2026-06-08days on market $251,000 Active 9 DOM
-
2026-06-07days on market $251,000 Active 8 DOM
-
2026-06-04days on market $251,000 Active 5 DOM
-
2026-06-03days on market $251,000 Active 4 DOM
-
2026-06-02days on market $251,000 Active 3 DOM
-
2026-06-01days on market $251,000 Active 2 DOM
-
2026-05-31remarks 512-char remark
-
2026-05-31$251,000 Active 1 DOM
ⓘ Source: listings_history table (triggers on properties + properties_extension) + one-shot
backfill from property_details.listing_events for pre-trigger history.
Tax reassessment forecast NC · Resets to sale price
- Current annual tax
- $2,695 · $225/mo
- Projected year-2 tax
- $2,695 · $225/mo
- Expected delta
- $0/yr ($0/mo · 0.0%)
ⓘ Screening estimate from a state-policy table — verify with the county assessor before closing.
Climate risk First Street
- Flood 1/10 Low FEMA zone X (unshaded) · 0% chance over 30 yrs
- Wildfire 3/10 Moderate
- Heat 6/10 Major 7 d/yr ≥106°F today · 17 d/yr by 30 yrs out
- Wind 5/10 Major 22% chance of damaging wind over 30 yrs
- Air quality 3/10 Moderate 2 unhealthy d/yr today · 5 by 30 yrs out
Nearby sold comps map
Loading sold comps map…
Walkable amenities ~0.75 mi
Loading nearby amenities…
Taxation est. · year 1
- Rental income
- $24,289
- − Mortgage interest
- −$14,060
- − Property taxes
- −$2,695
- − Insurance
- −$1,255
- − Repairs & maintenance
- −$1,943
- − Management
- −$1,943
- − Depreciation
- −$7,302
- Taxable loss
- −$4,909
- Est. tax savings @ 24.0%
- +$1,178
- After-tax cash flow
- $621/yr
For passive investors: Depreciation is non-cash, so a rental often shows a tax loss while cash-flowing — sheltering income. Rental losses are passive: they offset passive income freely, and up to $25,000/yr can offset ordinary (W-2) income if you actively participate and your MAGI is under $100k (phasing out to $0 by $150k); unused losses carry forward. On sale, claimed depreciation is recaptured at up to 25%, and gains may owe capital-gains tax (a 1031 exchange can defer both). Figures are a year-1 estimate at your 24.0% rate — not tax advice; consult a CPA.
Schools (NCES district)
- District
- Cabarrus County Schools
- NCES district ID
- 3700530
- Math proficiency
- 54% ▲ 4.00%
- Reading proficiency
- 55% ▲ 3.00%
- Median HH income
- $59,442
- Composite
- 47.42/100
- National rank
- #2282
- State rank
- #44 of 178 in NC
Livability — Concord
- Score
- 81/100
- State rank
- #18
- US rank
- #1595
Category grades
Schools grade is shown separately in the Schools card above.
Census & demographics
- Census place
- Concord, NC
- County
- Cabarrus County · 218,793 people
- City population
- 140,106
- Metro
- Charlotte-Concord-Gastonia, NC-SC
- Population (ZIP)
- 81,772
- Household income
- $92,219
- Rent vs Own
- Severe rent burden
- 1909.0
Population outlook (Cabarrus County) Hauer SSP2
- Today (2025)
- 239,273 people
- By 2030
- 260,754 · +9.0%
- By 2040
- 303,953 · +27.0%
- By 2050
- 344,827 · +44.1%
- By 2075
- 435,623 · +82.1%
- By 2100
- 490,119 · +104.8%
Race, ethnicity, and origin ACS 2023
- Neighborhood character
- Diverse neighborhood (Simpson 0.66)
- Race & ethnicity
- White 53% Black 19% Hispanic / Latino 14% Two or more races 9% Asian 9%
- Hispanic origin (detail)
- Mexican 8% Puerto Rican 3%
- Common ancestry
- Serbian 2% Slovak 1% Romanian 1%
- Foreign-born
- 14% · Canada, Vietnam, Jamaica
- Languages at home
- 80% English-only · Spanish 11% Other Asian/Pacific 3% Other Indo-European 3%
Political lean MEDSL · Cabarrus
- 2024 margin
- Lean R (+7.7) · D 45.5% · R 53.2% · Other 1.3%
- 2008→2024 swing
- +10.7pp toward D · 2008: -18.4pp · 2024: -7.7pp
- All cycles
- 2024: R+7.7 2020: R+9.4 2016: R+20.0 2012: R+20.2 2008: R+18.4
Not yet ingested
- Civics
- —
Market trends
- HPI YoY
- ▼ -167.18%
- Current HPI
- 238.3699
- Rent YoY
- ▼ -0.20%
- Metro
- Charlotte-Concord-Gastonia, NC-SC
- State GDP YoY
- ▲ 3.28%
- F500 in state
- 26
Industry mix (Fortune 500 HQ in NC)
| Industry | F500 HQs | Revenue |
|---|---|---|
| Financial Services | 2 | $213B |
|
||
| Retail | 2 | $95B |
|
||
| Industrial Conglomerate | 1 | $38B |
|
||
| Metals / Steel | 1 | $35B |
|
||
| Utilities | 1 | $30B |
|
||
| Industrial Machinery | 1 | $19B |
|
||
Price history
+200.6% since first listed12 events — show timeline
- 2026-05-30 Listed $251,000 CANOPYMLS as Distributed by MLS Grid
- 2022-08-04 Sold (MLS) $314,900 CANOPYMLS as Distributed by MLS Grid
- 2022-07-02 Pending — CANOPYMLS as Distributed by MLS Grid
- 2022-06-29 Price Changed $309,000 CANOPYMLS as Distributed by MLS Grid
- 2022-06-24 Listed $319,900 CANOPYMLS as Distributed by MLS Grid
- 2022-06-22 Coming Soon $319,900 CANOPYMLS as Distributed by MLS Grid
- 2015-04-07 Sold (Public Records) $99,000 Public Records
- 2015-04-06 Sold (MLS) $99,000 CANOPYMLS as Distributed by MLS Grid
- 2015-02-27 Contingent — CANOPYMLS as Distributed by MLS Grid
- 2015-02-26 Listed $98,000 CANOPYMLS as Distributed by MLS Grid
- 2005-10-24 Sold (Public Records) $99,000 Public Records
- 1998-03-01 Sold (Public Records) $83,500 Public Records
Property tax history
+7.2%/yrLatest (2025): $2,695 · +0.0% YoY. Source: county tax records.
Cash-flow waterfall
monthlySold comps — $/sqft
last 12 mo · ≤1 miLoading sold comps…