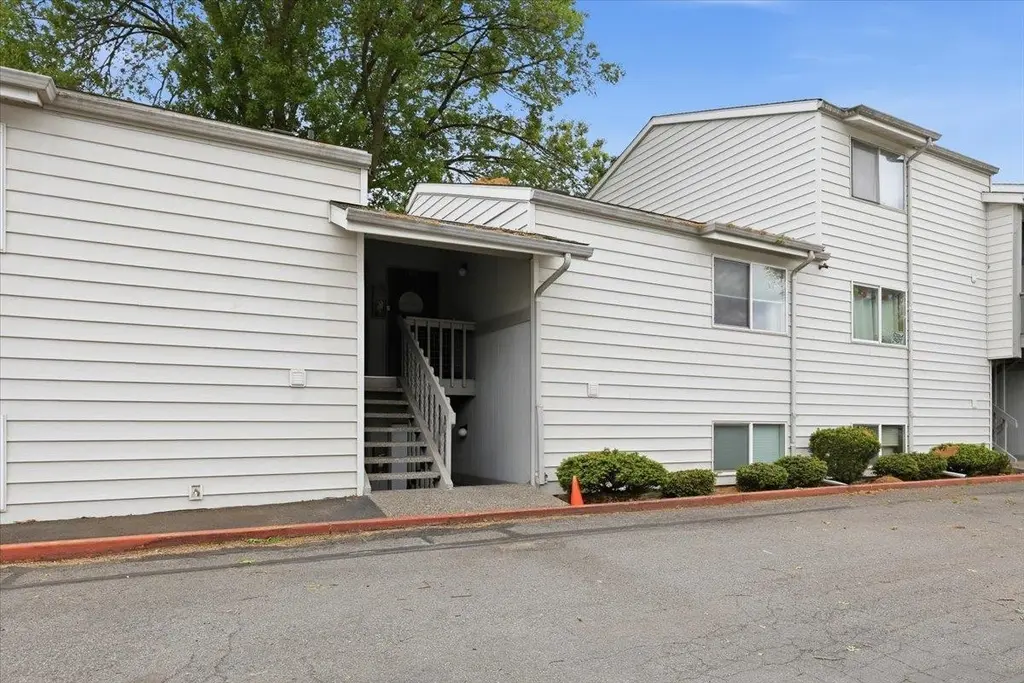
310 N Raymond Rd Unit D-23 · Spokane Valley, WA
Flood risk 1/10 · Minimal
- FEMA flood zone
- X (unshaded)
- Chance of flooding over 30 yrs
- 0.0%
- Est. flood insurance / yr
- $507 – $1,088
Fire risk 3/10 · Minor
- Est. fire insurance / yr
- $604 – $1,122
Heat risk 3/10 · Minor
- Hot days now (above 94°F)
- 7 days/yr
- Hot days in 30 yrs
- 15 days/yr
Wind risk 1/10 · Minimal
- Chance of severe wind over 30 yrs
- —
Air-quality risk 9/10 · Severe
- Unhealthy air days now
- 17 days/yr
- Unhealthy air days in 30 yrs
- 17 days/yr
Risk factors via First Street. Map © Google.
Why this score? — see what drove the F grade
The composite is a weighted blend of 9 inputs, each scored 0–100. Each bar is that input's sub-score; the figure is the points it added to the 100-point composite (weight × sub-score).
- ARV discount +7.5/15.0
- Cash flow +6.4/30.0
- Schools +5.4/10.0
- Livability +4.2/5.0
- 1% rule +3.2/10.0
- Rent growth +3.1/5.0
- Condition / age +2.5/5.0
- DSCR +0.7/10.0
- Appreciation +0.0/10.0
$139,000
🖨 Deal sheet 📄 Offer letter ✓ Due diligence
Listing remarks
Carefree living awaits! Discover convenient, affordable condo living in a great Spokane Valley location. This second-floor (top) unit has been recently updated with new carpet and fresh paint throughout. Enjoy all the free time you'll have from not doing yardwork by relaxing at the community pool or sipping coffee on your spacious balcony. Assigned covered parking space and secure storage unit included. Additional guest parking is available. Unit has been plumbed for washer/dryer combo with on-site coin-op laundry facilities available.
Key facts
- Guest parking
- Spacious balcony
- Secure storage unit
Tags
Property features AI
Finance
- HOA & community: Pet amenities; On-site maintenance; Community storage; Community laundry room
Exterior
- Parking: Assigned carport (1 space)
- Utilities: High-speed internet available (Xfinity)
- Home design: Residential condominium; See remarks for additional structure details; City street and paved road frontage
- Construction: Masonite siding; Composition roof
- Exterior features: Deck; Common grounds; Community pool
Interior
- Kitchen: Range, Dishwasher, Refrigerator, Disposal, Microwave
- Bedrooms: 1 bedroom
- Heating & cooling: Electric baseboard heating; Window air conditioning unit(s)
- Interior features: Range, Dishwasher, Refrigerator, Disposal, Microwave; Window air conditioning unit(s)
- Laundry & utility: On-site laundry room; Storage available
Neighborhood map
What this means for you Summary
Snapshot
- This is a 1-bed/1.0-bath condo listed at $139k.
Deal economics
- At list price, monthly cash flow is $-243 ($-3k/yr) — negative.
- To cash-flow at today's rent, offer at most $131k (5.8% below list).
- To meet the 1% rule (rent ≥ 1% of price), the offer needs to be $115k (17.6% below list).
- Recommended offer: $115k (17.6% below list) — sets the bar for 1% rule.
- Cap rate 4.2% vs local median 3.0% in Spokane Valley — top-decile yield for the area; either an underpriced asset or a hidden risk that comps aren't pricing in. Stress-test before assuming the spread holds.
Location & tenants
- Location reads 85/100 on livability (#31 in WA, #512 nationally) — a professional / high-income tenant draw. Strengths: amenities A+, commute A+, housing A+; Watch: crime D+.
- Central Valley School District (urban): math 55% / reading 66% proficiency, ranked #55 of 291 in WA (top 19%) — acceptable for families but not a draw, mixed tenant base, ~2y average lease.
- Zoned schools: Opportunity Elementary (634 students, 66% FRL); University High School (1,445 students, 46% FRL) — zoned schools average 56% FRL vs 28% district-wide (28 pts higher); higher-poverty schools than district average — tighter screening recommended.
- Market conditions: Rents rising (+2.4%/yr); 303 active listings in the ZIP; 16 comparable units currently listed for rent nearby; rentals at typical pace (median 24d on market — plan ~3-4 weeks tenant-placement turnaround); 44% of comp listings sitting > 30 days — soft ceiling on asking rent; solid renter incomes; 3,608 units permitted in Spokane County in 2024 (1,792 in 5+ unit buildings).
- This rent is only 17% of the median local income ($82k/yr) — well below the 30% rent-burden line; pricing power to push rent on renewal without tenant pushback.
Forward outlook
- Local home prices are declining (-3.0%/yr); year-one equity from $961 of loan paydown is wiped out by about $4k of value loss. Plan a longer hold.
- Spokane County population projected at +13% by 2050 — modest demand growth; plan on rents tracking national, not racing it.
Negotiation context
- It's been on market 23 days — a 2% lower offer ($137k) is reasonable based on typical stale-listing flexibility.
- Current owner paid $38k; list at $139k implies a 266% gain — meaningful room to come down on a strong offer.
Questions for the listing agent
- What do current leases actually rent for vs. the listed asking? Can we see a recent rent roll and the last 12 months of T-12 income?
- Built in 1976 — when were the roof, HVAC, electrical panel, plumbing, and water heater last replaced?
- What does the HOA fee cover, when was the last increase, and are there any pending special assessments or reserve-fund shortfalls?
- Any open or pending special assessments — roof, HVAC, plumbing, elevator, façade? What's the per-unit balance and payoff schedule, and is the seller paying it off at close or rolling it to the buyer?
- Is there a deadline driving the sale (1031 exchange, divorce, estate, relocation)? That informs how much negotiation room exists.
- Schools are B-rated — typically a magnet for longer-tenancy family renters. What's the average tenant stay here, and is there a school-zone premium baked into asking?
- Crime grade is D in this area — have there been break-ins, vandalism, or insurance claims at this property in the last 3 years? What carrier currently insures it and at what premium?
- The area grade is low — what's the realistic commute time and amenity access for the typical tenant pool here? Any planned neighborhood developments (good or bad) we should know about?
- What's the average days-on-market for RENTAL listings here right now (not sales)? A rising rental-DOM trend means longer vacancies and softer asking-rent achievability than the comps imply.
- What's the recent tenant-quality profile in this submarket — average credit score on applications, eviction rate, late-payment / NSF rate, and stable-employment percentage? A property-management company in the area should have these aggregated.
- How much new apartment / multifamily construction is in the pipeline within 1–3 miles? Heavy new supply (>2% of stock underway) typically softens rents 12–24 months out; light construction supports rent growth.
Investment metrics
- 1% rule
- 0.82% ✗
- Cap rate
- 4.19%
- Cash-on-cash
- -7.50%
- DSCR
- 0.67
- GRM
- 10.1
CMA / ARV
No comps found within radius.
Projected returns pro-forma
-3.0% appreciation · 2.44% rent growth · sell at horizon
- IRR
- -30.0%
- Equity multiple
- 0.01×
- Total profit
- $-38,531
- Equity at exit
- $20,725
- IRR
- -34.2%
- Equity multiple
- -0.43×
- Total profit
- $-55,573
- Equity at exit
- $12,018
Cash invested: $38,920 (down + closing). Projections, not guarantees.
Landlord ↔ Tenant lean methodology
- Overall (STATE)
- 28 Tenant-Leaning
- State Washington
- 28 Tenant-Leaning · D+8
- County
- — inherits STATE
- City
- — inherits STATE
ZIP-level market 99206
- Rents YoY
- 2.4%
- Active inventory
- 303
- Price-to-rent
- 10.1×
Monthly cashflow live
- Estimated rent
- $1,146 high interval (Pro) →
- Mortgage (P&I)
- −$729
- Tax est. 1.5%
- −$174 /mo · $2,085/yr
- Insurance
- −$58
- HOA est. from 1 same-building comp
- −$188
- Vacancy / Maint / Mgmt
- −$241
- Net cashflow
- $-243
Break-even live
UW: 25.0% down · 7.5% · 30yr · 1.5% tax · 5.0% vac · 8.0% maint · 8.0% mgmt
Financing live
Cash to close
- Down payment
- $34,750
- Closing costs
- $4,170
- Reserves months
- —
- Total cash needed
- —
Loan-product check · same deal, 3 products live
Conventional
25% down · 7.5% · 30yr
- Down + closing
- —
- Monthly P&I
- —
- Monthly cashflow
- —
- DSCR
- —
- Eligible?
- —
Personal DTI + credit; lowest rate.
DSCR
20% down · 8.5% · 30yr
- Down + closing
- —
- Monthly P&I
- —
- Monthly cashflow
- —
- DSCR
- —
- Eligible?
- —
No personal income docs; deal must DSCR.
Hard money
10% down · 12.0% · 12mo
- Down + closing
- —
- Monthly P&I
- —
- Monthly cashflow
- —
- DSCR
- —
- Eligible?
- —
Short-term bridge; refi at stabilization.
Rent comps 16 comps
| Address | Beds | Baths | Sqft | Rent | $/sqft | DOM | Units | Dist |
|---|---|---|---|---|---|---|---|---|
| 312 N University Rd Unit 3 Spokane Valley, WA | — | 1.0 | 540 | $995 | $1.84 | 43d | 1 | 0.09mi |
| 10112 E Broadway Ave Spokane Valley, WA | 1.0 | 1.0 | 600 | $1,250 | $2.08 | 43d | 1 | 0.39mi |
| 111 N Walnut Rd Spokane Valley, WA | 2.0 | 1.0 | 730 | $1,095 | $1.50 | 43d | 2 | 0.42mi |
| 10816 E 3rd Ave Spokane Valley, WA | 1.0 | 1.0 | 700 | $1,172 | $1.68 | 14d | 1 | 0.46mi |
| 10820 E 3rd Ave Unit 9 Spokane Valley, WA | 1.0 | 1.0 | 700 | $1,195 | $1.71 | 43d | 1 | 0.46mi |
| 22 N Skipworth Rd #14 Spokane Valley, WA | 2.0 | 1.0 | 714 | $1,150 | $1.61 | 21d | 1 | 0.50mi |
| 210 S Farr Rd Spokane Valley, WA | 1.0–2.0 | 1.0 | 797 | $1,095 | $1.37 | 14d | 8 | 0.72mi |
| 515 S Farr Rd Spokane Valley, WA | 1.0–2.0 | 1.0 | 690 | $1,075 | $1.56 | 43d | 1 | 0.76mi |
| 22 N Willow Rd Unit 17 Spokane Valley, WA | 1.0 | 1.0 | 605 | $995 | $1.64 | 23d | 1 | 0.78mi |
| 11813 E Broadway Ave Spokane Valley, WA | 3.0 | 1.0–2.0 | 918 | $1,406 | $1.53 | 14d | 26 | 0.87mi |
| 10211 E 14th Ave Spokane Valley, WA | 1.0–2.0 | 1.0 | 789 | $1,250 | $1.58 | 14d | 1 | 1.07mi |
| 12403 E 3rd Ave Spokane Valley, WA | 1.0 | 1.0 | 556 | $1,100 | $1.98 | 43d | 1 | 1.19mi |
| 1723 N Union Rd Spokane Valley, WA | 1.0–2.0 | 1.0–2.0 | 818 | $1,180 | $1.44 | 14d | 5 | 1.20mi |
| 12623 E Broadway Ave Spokane Valley, WA | 1.0–3.0 | 1.0–2.0 | 952 | $1,310 | $1.38 | 14d | 9 | 1.36mi |
| 2301 N Wilbur Rd Spokane Valley, WA | 1.0–2.0 | 1.0–2.0 | 837 | $1,150 | $1.37 | 43d | 4 | 1.41mi |
| 12415 E 12th Ave Spokane Valley, WA | 1.0–2.0 | 1.0 | 840 | $1,295 | $1.54 | 14d | 3 | 1.48mi |
HOA detail condo
- Monthly dues
- $0 · $0/yr
- Likely covers
- pool
- Assessments
- None detected in remarks — confirm with the listing agent.
Listing history 19 events
-
2026-06-18days on market $139,000 Active 23 DOM
-
2026-06-17days on market $139,000 Active 22 DOM
-
2026-06-16days on market $139,000 Active 21 DOM
-
2026-06-15days on market $139,000 Active 20 DOM
-
2026-06-14days on market $139,000 Active 18 DOM
-
2026-06-10days on market $139,000 Active 15 DOM
-
2026-06-09days on market $139,000 Active 14 DOM
-
2026-06-08days on market $139,000 Active 13 DOM
-
2026-06-07days on market $139,000 Active 12 DOM
-
2026-06-05days on market $139,000 Active 9 DOM
-
2026-06-03days on market $139,000 Active 8 DOM
-
2026-06-02days on market $139,000 Active 7 DOM
-
2026-06-01days on market $139,000 Active 6 DOM
-
2026-05-31days on market $139,000 Active 5 DOM
-
2026-05-31days on market $139,000 Active 4 DOM
-
2026-05-26$139,000 Active
-
2006-08-25soldstatus $38,000
-
2006-08-25soldstatus $38,000
-
1980-02-15soldstatus $20,000
ⓘ Source: listings_history table (triggers on properties + properties_extension) + one-shot
backfill from property_details.listing_events for pre-trigger history.
Climate risk First Street
- Flood 1/10 Low FEMA zone X (unshaded) · 0% chance over 30 yrs
- Wildfire 3/10 Moderate
- Heat 3/10 Moderate 7 d/yr ≥94°F today · 15 d/yr by 30 yrs out
- Wind 1/10 Low
- Air quality 9/10 Extreme 17 unhealthy d/yr today · 17 by 30 yrs out
Nearby sold comps map
Loading sold comps map…
Walkable amenities ~0.75 mi
Loading nearby amenities…
Taxation est. · year 1
- Rental income
- $13,751
- − Mortgage interest
- −$7,786
- − Property taxes
- −$2,085
- − Insurance
- −$695
- − Repairs & maintenance
- −$1,100
- − Management
- −$1,100
- − HOA
- −$2,256
- − Depreciation
- −$4,044
- Taxable loss
- −$5,315
- Est. tax savings @ 24.0%
- +$1,276
- After-tax cash flow
- $-1,644/yr
For passive investors: Depreciation is non-cash, so a rental often shows a tax loss while cash-flowing — sheltering income. Rental losses are passive: they offset passive income freely, and up to $25,000/yr can offset ordinary (W-2) income if you actively participate and your MAGI is under $100k (phasing out to $0 by $150k); unused losses carry forward. On sale, claimed depreciation is recaptured at up to 25%, and gains may owe capital-gains tax (a 1031 exchange can defer both). Figures are a year-1 estimate at your 24.0% rate — not tax advice; consult a CPA.
Schools (NCES district)
- District
- Central Valley School District
- NCES district ID
- 5301110
- Math proficiency
- 55% ▬ 0.00%
- Reading proficiency
- 66% ▬ 0.00%
- Median HH income
- $55,824
- Composite
- 53.62/100
- National rank
- #3107
- State rank
- #55 of 291 in WA
Livability — Spokane Valley
- Score
- 85/100
- State rank
- #31
- US rank
- #512
Category grades
Schools grade is shown separately in the Schools card above.
Census & demographics
- Census place
- Spokane Valley, WA
- County
- Spokane County · 496,401 people
- City population
- 129,511
- Metro
- Spokane-Spokane Valley, WA
- Population (ZIP)
- 41,089
- Household income
- $81,764
- Rent vs Own
- Severe rent burden
- 1523.0
Population outlook (Spokane County) Hauer SSP2
- Today (2025)
- 531,314 people
- By 2030
- 549,278 · +3.4%
- By 2040
- 577,822 · +8.8%
- By 2050
- 598,188 · +12.6%
- By 2075
- 630,744 · +18.7%
- By 2100
- 622,360 · +17.1%
Race, ethnicity, and origin ACS 2023
- Neighborhood character
- Predominantly White (82%)
- Race & ethnicity
- White 82% Two or more races 8% Hispanic / Latino 7% Black 2% Asian 2%
- Hispanic origin (detail)
- Mexican 4%
- Common ancestry
- Portuguese 5% Slovak 3% Lithuanian 3%
- Foreign-born
- 5% · Canada, Vietnam
- Languages at home
- 93% English-only · Spanish 3% Russian/Polish/Slavic 1% Other Asian/Pacific 1%
Political lean MEDSL · Spokane
- 2024 margin
- Toss-up / Even · D 46.0% · R 51.0% · Other 3.0%
- 2008→2024 swing
- -3.8pp toward R · 2008: -1.1pp · 2024: -5.0pp
- All cycles
- 2024: R+5.0 2020: R+4.3 2016: R+8.3 2012: R+6.3 2008: R+1.1
Not yet ingested
- Civics
- —
Market trends
- HPI YoY
- ▼ -377.59%
- Current HPI
- 339.9959
- Rent YoY
- ▲ 2.44%
- Metro
- Spokane-Spokane Valley, WA
- State GDP YoY
- ▲ 4.65%
- F500 in state
- 22
Industry mix (Fortune 500 HQ in WA)
| Industry | F500 HQs | Revenue |
|---|---|---|
| Retail | 2 | $269B |
|
||
| Technology / Retail | 1 | $638B |
|
||
| Technology | 1 | $245B |
|
||
| Telecommunications | 1 | $38B |
|
||
| Food / Beverage | 1 | $36B |
|
||
| Automotive / Trucks | 1 | $34B |
|
||
Price history
+595.0% since first listed4 events — show timeline
- 2026-05-26 Listed $139,000 SPOKANEMLS as Distributed by MLS Grid
- 2006-08-25 Sold (Public Records) $38,000 Public Records
- 2006-08-25 Sold (Public Records) $38,000 Public Records
- 1980-02-15 Sold (Public Records) $20,000 Public Records
Property tax history
-16.3%/yrLatest (2026): $53 · -39.4% YoY. Source: county tax records.
Cash-flow waterfall
monthlySold comps — $/sqft
last 12 mo · ≤1 miLoading sold comps…