16600 Orange Ave #77 · Paramount, CA
Flood risk 5/10 · Moderate
- FEMA flood zone
- X
- Chance of flooding over 30 yrs
- 0.24%
- Est. flood insurance / yr
- $507 – $1,088
Fire risk 1/10 · Minimal
- Est. fire insurance / yr
- $659 – $1,223
Heat risk 4/10 · Minor
- Hot days now (above 90°F)
- 6 days/yr
- Hot days in 30 yrs
- 19 days/yr
Wind risk 1/10 · Minimal
- Chance of severe wind over 30 yrs
- —
Air-quality risk 6/10 · Moderate
- Unhealthy air days now
- 10 days/yr
- Unhealthy air days in 30 yrs
- 10 days/yr
Risk factors via First Street. Map © Google.
Why this score? — see what drove the B grade
The composite is a weighted blend of 9 inputs, each scored 0–100. Each bar is that input's sub-score; the figure is the points it added to the 100-point composite (weight × sub-score).
- Cash flow +30.0/30.0
- ARV discount +11.9/15.0
- 1% rule +10.0/10.0
- DSCR +10.0/10.0
- Condition / age +4.0/5.0
- Livability +3.2/5.0
- Rent growth +2.3/5.0
- Schools +2.1/10.0
- Appreciation +0.0/10.0
$179,900
🖨 Deal sheet (PDF) 📄 Offer letter ✓ Due diligence
Listing remarks MLS
Beautifully updated 3-bedroom, 2-bathroom mobile home located in the desirable city of Paramount. This home features a stunning upgraded kitchen with abundant cabinet space, elegant granite countertops, and a stylish tile backsplash—perfect for both everyday living and entertaining. Enjoy laminated wood flooring throughout, creating a warm and modern feel. Both bathrooms have been tastefully remodeled in recent years, offering comfort and convenience. Ideally situated near local schools, shopping, and with easy access to the 91 and 105 freeways, making commuting a breeze—just about 25 minutes from Downtown Los Angeles. Located in a family-oriented community with great amenities including a pool, park area, basketball court, and relaxing jacuzzi—perfect for all ages to enjoy. This home also has a spacious yard. Don’t miss this opportunity to own a move-in ready home in a prime location!
Key facts
- Updated kitchen
- Granite countertops
- Tile backsplash
Tags
Neighborhood map
What this means for you Summary
Snapshot
- This is a 3-bed/2.0-bath manufactured listed at $180k. Condition is rated good.
Deal economics
- At list price, monthly cash flow is $896 ($11k/yr) — positive.
- The deal already cash-flows at list — no discount required.
- Meets the 1% rule at list price ($3k rent vs $180k).
- Recommended offer: $169k (6.0% below list) — sets the bar for market timing.
- Cap rate 12.3% vs local median 3.3% in Paramount — top-decile yield for the area; either an underpriced asset or a hidden risk that comps aren't pricing in. Stress-test before assuming the spread holds.
Location & tenants
- Location reads 64/100 on livability (#432 in CA) — a middle-class / working-renter tenant base. Strengths: commute A+; Watch: schools D, crime F, amenities F.
- Paramount Unified (suburban): math 15% / reading 34% proficiency, ranked #416 of 517 in CA (top 80%) — low school quality limits family demand, transient renter base, plan for 1-2y turnover; 76% free/reduced lunch — lower-income household profile, screen leases tightly.
- Market conditions: Rents soft (-1.0%/yr); 50 active listings in the ZIP; 28 comparable units currently listed for rent nearby; rentals lingering (median 45d on market — plan ~5-8 weeks vacancy on turnover, expect pricing pressure); 50% of comp listings sitting > 30 days — soft ceiling on asking rent; solid renter incomes; 19,697 units permitted in Los Angeles County in 2024 (9,426 in 5+ unit buildings).
- This rent runs 43% of the median local income ($75k/yr) — at the standard rent-burdened threshold; future hikes will face affordability resistance.
Forward outlook
- Local home prices are declining (-3.0%/yr); year-one equity from $1k of loan paydown is wiped out by about $5k of value loss. Plan a longer hold.
- Los Angeles County population projected at +9% by 2050 — modest demand growth; plan on rents tracking national, not racing it.
- At projected returns (-3.0% appreciation + 0.0% rent growth), your $50k cash investment doubles in ~8 years — after that, you're playing with house money.
Negotiation context
- It's been on market 68 days — a 6% lower offer ($169k) is reasonable based on typical stale-listing flexibility.
- 4 sale attempts with the ask held roughly flat each time — persistent listings suggest the price (not the market) is what's stuck; bring a comps-based counter.
Risks & watch-outs
- Climate carrying-cost: moderate flood risk — expect insurance premiums to compound above CPI over the hold.
Questions for the listing agent
- It's been on market 68 days. Have you received any prior offers? Is the seller open to a 6% concession, seller financing, or rate buy-down credit?
- Built in 1974 — when were the roof, HVAC, electrical panel, plumbing, and water heater last replaced?
- Why hasn't it sold? Are there any deal-killer items the seller is aware of (foundation, flood, title, zoning, code violations)?
- Is there a deadline driving the sale (1031 exchange, divorce, estate, relocation)? That informs how much negotiation room exists.
- Schools are D-rated, which usually means shorter tenancies and higher turnover. Who's the typical renter profile here, and what's been the actual vacancy rate?
- Crime grade is F in this area — have there been break-ins, vandalism, or insurance claims at this property in the last 3 years? What carrier currently insures it and at what premium?
- What's the average days-on-market for RENTAL listings here right now (not sales)? A rising rental-DOM trend means longer vacancies and softer asking-rent achievability than the comps imply.
- What's the recent tenant-quality profile in this submarket — average credit score on applications, eviction rate, late-payment / NSF rate, and stable-employment percentage? A property-management company in the area should have these aggregated.
- How much new for-sale + rental construction is in the pipeline within 1–3 miles? Heavy new supply typically softens prices + rents 12–24 months out; constrained supply supports both.
Investment metrics
- 1% rule
- 1.51% ✓
- Cap rate
- 12.27%
- Cash-on-cash
- 21.34%
- DSCR
- 1.95
- GRM
- 5.5
CMA / ARV
- ARV (median comp)
- $199,321
- List price
- $179,900
- Delta
- -9.74%
- Verdict
- FAIR
- Comps
- 10 within 1.0 mi
Show comp detail 6 sales within ~0.75 mi
| Address | Dist | Beds/Ba | Sqft | Sold | Price | $/sf | Match |
|---|---|---|---|---|---|---|---|
| 16601 Garfield Ave #110 | 0.35mi | 2/2.0 (-1) | 960 (+9%) | 2mo | $115,000 | $120 | 62 |
| 15325 ORANGE AVE SPC E1 | 0.74mi | 2/2.0 (-1) | 880 (0%) | 2mo | $175,000 | $199 | 59 |
| 16511 S Garfield Ave S Unit B17 | 0.35mi | 2/2.0 (-1) | 1,000 (+14%) | 3mo | $125,000 | $125 | 54 |
| 16601 S Garfield Ave #204 | 0.36mi | 2/1.5 (-1) | 800 (-9%) | 21mo | $153,000 | $191 | 43 |
| 15325 Orange Ave Unit F16 | 0.74mi | 2/2.0 (-1) | 800 (-9%) | 9mo | $170,000 | $213 | 38 |
| 15325 Orange Ave Unit F17 | 0.74mi | 3/2.0 | 960 (+9%) | 17mo | $199,000 | $207 | 36 |
Match score weights: distance 35% · size 25% · config 20% · recency 20%. Top-matched comps best support the ARV.
Projected returns pro-forma
-3.0% appreciation · 0.0% rent growth · sell at horizon
- IRR
- 10.4%
- Equity multiple
- 1.40×
- Total profit
- $20,001
- Equity at exit
- $26,824
- IRR
- 16.9%
- Equity multiple
- 2.20×
- Total profit
- $60,375
- Equity at exit
- $15,554
Cash invested: $50,372 (down + closing). Projections, not guarantees.
Landlord ↔ Tenant lean methodology
- Overall (STATE)
- 18 Strongly Tenant-Friendly
- State California
- 18 Strongly Tenant-Friendly · D+13
- County
- — inherits STATE
- City
- — inherits STATE
ZIP-level market 90723
- Rents YoY
- -1.0%
- Active inventory
- 50
- Price-to-rent
- 5.5×
Monthly cashflow live
- Estimated rent
- $2,708 high interval (Pro) →
- Mortgage (P&I)
- −$943
- Tax est. 1.5%
- −$225 /mo · $2,698/yr
- Insurance
- −$75
- HOA
- −$0
- Vacancy / Maint / Mgmt
- −$569
- Net cashflow
- $896
Break-even live
Sensitivity live
| Price | -10% $1,020 | -5% $958 | +0% $896 | +5% $834 | +10% $771 |
|---|---|---|---|---|---|
| Rent | -10% $682 | -5% $789 | +0% $896 | +5% $1,003 | +10% $1,110 |
| Rate | -1.0pp $986 | -0.5pp $941 | base $896 | +0.5pp $849 | +1.0pp $802 |
UW: 25.0% down · 7.5% · 30yr · 1.5% tax · 5.0% vac · 8.0% maint · 8.0% mgmt
Financing live
Cash to close
- Down payment
- $44,975
- Closing costs
- $5,397
- Reserves months
- —
- Total cash needed
- —
Loan-product check · same deal, 3 products live
Conventional
25% down · 7.5% · 30yr
- Down + closing
- —
- Monthly P&I
- —
- Monthly cashflow
- —
- DSCR
- —
- Eligible?
- —
Personal DTI + credit; lowest rate.
DSCR
20% down · 8.5% · 30yr
- Down + closing
- —
- Monthly P&I
- —
- Monthly cashflow
- —
- DSCR
- —
- Eligible?
- —
No personal income docs; deal must DSCR.
Hard money
10% down · 12.0% · 12mo
- Down + closing
- —
- Monthly P&I
- —
- Monthly cashflow
- —
- DSCR
- —
- Eligible?
- —
Short-term bridge; refi at stabilization.
Rent comps 28 comps
| Address | Beds | Baths | Sqft | Rent | $/sqft | DOM | Units | Dist |
|---|---|---|---|---|---|---|---|---|
| 7029 Orange Ave Long Beach, CA | 2.0 | 1.0 | 700 | $2,519 | $3.60 | 45d | 1 | 0.19mi |
| 1319 E 68th St Long Beach, CA | 2.0 | 1.0 | 902 | $2,600 | $2.88 | 26d | 1 | 0.39mi |
| 6663 Gundry Ave Unit 1 Long Beach, CA | 2.0 | 2.0 | 800 | $2,195 | $2.74 | 45d | 1 | 0.57mi |
| 15351 Orange Ave #26 Paramount, CA | 2.0 | 2.0 | 837 | $2,550 | $3.05 | 45d | 1 | 0.66mi |
| 6576 Falcon Ave Long Beach, CA | 2.0 | 1.0 | 810 | $2,195 | $2.71 | 45d | 1 | 0.68mi |
| 6501 Cherry Ave Long Beach, CA | 2.0 | 1.0 | 915 | $1,874 | $2.05 | 16d | 1 | 0.83mi |
| 6890 Paramount Blvd Unit 12 Long Beach, CA | 3.0 | 1.0 | 1100 | $2,695 | $2.45 | 45d | 1 | 0.93mi |
| 1310 S Atlantic Dr Unit A Compton, CA | 3.0 | 1.0 | 869 | $3,200 | $3.68 | 0d | 1 | 1.00mi |
| 2921 E Artesia Blvd Long Beach, CA | 2.0 | 1.0 | 700 | $1,495 | $2.14 | 45d | 1 | 1.14mi |
| 7303 Exeter St #212 Paramount, CA | 2.0 | 1.0 | 839 | $2,550 | $3.04 | 0d | 1 | 1.14mi |
| 2890 E Artesia Blvd Long Beach, CA | 2.0 | 1.0 | 858 | $2,595 | $3.02 | 45d | 1 | 1.14mi |
| 6673 Hammond Ave Long Beach, CA | 2.0 | 2.0 | 825 | $2,295 | $2.78 | 45d | 1 | 1.16mi |
| 6667 Hammond Ave Long Beach, CA | 2.0 | 1.0 | 800 | $2,700 | $3.38 | 45d | 1 | 1.17mi |
| 6202 Cherry Ave Unit 6202 Long Beach, CA | 2.0 | 1.0 | 875 | $2,175 | $2.49 | 45d | 1 | 1.20mi |
| 15334 Orizaba Ave Paramount, CA | 3.0 | 1.0 | 1116 | $3,095 | $2.77 | 45d | 1 | 1.23mi |
| 2352 E Poppy St Long Beach, CA | 2.0 | 2.5 | 800 | $3,395 | $4.24 | 26d | 1 | 1.26mi |
| 2354 E Poppy St Long Beach, CA | 2.0 | 2.5 | 800 | $3,395 | $4.24 | 26d | 1 | 1.26mi |
| 7227 Richfield St Paramount, CA | 2.0 | 1.0–2.0 | 890 | $2,450 | $2.75 | 3d | 1 | 1.27mi |
| 7317 Richfield St Unit 7317 Paramount, CA | 3.0 | 1.0 | 924 | $3,200 | $3.46 | 45d | 1 | 1.29mi |
| 15142 Georgia Ave Paramount, CA | 3.0 | 2.0 | 864 | $3,200 | $3.70 | 8d | 1 | 1.34mi |
| 6045 Cherry Ave Unit 1 Long Beach, CA | 3.0 | 1.0 | 1095 | $2,850 | $2.60 | 14d | 1 | 1.35mi |
| 3384 E 67th St Apt 2 Long Beach, CA | 3.0 | 1.0 | 1000 | $3,234 | $3.23 | 45d | 1 | 1.38mi |
| 5948 John Ave Unit 5948 Long Beach, CA | 2.0 | 1.0 | 870 | $2,495 | $2.87 | 5d | 1 | 1.41mi |
| 5948 John Ave Long Beach, CA | 2.0 | 1.0 | 870 | $2,495 | $2.87 | 23d | 1 | 1.41mi |
| 15327 S Butler Ave Compton, CA | 2.0 | 1.0 | 716 | $2,875 | $4.02 | 3d | 1 | 1.45mi |
| 5933 Gaviota Ave Long Beach, CA | 2.0 | 1.0 | 800 | $2,800 | $3.50 | 6d | 1 | 1.45mi |
| 16825 Passage Ave Paramount, CA | 2.0 | 2.5 | 860 | $2,899 | $3.37 | 3d | 1 | 1.50mi |
| 16825 Passage Ave Paramount, CA | 2.0 | 2.5 | 860 | $2,950 | $3.43 | 45d | 1 | 1.50mi |
Listing history 11 events
-
2026-06-02days on market $179,900 Active 68 DOM
-
2026-06-01days on market $179,900 Active 67 DOM
-
2026-05-31days on market $179,900 Active 66 DOM
-
2026-03-25$179,900 Active 922-char remark
Show marketing remark (922 chars)
Beautifully updated 3-bedroom, 2-bathroom mobile home located in the desirable city of Paramount. This home features a stunning upgraded kitchen with abundant cabinet space, elegant granite countertops, and a stylish tile backsplash—perfect for both everyday living and entertaining. Enjoy laminated wood flooring throughout, creating a warm and modern feel. Both bathrooms have been tastefully remodeled in recent years, offering comfort and convenience. Ideally situated near local schools, shopping, and with easy access to the 91 and 105 freeways, making commuting a breeze—just about 25 minutes from Downtown Los Angeles. Located in a family-oriented community with great amenities including a pool, park area, basketball court, and relaxing jacuzzi—perfect for all ages to enjoy. This home also has a spacious yard. Don’t miss this opportunity to own a move-in ready home in a prime location!
-
2025-10-31historical
-
2025-08-01$179,900 Active
-
2025-05-17historical
-
2025-04-14price $179,000
-
2025-03-12status Active
-
2025-02-01$189,900 Active
-
2025-01-30historical
ⓘ Source: listings_history table (triggers on properties + properties_extension) + one-shot
backfill from property_details.listing_events for pre-trigger history.
Climate risk First Street
- Flood 5/10 Major FEMA zone X · 24% chance over 30 yrs
- Wildfire 1/10 Low
- Heat 4/10 Moderate 6 d/yr ≥90°F today · 19 d/yr by 30 yrs out
- Wind 1/10 Low
- Air quality 6/10 Major 10 unhealthy d/yr today · 10 by 30 yrs out
Nearby sold comps map
Loading sold comps map…
Walkable amenities ~0.75 mi
Loading nearby amenities…
Taxation est. · year 1
- Rental income
- $32,490
- − Mortgage interest
- −$10,077
- − Property taxes
- −$2,698
- − Insurance
- −$900
- − Repairs & maintenance
- −$2,599
- − Management
- −$2,599
- − Depreciation
- −$5,233
- Taxable income
- $8,383
- Est. tax owed @ 24.0%
- −$2,012
- After-tax cash flow
- $8,736/yr
For passive investors: Depreciation is non-cash, so a rental often shows a tax loss while cash-flowing — sheltering income. Rental losses are passive: they offset passive income freely, and up to $25,000/yr can offset ordinary (W-2) income if you actively participate and your MAGI is under $100k (phasing out to $0 by $150k); unused losses carry forward. On sale, claimed depreciation is recaptured at up to 25%, and gains may owe capital-gains tax (a 1031 exchange can defer both). Figures are a year-1 estimate at your 24.0% rate — not tax advice; consult a CPA.
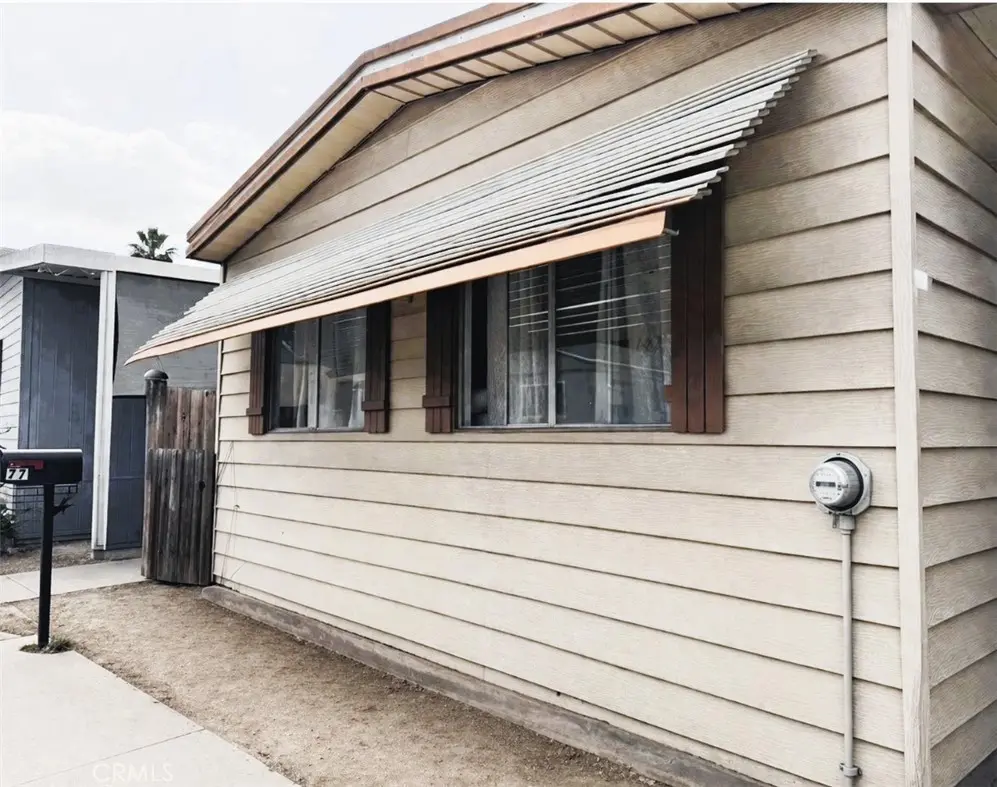
Condition & rehab AI · 7 photos
This beautifully updated mobile home in Paramount offers a good condition with a fresh, modern interior and a well-maintained exterior. It's located in a family-oriented community with easy access to freeways and local amenities.
Value-add opportunities
- Resale Paint exterior siding — Fresh paint can enhance curb appeal and home value.
- Rental Replace or clean gutters — Clean gutters improve drainage and prevent water damage, which is important for rental properties.
Renovation cost estimate screening
Value-add ROI direction
- Resale Paint exterior siding — Fresh paint can enhance curb appeal and home value. ↑
- Rental Replace or clean gutters — Clean gutters improve drainage and prevent water damage, which is important for rental properties. ↑
ⓘ Cost ranges are severity-bucket heuristics (US national rule-of-thumb). Get contractor quotes + a written scope before underwriting a rehab budget.
Schools (NCES district)
- District
- Paramount Unified
- NCES district ID
- 0629850
- Math proficiency
- 15% ▼ -14.00%
- Reading proficiency
- 34% ▼ -7.00%
- Median HH income
- $46,631
- Composite
- 21.25/100
- National rank
- #8398
- State rank
- #416 of 517 in CA
Livability — Paramount
- Score
- 64/100
- State rank
- #432
- US rank
- #14664
Category grades
Schools grade is shown separately in the Schools card above.
Census & demographics
- Census place
- Paramount, CA
- County
- Los Angeles County · 9,444,647 people
- City population
- 52,050
- Metro
- Los Angeles-Long Beach-Anaheim, CA
- Population (ZIP)
- 52,050
- Household income
- $75,250
- Rent vs Own
- Severe rent burden
- 2420.0
Population outlook (Los Angeles County) Hauer SSP2
- Today (2025)
- 10,940,515 people
- By 2030
- 11,256,481 · +2.9%
- By 2040
- 11,729,929 · +7.2%
- By 2050
- 11,948,407 · +9.2%
- By 2075
- 11,818,114 · +8.0%
- By 2100
- 10,842,928 · -0.9%
Race, ethnicity, and origin ACS 2023
- Neighborhood character
- Predominantly Hispanic (82%)
- Race & ethnicity
- Hispanic / Latino 82% Two or more races 26% Black 9% White 4% Asian 3% Native American 2%
- Hispanic origin (detail)
- Mexican 71%
- Foreign-born
- 36% · Canada
- Languages at home
- 29% English-only · Spanish 67% Tagalog/Filipino 1% Other Asian/Pacific 1%
Political lean MEDSL · Los Angeles
- 2024 margin
- Solid D (+32.9) · D 64.8% · R 31.9% · Other 3.3%
- 2008→2024 swing
- -7.4pp toward R · 2008: 40.4pp · 2024: 32.9pp
- All cycles
- 2024: D+32.9 2020: D+44.2 2016: D+48.0 2012: D+40.0 2008: D+40.4
Not yet ingested
- Civics
- —
Market trends
- HPI YoY
- ▼ -459.80%
- Current HPI
- 478.1981
- Rent YoY
- ▼ -0.99%
- Metro
- Los Angeles-Long Beach-Anaheim, CA
- State GDP YoY
- ▲ 3.21%
- F500 in state
- 116
Industry mix (Fortune 500 HQ in CA)
| Industry | F500 HQs | Revenue |
|---|---|---|
| Technology | 27 | $1,492B |
|
||
| Financial Services | 3 | $174B |
|
||
| Retail | 3 | $44B |
|
||
| Insurance | 3 | $26B |
|
||
| Media / Entertainment | 2 | $115B |
|
||
| Pharmaceuticals / Biotech | 2 | $62B |
|
||
Price history
-5.3% since first listed8 events — show timeline
- 2026-03-25 Listed $179,900 CRMLS
- 2025-10-31 Listing Removed — CRMLS
- 2025-08-01 Listed $179,900 CRMLS
- 2025-05-17 Listing Removed — CRMLS
- 2025-04-14 Price Changed $179,000 CRMLS
- 2025-03-12 Relisted — CRMLS
- 2025-02-01 Listed $189,900 CRMLS
- 2025-01-30 Coming Soon — CRMLS
Property tax history
+7.1%/yrLatest (2025): $317 · +7.1% YoY. Source: county tax records.
Cash-flow waterfall
monthlySold comps — $/sqft
last 12 mo · ≤1 miLoading sold comps…