4109 Appaloosa Dr · Mercedes, TX
Flood risk 1/10 · Minimal
- FEMA flood zone
- X (shaded)
- Chance of flooding over 30 yrs
- 0.0%
- Est. flood insurance / yr
- $507 – $1,088
Fire risk 2/10 · Minimal
- Est. fire insurance / yr
- $1,222 – $2,270
Heat risk 9/10 · Severe
- Hot days now (above 111°F)
- 7 days/yr
- Hot days in 30 yrs
- 25 days/yr
Wind risk 9/10 · Severe
- Chance of severe wind over 30 yrs
- 99.0%
Air-quality risk 1/10 · Minimal
- Unhealthy air days now
- 0 days/yr
- Unhealthy air days in 30 yrs
- 0 days/yr
Risk factors via First Street. Map © Google.
Why this score? — see what drove the D- grade
The composite is a weighted blend of 9 inputs, each scored 0–100. Each bar is that input's sub-score; the figure is the points it added to the 100-point composite (weight × sub-score).
- ARV discount +11.2/15.0
- Appreciation +7.3/10.0
- Cash flow +6.9/30.0
- Livability +3.4/5.0
- Rent growth +2.5/5.0
- Condition / age +2.5/5.0
- 1% rule +1.9/10.0
- Schools +1.3/10.0
- DSCR +1.1/10.0
$179,990
🖨 Deal sheet 📄 Offer letter ✓ Due diligence
Listing remarks
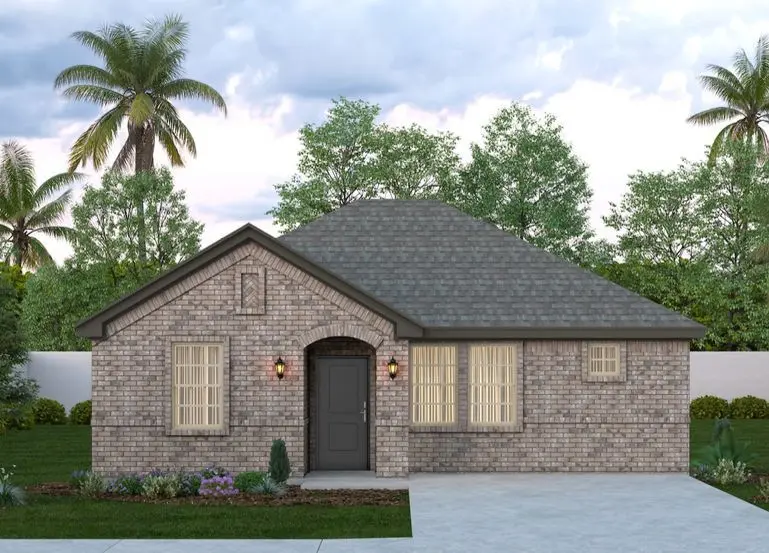
Meet the charming Kestrel home, where smart design meets everyday comfort. This thoughtfully designed single-story floor plan offers a beautiful layout that feels open, inviting, and easy to live in. With 3 bedrooms and 2 bathrooms, the home offers plenty of space for a growing family. Enjoy a bright, open-concept living space that seamlessly connects the kitchen, dining, and living areas, perfect for both relaxing and entertaining. The kitchen features painted maple wood cabinets, sleek quartz countertops, and a 3-Piece GE stainless steel appliance package. Tile flooring runs throughout the home, offering both durability and style. Quartz Countertops Maple Wood Painted Cabinets GE 3-Piece
Key facts
- Quartz countertops
- Tile flooring
- 3,963 sq ft lot
Tags
Property features AI
Finance
- Financial info: List price $179,990
Exterior
- Home design: Single-family residence (Kestrel plan)
- Construction: Living area approximately 1101
- Exterior features: Address: 4109 Appaloosa Dr, Mercedes, TX 78570
Interior
- Bedrooms: 3 bedrooms
- Bathrooms: 2 bathrooms
- Interior features: Spec home (Kestrel plan)
Neighborhood map
What this means for you Summary
Snapshot
- This is a 3-bed/2.0-bath single-family listed at $180k.
Deal economics
- At list price, monthly cash flow is $-269 ($-3k/yr) — negative.
- To cash-flow at today's rent, offer at most $141k (21.6% below list).
- To meet the 1% rule (rent ≥ 1% of price), the offer needs to be $123k (31.4% below list).
- Recommended offer: $123k (31.4% below list) — sets the bar for 1% rule.
- Cap rate 4.5% vs local median 3.3% in Mercedes — top-decile yield for the area; either an underpriced asset or a hidden risk that comps aren't pricing in. Stress-test before assuming the spread holds.
Location & tenants
- Location reads 67/100 on livability (#547 in TX) — a middle-class / working-renter tenant base. Strengths: cost of living A+, housing A+, health & safety A+; Watch: schools D+, crime F, amenities F.
- Mercedes ISD (suburban): math 12% / reading 21% proficiency, ranked #811 of 826 in TX (top 98%) — low school quality limits family demand, transient renter base, plan for 1-2y turnover; 80% free/reduced lunch — lower-income household profile, screen leases tightly.
- Market conditions: 390 active listings in the ZIP; 7,378 units permitted in Hidalgo County in 2024 (641 in 5+ unit buildings).
Forward outlook
- In year one you build about $9k of equity ($1k loan paydown + $8k appreciation (4.5% local appreciation)).
- Hidalgo County population projected at +28% by 2050 — long-run rental-demand tailwind backs the buy-and-hold thesis.
- By year 4, paydown + projected appreciation supports a ~$32k cash-out refi (75% LTV) — recoverable capital for the next deal without selling this one.
Negotiation context
- It's been on market 33 days — a 3% lower offer ($175k) is reasonable based on typical stale-listing flexibility.
Risks & watch-outs
- Climate carrying-cost: severe wind risk, 99% chance of damaging wind over 30y; extreme-heat days projected 7→25/yr by 2055 (HVAC capex compounding) — expect insurance premiums to compound above CPI over the hold.
Questions for the listing agent
- What do current leases actually rent for vs. the listed asking? Can we see a recent rent roll and the last 12 months of T-12 income?
- It's been on market 33 days. Have you received any prior offers? Is the seller open to a 31% concession, seller financing, or rate buy-down credit?
- Is there a deadline driving the sale (1031 exchange, divorce, estate, relocation)? That informs how much negotiation room exists.
- Schools are D-rated, which usually means shorter tenancies and higher turnover. Who's the typical renter profile here, and what's been the actual vacancy rate?
- Crime grade is F in this area — have there been break-ins, vandalism, or insurance claims at this property in the last 3 years? What carrier currently insures it and at what premium?
- The area grade is low — what's the realistic commute time and amenity access for the typical tenant pool here? Any planned neighborhood developments (good or bad) we should know about?
- What's the average days-on-market for RENTAL listings here right now (not sales)? A rising rental-DOM trend means longer vacancies and softer asking-rent achievability than the comps imply.
- What's the recent tenant-quality profile in this submarket — average credit score on applications, eviction rate, late-payment / NSF rate, and stable-employment percentage? A property-management company in the area should have these aggregated.
- How much new for-sale + rental construction is in the pipeline within 1–3 miles? Heavy new supply typically softens prices + rents 12–24 months out; constrained supply supports both.
Investment metrics
- 1% rule
- 0.69% ✗
- Cap rate
- 4.50%
- Cash-on-cash
- -6.41%
- DSCR
- 0.71
- GRM
- 12.2
CMA / ARV
- ARV (median comp)
- $196,131
- List price
- $179,990
- Delta
- -8.23%
- Verdict
- FAIR
- Comps
- 5 within 1.0 mi
Projected returns pro-forma
4.53% appreciation · 3.0% rent growth · sell at horizon
- IRR
- 6.2%
- Equity multiple
- 1.39×
- Total profit
- $19,527
- Equity at exit
- $96,852
- IRR
- 8.5%
- Equity multiple
- 2.51×
- Total profit
- $76,333
- Equity at exit
- $163,046
Cash invested: $50,397 (down + closing). Projections, not guarantees.
Landlord ↔ Tenant lean methodology
- Overall (STATE)
- 87 Strongly Landlord-Friendly
- State Texas
- 87 Strongly Landlord-Friendly · R+5
- County
- — inherits STATE
- City
- — inherits STATE
ZIP-level market 78570
- Home prices YoY
- 1.9%
- Active inventory
- 390
- Price-to-rent
- 12.2×
Monthly cashflow live
- Estimated rent
- $1,234 medium interval (Pro) →
- Mortgage (P&I)
- −$944
- Tax est. 1.5%
- −$225 /mo · $2,700/yr
- Insurance
- −$75
- HOA
- −$0
- Vacancy / Maint / Mgmt
- −$259
- Net cashflow
- $-269
Break-even live
UW: 25.0% down · 7.5% · 30yr · 1.5% tax · 5.0% vac · 8.0% maint · 8.0% mgmt
Financing live
Cash to close
- Down payment
- $44,998
- Closing costs
- $5,400
- Reserves months
- —
- Total cash needed
- —
Loan-product check · same deal, 3 products live
Conventional
25% down · 7.5% · 30yr
- Down + closing
- —
- Monthly P&I
- —
- Monthly cashflow
- —
- DSCR
- —
- Eligible?
- —
Personal DTI + credit; lowest rate.
DSCR
20% down · 8.5% · 30yr
- Down + closing
- —
- Monthly P&I
- —
- Monthly cashflow
- —
- DSCR
- —
- Eligible?
- —
No personal income docs; deal must DSCR.
Hard money
10% down · 12.0% · 12mo
- Down + closing
- —
- Monthly P&I
- —
- Monthly cashflow
- —
- DSCR
- —
- Eligible?
- —
Short-term bridge; refi at stabilization.
Listing history 16 events
-
2026-06-18days on market $179,990 Active 33 DOM
-
2026-06-17days on market $179,990 Active 32 DOM
-
2026-06-16days on market $179,990 Active 31 DOM
-
2026-06-15days on market $179,990 Active 30 DOM
-
2026-06-15days on market $179,990 Active 29 DOM
-
2026-06-13days on market $179,990 Active 28 DOM
-
2026-06-12days on market $179,990 Active 27 DOM
-
2026-06-10days on market $179,990 Active 24 DOM
-
2026-06-08days on market $179,990 Active 23 DOM
-
2026-06-08days on market $179,990 Active 22 DOM
-
2026-06-07days on market $179,990 Active 21 DOM
-
2026-06-03days on market $179,990 Active 18 DOM
-
2026-06-02days on market $179,990 Active 17 DOM
-
2026-06-01days on market $179,990 Active 16 DOM
-
2026-05-31days on market $179,990 Active 15 DOM
-
2026-05-16$179,990 Active 799-char remark
ⓘ Source: listings_history table (triggers on properties + properties_extension) + one-shot
backfill from property_details.listing_events for pre-trigger history.
Climate risk First Street
- Flood 1/10 Low FEMA zone X (shaded) · 0% chance over 30 yrs
- Wildfire 2/10 Low
- Heat 9/10 Extreme 7 d/yr ≥111°F today · 25 d/yr by 30 yrs out
- Wind 9/10 Extreme 99% chance of damaging wind over 30 yrs
- Air quality 1/10 Low 0 unhealthy d/yr today · 0 by 30 yrs out
Nearby sold comps map
Loading sold comps map…
Walkable amenities ~0.75 mi
Loading nearby amenities…
Taxation est. · year 1
- Rental income
- $14,806
- − Mortgage interest
- −$10,082
- − Property taxes
- −$2,700
- − Insurance
- −$900
- − Repairs & maintenance
- −$1,185
- − Management
- −$1,185
- − Depreciation
- −$5,236
- Taxable loss
- −$6,481
- Est. tax savings @ 24.0%
- +$1,555
- After-tax cash flow
- $-1,674/yr
For passive investors: Depreciation is non-cash, so a rental often shows a tax loss while cash-flowing — sheltering income. Rental losses are passive: they offset passive income freely, and up to $25,000/yr can offset ordinary (W-2) income if you actively participate and your MAGI is under $100k (phasing out to $0 by $150k); unused losses carry forward. On sale, claimed depreciation is recaptured at up to 25%, and gains may owe capital-gains tax (a 1031 exchange can defer both). Figures are a year-1 estimate at your 24.0% rate — not tax advice; consult a CPA.
Schools (NCES district)
- District
- Mercedes ISD
- NCES district ID
- 4830250
- Math proficiency
- 12% ▼ -26.00%
- Reading proficiency
- 21% ▼ -10.00%
- Median HH income
- $27,606
- Composite
- 12.84/100
- National rank
- #9596
- State rank
- #811 of 826 in TX
Livability — Mercedes
- Score
- 67/100
- State rank
- #547
- US rank
- #10619
Category grades
Schools grade is shown separately in the Schools card above.
Census & demographics
- City population
- 33,596
- Population (ZIP)
- 33,596
Population outlook (Hidalgo County) Hauer SSP2
- Today (2025)
- 955,232 people
- By 2030
- 1,009,774 · +5.7%
- By 2040
- 1,120,332 · +17.3%
- By 2050
- 1,225,036 · +28.2%
- By 2075
- 1,439,189 · +50.7%
- By 2100
- 1,533,429 · +60.5%
Race, ethnicity, and origin ACS 2023
- Neighborhood character
- Predominantly Hispanic (96%)
- Race & ethnicity
- Hispanic / Latino 96% Two or more races 44% White 4%
- Hispanic origin (detail)
- Mexican 91%
- Foreign-born
- 20% · Canada
- Languages at home
- 18% English-only · Spanish 82%
Political lean MEDSL · Hidalgo
- 2024 margin
- Toss-up / Even · D 48.1% · R 51.0%
- 2008→2024 swing
- -41.6pp toward R · 2008: 38.7pp · 2024: -2.9pp
- All cycles
- 2024: R+2.9 2020: D+17.1 2016: D+40.5 2012: D+41.8 2008: D+38.7
Not yet ingested
- Civics
- —
Market trends
- HPI YoY
- ▲ 4.53%
- Current HPI
- 238.8386
- Rent YoY
- —
- Metro
- —
- State GDP YoY
- ▲ 3.95%
- F500 in state
- 110
Industry mix (Fortune 500 HQ in TX)
| Industry | F500 HQs | Revenue |
|---|---|---|
| Energy | 16 | $1,198B |
|
||
| Technology | 5 | $198B |
|
||
| Engineering / Construction | 4 | $72B |
|
||
| Energy Services | 3 | $60B |
|
||
| Utilities | 3 | $41B |
|
||
| Healthcare | 2 | $330B |
|
||
Cash-flow waterfall
monthlySold comps — $/sqft
last 12 mo · ≤1 miLoading sold comps…