 5-Plex
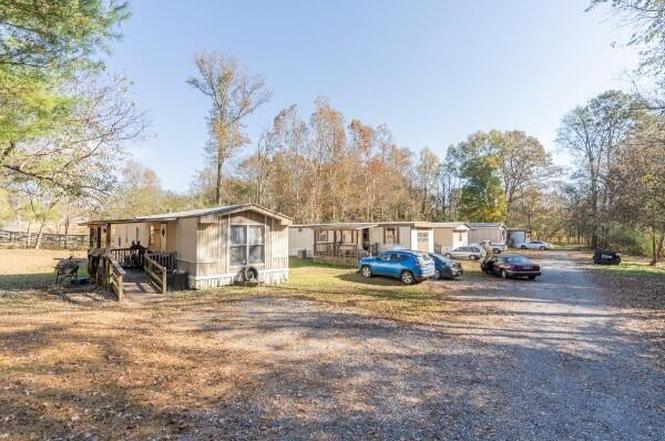
434 N Pine St · Whitwell, TN
Flood risk 9/10 · Severe
- FEMA flood zone
- A
- Chance of flooding over 30 yrs
- 0.99%
- Est. flood insurance / yr
- $1,009 – $1,996
Fire risk 5/10 · Moderate
- Est. fire insurance / yr
- $949 – $1,763
Heat risk 5/10 · Moderate
- Hot days now (above 105°F)
- 8 days/yr
- Hot days in 30 yrs
- 23 days/yr
Wind risk 4/10 · Minor
- Chance of severe wind over 30 yrs
- 10.0%
Air-quality risk 3/10 · Minor
- Unhealthy air days now
- 2 days/yr
- Unhealthy air days in 30 yrs
- 2 days/yr
Risk factors via First Street. Map © Google.
Why this score? — see what drove the B grade
The composite is a weighted blend of 9 inputs, each scored 0–100. Each bar is that input's sub-score; the figure is the points it added to the 100-point composite (weight × sub-score).
- Cash flow +30.0/30.0
- 1% rule +10.0/10.0
- DSCR +10.0/10.0
- ARV discount +7.5/15.0
- Appreciation +7.4/10.0
- Livability +2.8/5.0
- Rent growth +2.5/5.0
- Condition / age +2.5/5.0
- Schools +2.1/10.0
$299,000
🖨 Deal sheet 📄 Offer letter ✓ Due diligence
Multi-family units
County records classify this as Multi-Family (5+ Unit). Listing-text estimate: 5 units. confirmed
5+ unit building — per-unit beds/baths from public records are typically unavailable; the breakdown below (if shown) is an estimate from the listing text.
Listing remarks MLS
This 5-unit trailer park presents a strong value-add investment opportunity with significant upside potential. Currently, four units are occupied and generating $3,100 per month in gross income ($37,200 annually), while one unit is vacant and ready for renovation and lease-up. Market rents for similar units are approximately $850 per month, bringing the stabilized gross income potential to $4,250 per month, or $51,000 annually. Each unit has a separate electric meter, with tenants responsible for their own electricity. Water is on a single master meter and paid by the landlord, averaging approximately $180 per month. Additional operating expenses run about $350 per month. This property offers a clear path to increased cash flow through renovating the vacant units and adjusting rents to market levels. Drive-by viewings are welcome; however, please do not disturb current tenants. The seller will also provide vendor and service contacts to ensure a smooth transition for the new owner. SQFT total is total combined estimate of all 5 units. Exact age of the homes are unknown but site pads were built in 1996 according to records. Buyer/agent to verify any information they deem important. Property does require flood insurance.
Key facts
- Built 1996
- Listed 115 days
Property features AI
Finance
- Financial info: Five total units; Owner pays: trash collection and water; Tenants pay: electricity
Exterior
- Parking: Detached parking (gravel)
- Utilities: Public water available; Septic tank sewer; Electricity available; Water available
- Home design: Residential income property; Three or more levels
- Construction: Metal roof; Other construction materials; Existing building
- Exterior features: Gravel parking area
Interior
- Bedrooms: Five 2-bedroom units
- Flooring: Other
- Bathrooms: Each 2-bedroom unit has 1 bathroom
- Heating & cooling: Electric heating; Electric cooling
- Interior features: Other flooring
Neighborhood map
What this means for you Summary
Snapshot
- This is a 5 × 8-bed/4.0-bath units multifamily listed at $299k.
Deal economics
- At list price, monthly cash flow is $2k ($21k/yr) — positive. Per door: $345/mo.
- The deal already cash-flows at list — no discount required.
- Meets the 1% rule at list price ($5k rent vs $299k).
- Recommended offer: $272k (9.0% below list) — sets the bar for market timing.
- Cap rate 13.7% vs local median 2.9% in Whitwell — top-decile yield for the area; either an underpriced asset or a hidden risk that comps aren't pricing in. Stress-test before assuming the spread holds.
Location & tenants
- Location reads 56/100 on livability (#346 in TN) — a working-class tenant base; expect higher turnover. Strengths: cost of living A+, housing A+, crime B; Watch: amenities F, commute F, health & safety F.
- Marion County (town): math 24% / reading 25% proficiency, ranked #89 of 139 in TN (top 64%) — low school quality limits family demand, transient renter base, plan for 1-2y turnover.
- Zoned schools: Whitwell Elementary (math 47% / reading 37%, grade F, #191 of 952 statewide, top 22%, 492 students, 0% FRL); Whitwell High School (math 12% / reading 32%, grade F, #163 of 332 statewide, top 51%, 343 students, 0% FRL) — zoned schools average 0% FRL vs 57% district-wide (57 pts lower); this property's tenant base skews higher-income than the district average.
- Market conditions: 80 active listings in the ZIP; 225 units permitted in Marion County in 2024 (0 in 5+ unit buildings).
Forward outlook
- In year one you build about $17k of equity ($2k loan paydown + $14k appreciation (4.8% local appreciation)).
- At projected returns (4.8% appreciation + 3.0% rent growth), your $84k cash investment doubles in ~3 years — after that, you're playing with house money.
- By year 3, paydown + projected appreciation supports a ~$41k cash-out refi (75% LTV) — recoverable capital for the next deal without selling this one.
Negotiation context
- It's been on market 115 days — a 9% lower offer ($272k) is reasonable based on typical stale-listing flexibility.
- 7 sale attempts since 21y ago with the ask held roughly flat each time — persistent listings suggest the price (not the market) is what's stuck; bring a comps-based counter.
Risks & watch-outs
- Watch-outs: flood insurance adds $125/mo.
- Climate carrying-cost: in FEMA flood zone A (mandatory federal flood insurance); moderate wildfire risk; extreme-heat days projected 8→23/yr by 2055 (HVAC capex compounding) — expect insurance premiums to compound above CPI over the hold.
Questions for the listing agent
- It's been on market 115 days. Have you received any prior offers? Is the seller open to a 9% concession, seller financing, or rate buy-down credit?
- Can we see the unit-by-unit rent roll, current vacancy, and any below-market leases? What's the average tenancy length?
- What capital expenditures (roof, boiler, parking lot, exteriors) have been made in the last 5 years, and what's planned in the next 2?
- What's the actual annual flood-insurance premium (NFIP or private), and is the property in a SFHA with mandatory coverage?
- Why hasn't it sold? Are there any deal-killer items the seller is aware of (foundation, flood, title, zoning, code violations)?
- Is there a deadline driving the sale (1031 exchange, divorce, estate, relocation)? That informs how much negotiation room exists.
- Schools are F-rated, which usually means shorter tenancies and higher turnover. Who's the typical renter profile here, and what's been the actual vacancy rate?
- What's the average days-on-market for RENTAL listings here right now (not sales)? A rising rental-DOM trend means longer vacancies and softer asking-rent achievability than the comps imply.
- What's the recent tenant-quality profile in this submarket — average credit score on applications, eviction rate, late-payment / NSF rate, and stable-employment percentage? A property-management company in the area should have these aggregated.
- How much new apartment / multifamily construction is in the pipeline within 1–3 miles? Heavy new supply (>2% of stock underway) typically softens rents 12–24 months out; light construction supports rent growth.
Investment metrics
- 1% rule
- 1.66% ✓
- Cap rate
- 13.72%
- Cash-on-cash
- 26.52%
- DSCR
- 2.18
- GRM
- 5.0
CMA / ARV
No comps found within radius.
Projected returns pro-forma
4.83% appreciation · 3.0% rent growth · sell at horizon
- IRR
- 34.2%
- Equity multiple
- 3.10×
- Total profit
- $176,110
- Equity at exit
- $166,416
- IRR
- 32.7%
- Equity multiple
- 6.24×
- Total profit
- $439,095
- Equity at exit
- $284,743
Cash invested: $83,720 (down + closing). Projections, not guarantees.
Landlord ↔ Tenant lean methodology
- Overall (STATE)
- 87 Strongly Landlord-Friendly
- State Tennessee
- 87 Strongly Landlord-Friendly · R+13
- County
- — inherits STATE
- City
- — inherits STATE
ZIP-level market 37397
- Home prices YoY
- 1.6%
- Active inventory
- 80
- Price-to-rent
- 25.1×
Monthly cashflow live
- Estimated rent
- $4,958 medium interval (Pro) →
- Mortgage (P&I)
- −$1,568
- Tax est. 1.5%
- −$374 /mo · $4,485/yr
- Insurance
- −$125
- Flood insurance flood zone
- −$125 /mo · $1,502/yr
- HOA
- −$0
- Vacancy / Maint / Mgmt
- −$1,041
- Net cashflow
- $1,725
Break-even live
5-unit breakdown (identical units grouped — click to expand)
| Units | Beds | Baths | Est. rent |
|---|---|---|---|
| 5× units | 8 | 4 | $4,960 |
| #1 | 8 | 4 | $992 |
| #2 | 8 | 4 | $992 |
| #3 | 8 | 4 | $992 |
| #4 | 8 | 4 | $992 |
| #5 | 8 | 4 | $992 |
| Total (5 units) | $4,958 | ||
UW: 25.0% down · 7.5% · 30yr · 1.5% tax · 5.0% vac · 8.0% maint · 8.0% mgmt
Financing live
Cash to close
- Down payment
- $74,750
- Closing costs
- $8,970
- Reserves months
- —
- Total cash needed
- —
Loan-product check · same deal, 3 products live
Conventional
25% down · 7.5% · 30yr
- Down + closing
- —
- Monthly P&I
- —
- Monthly cashflow
- —
- DSCR
- —
- Eligible?
- —
Personal DTI + credit; lowest rate.
DSCR
20% down · 8.5% · 30yr
- Down + closing
- —
- Monthly P&I
- —
- Monthly cashflow
- —
- DSCR
- —
- Eligible?
- —
No personal income docs; deal must DSCR.
Hard money
10% down · 12.0% · 12mo
- Down + closing
- —
- Monthly P&I
- —
- Monthly cashflow
- —
- DSCR
- —
- Eligible?
- —
Short-term bridge; refi at stabilization.
Listing history 30 events
-
2026-06-18days on market $299,000 Active 115 DOM
-
2026-06-17days on market $299,000 Active 114 DOM
-
2026-06-16days on market $299,000 Active 113 DOM
-
2026-06-15days on market $299,000 Active 112 DOM
-
2026-06-14days on market $299,000 Active 110 DOM
-
2026-06-13days on market $299,000 Active 109 DOM
-
2026-06-10days on market $299,000 Active 107 DOM
-
2026-06-09days on market $299,000 Active 106 DOM
-
2026-06-08days on market $299,000 Active 105 DOM
-
2026-06-07days on market $299,000 Active 104 DOM
-
2026-06-05days on market $299,000 Active 101 DOM
-
2026-06-03days on market $299,000 Active 100 DOM
-
2026-06-02days on market $299,000 Active 99 DOM
-
2026-06-01days on market $299,000 Active 98 DOM
-
2026-05-31days on market $299,000 Active 97 DOM
-
2026-05-30days on market $299,000 Active 96 DOM
-
2026-02-24$299,000 Active
-
2026-02-23$299,000 Active 1238-char remark
Show marketing remark (1238 chars)
This 5-unit trailer park presents a strong value-add investment opportunity with significant upside potential. Currently, four units are occupied and generating $3,100 per month in gross income ($37,200 annually), while one unit is vacant and ready for renovation and lease-up. Market rents for similar units are approximately $850 per month, bringing the stabilized gross income potential to $4,250 per month, or $51,000 annually. Each unit has a separate electric meter, with tenants responsible for their own electricity. Water is on a single master meter and paid by the landlord, averaging approximately $180 per month. Additional operating expenses run about $350 per month. This property offers a clear path to increased cash flow through renovating the vacant units and adjusting rents to market levels. Drive-by viewings are welcome; however, please do not disturb current tenants. The seller will also provide vendor and service contacts to ensure a smooth transition for the new owner. SQFT total is total combined estimate of all 5 units. Exact age of the homes are unknown but site pads were built in 1996 according to records. Buyer/agent to verify any information they deem important. Property does require flood insurance.
-
2025-04-14historical
-
2024-08-27$269,900 Active
-
2024-07-26historical
-
2024-04-15status Active
-
2024-03-28historical Active Under Contract
-
2024-03-26price $229,000
-
2024-03-05price $234,900
-
2024-03-01price $237,900
-
2024-02-16$239,900 Active
-
2023-12-12historical
-
2023-11-17Active
-
2005-11-11$55,000
ⓘ Source: listings_history table (triggers on properties + properties_extension) + one-shot
backfill from property_details.listing_events for pre-trigger history.
Climate risk First Street
- Flood 9/10 Extreme FEMA zone A · 99% chance over 30 yrs
- Wildfire 5/10 Major
- Heat 5/10 Major 8 d/yr ≥105°F today · 23 d/yr by 30 yrs out
- Wind 4/10 Moderate 10% chance of damaging wind over 30 yrs
- Air quality 3/10 Moderate 2 unhealthy d/yr today · 2 by 30 yrs out
Nearby sold comps map
Loading sold comps map…
Walkable amenities ~0.75 mi
Loading nearby amenities…
Taxation est. · year 1
- Rental income
- $59,496
- − Mortgage interest
- −$16,749
- − Property taxes
- −$4,485
- − Insurance
- −$2,998
- − Repairs & maintenance
- −$4,760
- − Management
- −$4,760
- − Depreciation
- −$8,698
- Taxable income
- $17,047
- Est. tax owed @ 24.0%
- −$4,091
- After-tax cash flow
- $16,612/yr
For passive investors: Depreciation is non-cash, so a rental often shows a tax loss while cash-flowing — sheltering income. Rental losses are passive: they offset passive income freely, and up to $25,000/yr can offset ordinary (W-2) income if you actively participate and your MAGI is under $100k (phasing out to $0 by $150k); unused losses carry forward. On sale, claimed depreciation is recaptured at up to 25%, and gains may owe capital-gains tax (a 1031 exchange can defer both). Figures are a year-1 estimate at your 24.0% rate — not tax advice; consult a CPA.
Schools (NCES district)
- District
- Marion County
- NCES district ID
- 4702640
- Math proficiency
- 24% ▼ -2.00%
- Reading proficiency
- 25% ▼ -3.00%
- Median HH income
- $41,941
- Composite
- 20.88/100
- National rank
- #8494
- State rank
- #89 of 139 in TN
Livability — Whitwell
- Score
- 56/100
- State rank
- #346
- US rank
- #22851
Category grades
Schools grade is shown separately in the Schools card above.
Census & demographics
- Census place
- Whitwell, TN
- City population
- 10,044
- Population (ZIP)
- 10,044
Population outlook (Marion County) Hauer SSP2
- Today (2025)
- 28,889 people
- By 2030
- 28,915 · +0.1%
- By 2040
- 28,662 · -0.8%
- By 2050
- 28,053 · -2.9%
- By 2075
- 26,855 · -7.0%
- By 2100
- 24,404 · -15.5%
Race, ethnicity, and origin ACS 2023
- Neighborhood character
- Predominantly White (94%)
- Race & ethnicity
- White 94% Two or more races 3% Hispanic / Latino 2% Black 1%
- Common ancestry
- Serbian 2% Lithuanian 1% Slovak 1%
- Foreign-born
- 1% · Canada
- Languages at home
- 99% English-only · Spanish 1%
Political lean MEDSL · Marion
- 2024 margin
- Solid R (+55.7) · D 21.7% · R 77.4%
- 2008→2024 swing
- -34.3pp toward R · 2008: -21.4pp · 2024: -55.7pp
- All cycles
- 2024: R+55.7 2020: R+50.8 2016: R+44.8 2012: R+22.3 2008: R+21.4
Not yet ingested
- Civics
- —
Market trends
- HPI YoY
- ▲ 4.83%
- Current HPI
- 307.3072
- Rent YoY
- —
- Metro
- —
- State GDP YoY
- ▲ 2.78%
- F500 in state
- 22
Industry mix (Fortune 500 HQ in TN)
| Industry | F500 HQs | Revenue |
|---|---|---|
| Healthcare | 3 | $91B |
|
||
| Retail | 3 | $72B |
|
||
| Transportation / Logistics | 1 | $88B |
|
||
| Paper / Packaging | 1 | $19B |
|
||
| Insurance | 1 | $13B |
|
||
| Energy | 1 | $12B |
|
||
Price history
+443.6% since first listed14 events — show timeline
- 2026-02-24 Listed $299,000 REALTRACS as Distributed by MLS Grid
- 2026-02-23 Listed $299,000 GCAR
- 2025-04-14 Listing Removed — REALTRACS as Distributed by MLS Grid
- 2024-08-27 Listed $269,900 REALTRACS as Distributed by MLS Grid
- 2024-07-26 Listing Removed — REALTRACS as Distributed by MLS Grid
- 2024-04-15 Relisted — REALTRACS as Distributed by MLS Grid
- 2024-03-28 Contingent — REALTRACS as Distributed by MLS Grid
- 2024-03-26 Price Changed $229,000 REALTRACS as Distributed by MLS Grid
- 2024-03-05 Price Changed $234,900 REALTRACS as Distributed by MLS Grid
- 2024-03-01 Price Changed $237,900 REALTRACS as Distributed by MLS Grid
- 2024-02-16 Listed $239,900 REALTRACS as Distributed by MLS Grid
- 2023-12-12 Listing Removed — REALTRACS as Distributed by MLS Grid
- 2023-11-17 Listed — REALTRACS as Distributed by MLS Grid
- 2005-11-11 Listed $55,000 RCAOR
Cash-flow waterfall
monthlySold comps — $/sqft
last 12 mo · ≤1 miLoading sold comps…