 Multi-family
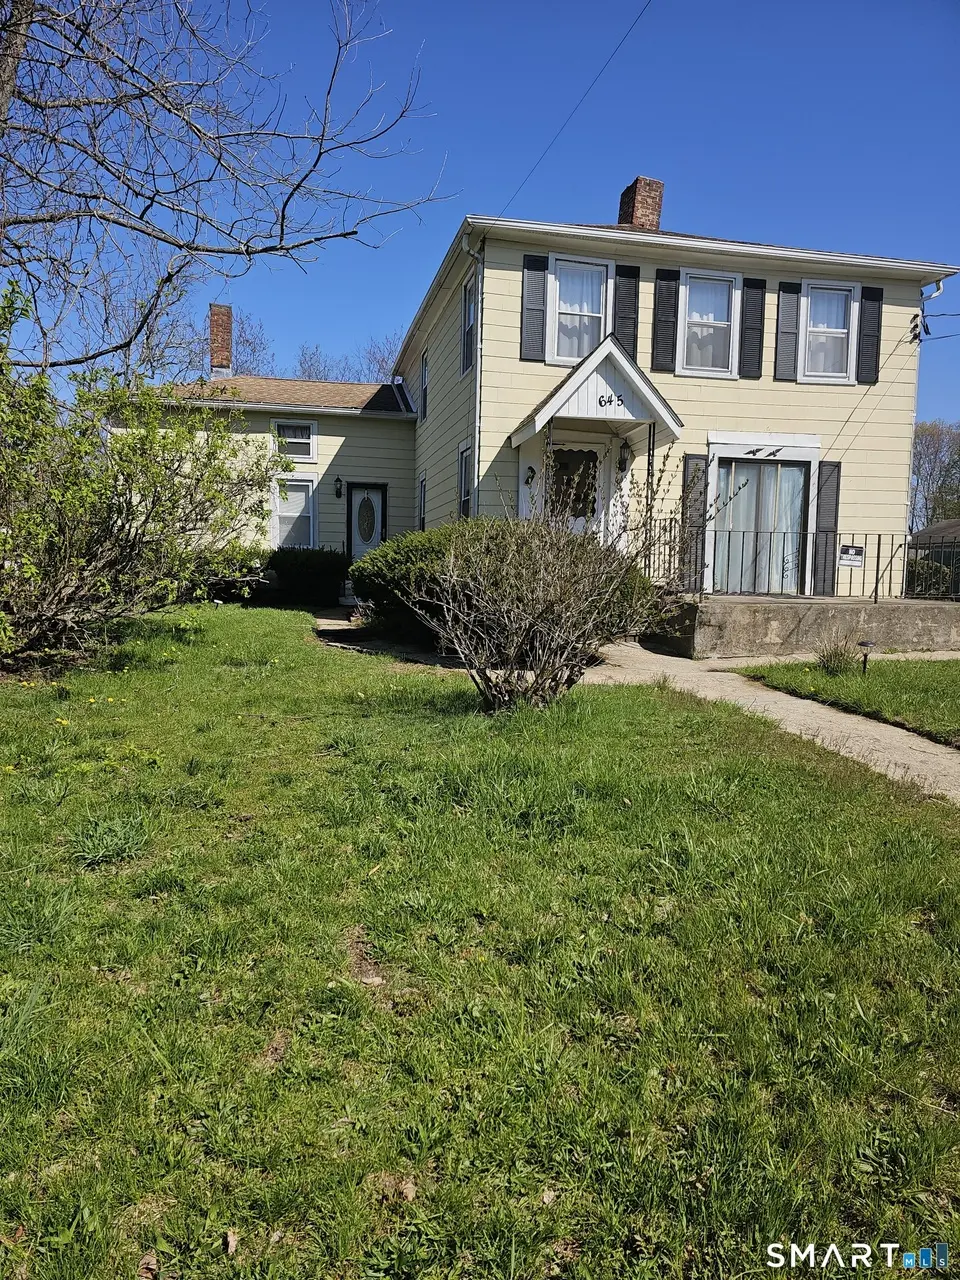
645 Silver Sands Rd · East Haven, CT
Flood risk 3/10 · Minor
- FEMA flood zone
- X (unshaded)
- Chance of flooding over 30 yrs
- 0.09%
- Est. flood insurance / yr
- $473 – $860
Fire risk 1/10 · Minimal
- Est. fire insurance / yr
- $829 – $1,539
Heat risk 6/10 · Moderate
- Hot days now (above 95°F)
- 7 days/yr
- Hot days in 30 yrs
- 16 days/yr
Wind risk 6/10 · Moderate
- Chance of severe wind over 30 yrs
- 66.0%
Air-quality risk 4/10 · Minor
- Unhealthy air days now
- 5 days/yr
- Unhealthy air days in 30 yrs
- 7 days/yr
Risk factors via First Street. Map © Google.
Why this score? — see what drove the B grade
The composite is a weighted blend of 9 inputs, each scored 0–100. Each bar is that input's sub-score; the figure is the points it added to the 100-point composite (weight × sub-score).
- Cash flow +30.0/30.0
- ARV discount +13.8/15.0
- DSCR +10.0/10.0
- 1% rule +8.2/10.0
- Livability +3.5/5.0
- Schools +2.9/10.0
- Rent growth +2.7/5.0
- Condition / age +2.5/5.0
- Appreciation +0.0/10.0
$389,000
🖨 Deal sheet (PDF) 📄 Offer letter ✓ Due diligence
Multi-family units
County records classify this as Multi-Family (2-4 Unit). Listing-text estimate: 1 unit. estimate disagrees with records
Listing remarks
Spacious historic shoreline home just a short walk to the beach. Offering generous living space and endless potential, this property is being sold as-is and is ready for your vision and updates. Historically utilized as a two-family residence. Buyers to perform their own diligence regarding ADU potential or continued multi-family use, subject to Town approvals. Conveniently located near beaches, parks, restaurants, and local amenities
Key facts
- Two-family residence
- Adu potential
- Multi-family use
Tags
Property features AI
Exterior
- Utilities: Public water connected; Public sewer in street and septic; Natural gas available
- Home design: Multi-family (2-family) property
- Construction: Frame construction with masonry foundation; Yellow exterior color
- Exterior features: Asphalt shingle roof; Asbestos siding; Lightly wooded, level lot; Walk-to-water location within a water community
Interior
- Bedrooms: Five bedrooms
- Bathrooms: Two full bathrooms
- Heating & cooling: Hot air heating fueled by natural gas; Natural gas hot water with a 30-gallon tank
- Interior features: Two fireplaces; Full, unfinished basement
Neighborhood map
What this means for you Summary
Snapshot
- This is a 4-bed/2.0-bath multifamily listed at $389k.
Deal economics
- At list price, monthly cash flow is $1k ($18k/yr) — positive.
- The deal already cash-flows at list — no discount required.
- Meets the 1% rule at list price ($5k rent vs $389k).
- Cap rate 10.9% vs local median 3.8% in East Haven — top-decile yield for the area; either an underpriced asset or a hidden risk that comps aren't pricing in. Stress-test before assuming the spread holds.
Location & tenants
- Location reads 70/100 on livability (#99 in CT) — a middle-class / working-renter tenant base. Strengths: housing A+, crime A-, health & safety B+; Watch: amenities F, commute F.
- East Haven School District (suburban): math 25% / reading 40% proficiency, ranked #118 of 153 in CT (top 77%) — families likely to look elsewhere, expect single-tenant / working-renter base with shorter leases.
- Zoned schools: Momauguin School (math 27% / reading 32%, grade F, #383 of 553 statewide, top 71%, 314 students, 63% FRL); East Haven High School (math 17% / reading 42%, grade F, #139 of 194 statewide, top 74%, 849 students, 47% FRL) — zoned schools average 55% FRL vs 36% district-wide (19 pts higher); higher-poverty schools than district average — tighter screening recommended.
- Market conditions: Rents flat; 100 active listings in the ZIP; 5 comparable units currently listed for rent nearby; rentals lingering (median 45d on market — plan ~5-8 weeks vacancy on turnover, expect pricing pressure); 60% of comp listings sitting > 30 days — soft ceiling on asking rent; solid renter incomes; 1,059 units permitted in South Central Connecticut Planning Region in 2024 (779 in 5+ unit buildings).
- At $5,137/mo this rent would consume 64% of the median local household income ($96k/yr) (locally 770% of renters already pay >50% of income on rent) — very limited rent-growth headroom before tenants either downsize or default.
Forward outlook
- Local home prices are declining (-3.0%/yr); year-one equity from $3k of loan paydown is wiped out by about $12k of value loss. Plan a longer hold.
- At projected returns (-3.0% appreciation + 0.8% rent growth), your $109k cash investment doubles in ~10 years — after that, you're playing with house money.
Negotiation context
- Only 6 days on market — expect competitive offers; lowballing is unlikely to land.
Risks & watch-outs
- Watch-outs: built in 1890 — expect roof / HVAC / electrical / plumbing capex.
- Climate carrying-cost: major wind risk, 66% chance of damaging wind over 30y; extreme-heat days projected 7→16/yr by 2055 (HVAC capex compounding) — expect insurance premiums to compound above CPI over the hold.
Questions for the listing agent
- Built in 1890 — when were the roof, HVAC, electrical panel, plumbing, and water heater last replaced?
- Is there a deadline driving the sale (1031 exchange, divorce, estate, relocation)? That informs how much negotiation room exists.
- Schools are D-rated, which usually means shorter tenancies and higher turnover. Who's the typical renter profile here, and what's been the actual vacancy rate?
- What's the average days-on-market for RENTAL listings here right now (not sales)? A rising rental-DOM trend means longer vacancies and softer asking-rent achievability than the comps imply.
- What's the recent tenant-quality profile in this submarket — average credit score on applications, eviction rate, late-payment / NSF rate, and stable-employment percentage? A property-management company in the area should have these aggregated.
- How much new apartment / multifamily construction is in the pipeline within 1–3 miles? Heavy new supply (>2% of stock underway) typically softens rents 12–24 months out; light construction supports rent growth.
Investment metrics
- 1% rule
- 1.32% ✓
- Cap rate
- 10.89%
- Cash-on-cash
- 16.40%
- DSCR
- 1.73
- GRM
- 6.3
CMA / ARV
- ARV (on-the-fly)
- $451,874
- Comps found
- 1
Show comp detail 1 sale within ~0.75 mi
| Address | Dist | Beds/Ba | Sqft | Sold | Price | $/sf | Match |
|---|---|---|---|---|---|---|---|
| 120 S End Rd | 0.54mi | 4/2.0 | 2,032 (-9%) | 16mo | $410,000 | $202 | 46 |
Match score weights: distance 35% · size 25% · config 20% · recency 20%. Top-matched comps best support the ARV.
Projected returns pro-forma
-3.0% appreciation · 0.79% rent growth · sell at horizon
- IRR
- 5.0%
- Equity multiple
- 1.19×
- Total profit
- $20,624
- Equity at exit
- $58,001
- IRR
- 12.4%
- Equity multiple
- 1.88×
- Total profit
- $96,213
- Equity at exit
- $33,634
Cash invested: $108,920 (down + closing). Projections, not guarantees.
Landlord ↔ Tenant lean methodology
- Overall (STATE)
- 27 Tenant-Leaning
- State Connecticut
- 27 Tenant-Leaning · D+7
- County
- — inherits STATE
- City
- — inherits STATE
ZIP-level market 06512
- Rents YoY
- 0.8%
- Active inventory
- 100
- Price-to-rent
- 12.6×
Monthly cashflow live
- Estimated rent
- $5,137 high interval (Pro) →
- Mortgage (P&I)
- −$2,040
- Tax from tax record
- −$367 /mo · $4,407/yr
- Insurance
- −$162
- HOA
- −$0
- Vacancy / Maint / Mgmt
- −$1,079
- Net cashflow
- $1,489
Break-even live
Sensitivity live
| Price | -10% $1,709 | -5% $1,599 | +0% $1,489 | +5% $1,379 | +10% $1,269 |
|---|---|---|---|---|---|
| Rent | -10% $1,083 | -5% $1,286 | +0% $1,489 | +5% $1,692 | +10% $1,895 |
| Rate | -1.0pp $1,685 | -0.5pp $1,588 | base $1,489 | +0.5pp $1,388 | +1.0pp $1,286 |
2-unit breakdown (identical units grouped — click to expand)
| Units | Beds | Baths | Est. rent |
|---|---|---|---|
| 2× units | 2 | 1 | $5,138 |
| #1 | 2 | 1 | $2,569 |
| #2 | 2 | 1 | $2,569 |
| Total (2 units) | $5,137 | ||
UW: 25.0% down · 7.5% · 30yr · 1.5% tax · 5.0% vac · 8.0% maint · 8.0% mgmt
Financing live
Cash to close
- Down payment
- $97,250
- Closing costs
- $11,670
- Reserves months
- —
- Total cash needed
- —
Loan-product check · same deal, 3 products live
Conventional
25% down · 7.5% · 30yr
- Down + closing
- —
- Monthly P&I
- —
- Monthly cashflow
- —
- DSCR
- —
- Eligible?
- —
Personal DTI + credit; lowest rate.
DSCR
20% down · 8.5% · 30yr
- Down + closing
- —
- Monthly P&I
- —
- Monthly cashflow
- —
- DSCR
- —
- Eligible?
- —
No personal income docs; deal must DSCR.
Hard money
10% down · 12.0% · 12mo
- Down + closing
- —
- Monthly P&I
- —
- Monthly cashflow
- —
- DSCR
- —
- Eligible?
- —
Short-term bridge; refi at stabilization.
Rent comps 5 comps
| Address | Beds | Baths | Sqft | Rent | $/sqft | DOM | Units | Dist |
|---|---|---|---|---|---|---|---|---|
| 6 1st Ave East Haven, CT | 4.0 | 3.5 | 2842 | $5,000 | $1.76 | 4d | 1 | 0.90mi |
| 116 Townsend Ave New Haven, CT | 3.0 | 1.5 | 1932 | $3,500 | $1.81 | 45d | 1 | 1.00mi |
| 25 Beecher Pl New Haven, CT | 3.0 | 1.5 | 1414 | $2,700 | $1.91 | 45d | 1 | 1.10mi |
| 420 Short Beach Rd East Haven, CT | 3.0 | 2.0 | 1500 | $2,200 | $1.47 | 45d | 1 | 1.23mi |
| 356 Townsend Ave New Haven, CT | 3.0 | 2.0 | 1572 | $3,000 | $1.91 | 4d | 1 | 1.43mi |
Listing history 8 events
-
2026-06-18days on market $389,000 Active 6 DOM
-
2026-06-17days on market $389,000 Active 5 DOM
-
2026-06-16days on market $389,000 Active 4 DOM
-
2026-06-15days on market $389,000 Active 3 DOM
-
2026-06-14remarks 438-char remark
-
2026-06-14pricestatusdays on market $389,000 Active 1 DOM
-
2026-04-30status Under Contract
-
2026-04-23$399,900 Active
ⓘ Source: listings_history table (triggers on properties + properties_extension) + one-shot
backfill from property_details.listing_events for pre-trigger history.
Tax reassessment forecast CT · Partial reset (capped growth)
- Current annual tax
- $4,407 · $367/mo
- Projected year-2 tax
- $6,366 · $530/mo
- Expected delta
- +$1,959/yr (+$163/mo · 44.4%)
ⓘ Screening estimate from a state-policy table — verify with the county assessor before closing.
Climate risk First Street
- Flood 3/10 Moderate FEMA zone X (unshaded) · 9% chance over 30 yrs
- Wildfire 1/10 Low
- Heat 6/10 Major 7 d/yr ≥95°F today · 16 d/yr by 30 yrs out
- Wind 6/10 Major 66% chance of damaging wind over 30 yrs
- Air quality 4/10 Moderate 5 unhealthy d/yr today · 7 by 30 yrs out
Nearby sold comps map
Loading sold comps map…
Walkable amenities ~0.75 mi
Loading nearby amenities…
Taxation est. · year 1
- Rental income
- $61,644
- − Mortgage interest
- −$21,790
- − Property taxes
- −$4,407
- − Insurance
- −$1,945
- − Repairs & maintenance
- −$4,932
- − Management
- −$4,932
- − Depreciation
- −$11,316
- Taxable income
- $12,323
- Est. tax owed @ 24.0%
- −$2,957
- After-tax cash flow
- $14,910/yr
For passive investors: Depreciation is non-cash, so a rental often shows a tax loss while cash-flowing — sheltering income. Rental losses are passive: they offset passive income freely, and up to $25,000/yr can offset ordinary (W-2) income if you actively participate and your MAGI is under $100k (phasing out to $0 by $150k); unused losses carry forward. On sale, claimed depreciation is recaptured at up to 25%, and gains may owe capital-gains tax (a 1031 exchange can defer both). Figures are a year-1 estimate at your 24.0% rate — not tax advice; consult a CPA.
Schools (NCES district)
- District
- East Haven School District
- NCES district ID
- 0901290
- Math proficiency
- 25% ▼ -7.00%
- Reading proficiency
- 40% ▼ -7.00%
- Median HH income
- $61,869
- Composite
- 29.35/100
- National rank
- #6534
- State rank
- #118 of 153 in CT
Livability — East Haven
- Score
- 70/100
- State rank
- #99
- US rank
- #7805
Category grades
Schools grade is shown separately in the Schools card above.
Census & demographics
- Census place
- East Haven, CT
- County
- New Haven County · 688,236 people
- City population
- 28,830
- Metro
- New Haven-Milford, CT
- Population (ZIP)
- 28,830
- Household income
- $96,146
- Rent vs Own
- Severe rent burden
- 770.0
Population outlook (South Central Connecticut County) Hauer SSP2
- By 2040
- 608,362
Race, ethnicity, and origin ACS 2023
- Neighborhood character
- Predominantly White (68%)
- Race & ethnicity
- White 68% Hispanic / Latino 19% Two or more races 9% Black 6% Asian 3%
- Hispanic origin (detail)
- Mexican 1% Puerto Rican 8%
- Common ancestry
- Romanian 5% Lithuanian 2% Russian 1%
- Foreign-born
- 12% · Canada, China, Jamaica
- Languages at home
- 81% English-only · Spanish 12% Other Indo-European 3% Other Asian/Pacific 1%
Political lean MEDSL · South Central Connecticut
- 2024 margin
- Strong D (+20.1) · D 59.0% · R 38.9% · Other 2.1%
- All cycles
- 2024: D+20.1
Not yet ingested
- Civics
- —
Market trends
- HPI YoY
- ▼ -302.63%
- Current HPI
- 302.2679
- Rent YoY
- ▲ 0.79%
- Metro
- New Haven-Milford, CT
- State GDP YoY
- ▲ 1.06%
- F500 in state
- 38
Industry mix (Fortune 500 HQ in CT)
| Industry | F500 HQs | Revenue |
|---|---|---|
| Industrial Machinery | 4 | $38B |
|
||
| Insurance | 3 | $71B |
|
||
| Financial Services | 2 | $25B |
|
||
| Transportation / Logistics | 2 | $18B |
|
||
| Healthcare | 1 | $247B |
|
||
| Telecommunications | 1 | $55B |
|
||
Price history
2 events — show timeline
- 2026-04-30 Pending — Smart MLS
- 2026-04-23 Listed $399,900 Smart MLS
Property tax history
+1.1%/yrLatest (2023): $4,407 · +0.0% YoY. Source: county tax records.
Cash-flow waterfall
monthlySold comps — $/sqft
last 12 mo · ≤1 miLoading sold comps…