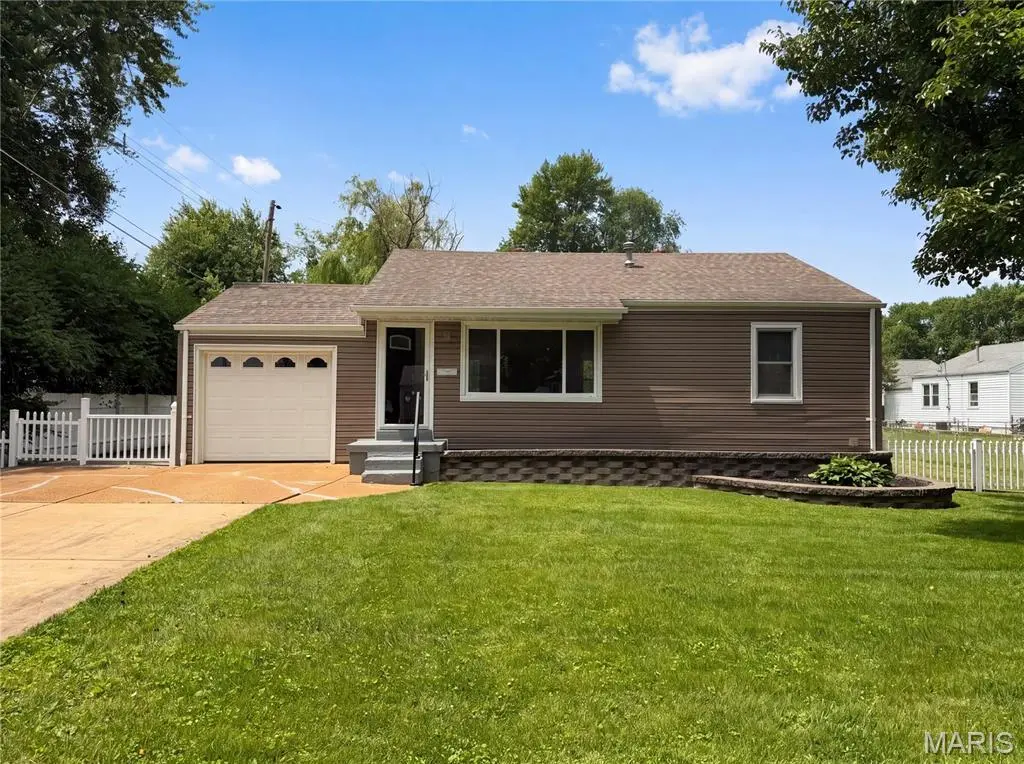
1 Winstead Pl · Florissant, MO
Flood risk 1/10 · Minimal
- FEMA flood zone
- X (unshaded)
- Chance of flooding over 30 yrs
- 0.0%
- Est. flood insurance / yr
- $473 – $860
Fire risk 1/10 · Minimal
- Est. fire insurance / yr
- $1,054 – $1,958
Heat risk 5/10 · Moderate
- Hot days now (above 105°F)
- 7 days/yr
- Hot days in 30 yrs
- 21 days/yr
Wind risk 2/10 · Minimal
- Chance of severe wind over 30 yrs
- 1.0%
Air-quality risk 3/10 · Minor
- Unhealthy air days now
- 3 days/yr
- Unhealthy air days in 30 yrs
- 5 days/yr
Risk factors via First Street. Map © Google.
Why this score? — see what drove the D+ grade
The composite is a weighted blend of 9 inputs, each scored 0–100. Each bar is that input's sub-score; the figure is the points it added to the 100-point composite (weight × sub-score).
- Cash flow +14.2/30.0
- ARV discount +10.1/15.0
- DSCR +4.3/10.0
- 1% rule +4.0/10.0
- Condition / age +3.8/5.0
- Livability +3.7/5.0
- Rent growth +3.6/5.0
- Schools +1.7/10.0
- Appreciation +0.0/10.0
$198,000
🖨 Deal sheet (PDF) 📄 Offer letter ✓ Due diligence
Listing remarks
Don't miss 1 Winstead Pl, recently updated to provide a refreshed living experience with fresh interior paint and a partial flooring replacement that enhances the entire layout. The functional patio extends the living space outdoors, connecting seamlessly to a fully fenced in backyard, suitable for various activities. A perfect blend of fresh updates and functional outdoor living. Included 100-Day Home Warranty with buyer activation
Key facts
- Functional patio
- 7,758 sq ft lot
- Garage
Tags
Property features AI
Finance
- Other: Home warranty included; Seller may consider concession
Exterior
- Parking: Detached 1-car garage
- Utilities: Public water; Public sewer; Electric service (other)
- Home design: Single-family residence; One story
- Construction: Built with other construction materials
- Exterior features: Private ownership; Lot dimensions approximately 80 x 90
Interior
- Bedrooms: 3 bedrooms (all on the main level)
- Bathrooms: 2 full bathrooms
- Heating & cooling: Forced air heating (natural gas); Electric cooling
- Interior features: Partial basement; One level
Neighborhood map
What this means for you Summary
Snapshot
- This is a 3-bed/2.0-bath single-family listed at $198k. Condition is rated good.
Deal economics
- At list price, monthly cash flow is $34 ($406/yr) — positive.
- The deal already cash-flows at list — no discount required.
- To meet the 1% rule (rent ≥ 1% of price), the offer needs to be $177k (10.4% below list).
- Recommended offer: $177k (10.4% below list) — sets the bar for 1% rule.
Location & tenants
- Location reads 73/100 on livability (#82 in MO) — a middle-class / working-renter tenant base. Strengths: cost of living A+, housing A+, health & safety B+; Watch: crime C-, amenities D+, commute F.
- Hazelwood (suburban): math 11% / reading 26% proficiency, ranked #306 of 324 in MO (top 94%) — low school quality limits family demand, transient renter base, plan for 1-2y turnover.
- Zoned schools: Mccurdy Elem. (math 12% / reading 27%, grade F, #941 of 1,115 statewide, top 86%, 329 students, 67% FRL); Northwest Middle (math 18% / reading 26%, grade F, #332 of 391 statewide, top 86%, 767 students, 62% FRL); Hazelwood West High (math 16% / reading 42%, grade F, #407 of 521 statewide, top 78%, 2,042 students, 54% FRL).
- Market conditions: Rents rising fast (+4.3%/yr); 271 active listings in the ZIP; 22 comparable units currently listed for rent nearby; rentals at typical pace (median 17d on market — plan ~3-4 weeks tenant-placement turnaround); 920 units permitted in St. Louis County in 2024 (250 in 5+ unit buildings).
- This rent runs 30% of the median local income ($71k/yr) — at the standard rent-burdened threshold; future hikes will face affordability resistance.
Forward outlook
- Local home prices are declining (-3.0%/yr); year-one equity from $1k of loan paydown is wiped out by about $6k of value loss. Plan a longer hold.
Negotiation context
- It's been on market 26 days — a 2% lower offer ($195k) is reasonable based on typical stale-listing flexibility.
Risks & watch-outs
- Watch-outs: built in 1954 — expect roof / HVAC / electrical / plumbing capex.
- Climate carrying-cost: extreme-heat days projected 7→21/yr by 2055 (HVAC capex compounding) — expect insurance premiums to compound above CPI over the hold.
Questions for the listing agent
- Built in 1954 — when were the roof, HVAC, electrical panel, plumbing, and water heater last replaced?
- Is there a deadline driving the sale (1031 exchange, divorce, estate, relocation)? That informs how much negotiation room exists.
- Schools are D-rated, which usually means shorter tenancies and higher turnover. Who's the typical renter profile here, and what's been the actual vacancy rate?
- The area grade is low — what's the realistic commute time and amenity access for the typical tenant pool here? Any planned neighborhood developments (good or bad) we should know about?
- What's the average days-on-market for RENTAL listings here right now (not sales)? A rising rental-DOM trend means longer vacancies and softer asking-rent achievability than the comps imply.
- What's the recent tenant-quality profile in this submarket — average credit score on applications, eviction rate, late-payment / NSF rate, and stable-employment percentage? A property-management company in the area should have these aggregated.
- How much new for-sale + rental construction is in the pipeline within 1–3 miles? Heavy new supply typically softens prices + rents 12–24 months out; constrained supply supports both.
Investment metrics
- 1% rule
- 0.90% ✗
- Cap rate
- 6.50%
- Cash-on-cash
- 0.73%
- DSCR
- 1.03
- GRM
- 9.3
CMA / ARV
- ARV (on-the-fly)
- $210,112
- Comps found
- 12
Show comp detail 12 sales within ~0.75 mi
| Address | Dist | Beds/Ba | Sqft | Sold | Price | $/sf | Match |
|---|---|---|---|---|---|---|---|
| 5 Manor Dr | 0.48mi | 3/2.5 | 1,588 (+1%) | 0mo | $250,000 | $157 | 74 |
| 1045 Estes Dr | 0.53mi | 3/2.0 | 1,596 (+2%) | 2mo | $220,000 | $138 | 71 |
| 17 Glynn Dr | 0.43mi | 3/2.0 | 1,509 (-4%) | 3mo | $139,900 | $93 | 71 |
| 655 Loyola Dr | 0.53mi | 3/1.0 | 1,600 (+2%) | 2mo | $184,900 | $116 | 66 |
| 1125 Florland Dr | 0.49mi | 3/3.0 | 1,482 (-6%) | 1mo | $229,900 | $155 | 63 |
| 265 Monterey Dr | 0.48mi | 2/1.0 (-1) | 1,612 (+3%) | 1mo | $167,000 | $104 | 63 |
| 39 Radford Dr | 0.55mi | 3/1.0 | 1,652 (+5%) | 2mo | $194,900 | $118 | 60 |
| 145 Ruth Dr | 0.41mi | 3/2.0 | 1,400 (-11%) | 5mo | $159,900 | $114 | 59 |
| 130 Saint Antoine St | 0.71mi | 3/2.0 | 1,492 (-5%) | 1mo | $200,000 | $134 | 58 |
| 310 Francisca Dr | 0.74mi | 3/2.0 | 1,674 (+7%) | 4mo | $230,000 | $137 | 51 |
| 1725 Gerald Ave | 0.70mi | 3/2.0 | 1,710 (+9%) | 3mo | $199,900 | $117 | 50 |
| 770 Kostka Ln | 0.75mi | 3/1.5 | 1,444 (-8%) | 1mo | $199,900 | $138 | 49 |
Match score weights: distance 35% · size 25% · config 20% · recency 20%. Top-matched comps best support the ARV.
Projected returns pro-forma
-3.0% appreciation · 4.27% rent growth · sell at horizon
- IRR
- -13.7%
- Equity multiple
- 0.50×
- Total profit
- $-27,609
- Equity at exit
- $29,522
- IRR
- -2.9%
- Equity multiple
- 0.79×
- Total profit
- $-11,489
- Equity at exit
- $17,119
Cash invested: $55,440 (down + closing). Projections, not guarantees.
Landlord ↔ Tenant lean methodology
- Overall (STATE)
- 81 Strongly Landlord-Friendly
- State Missouri
- 81 Strongly Landlord-Friendly · R+10
- County
- — inherits STATE
- City
- — inherits STATE
ZIP-level market 63031
- Rents YoY
- 4.3%
- Active inventory
- 271
- Price-to-rent
- 9.3×
Monthly cashflow live
- Estimated rent
- $1,775 high interval (Pro) →
- Mortgage (P&I)
- −$1,038
- Tax est. 1.5%
- −$248 /mo · $2,970/yr
- Insurance
- −$82
- HOA
- −$0
- Vacancy / Maint / Mgmt
- −$373
- Net cashflow
- $34
Break-even live
Sensitivity live
| Price | -10% $171 | -5% $102 | +0% $34 | +5% $-35 | +10% $-103 |
|---|---|---|---|---|---|
| Rent | -10% $-106 | -5% $-36 | +0% $34 | +5% $104 | +10% $174 |
| Rate | -1.0pp $134 | -0.5pp $84 | base $34 | +0.5pp $-18 | +1.0pp $-70 |
UW: 25.0% down · 7.5% · 30yr · 1.5% tax · 5.0% vac · 8.0% maint · 8.0% mgmt
Financing live
Cash to close
- Down payment
- $49,500
- Closing costs
- $5,940
- Reserves months
- —
- Total cash needed
- —
Loan-product check · same deal, 3 products live
Conventional
25% down · 7.5% · 30yr
- Down + closing
- —
- Monthly P&I
- —
- Monthly cashflow
- —
- DSCR
- —
- Eligible?
- —
Personal DTI + credit; lowest rate.
DSCR
20% down · 8.5% · 30yr
- Down + closing
- —
- Monthly P&I
- —
- Monthly cashflow
- —
- DSCR
- —
- Eligible?
- —
No personal income docs; deal must DSCR.
Hard money
10% down · 12.0% · 12mo
- Down + closing
- —
- Monthly P&I
- —
- Monthly cashflow
- —
- DSCR
- —
- Eligible?
- —
Short-term bridge; refi at stabilization.
Rent comps 22 comps
| Address | Beds | Baths | Sqft | Rent | $/sqft | DOM | Units | Dist |
|---|---|---|---|---|---|---|---|---|
| 17 Elwood Ct Florissant, MO | 3.0 | 2.0 | 1572 | $1,945 | $1.24 | 3d | 1 | 0.29mi |
| 785 Florland Dr Florissant, MO | 3.0 | 1.0 | 1100 | $1,700 | $1.55 | 19d | 1 | 0.44mi |
| 9 Charlotte Dr Florissant, MO | 3.0 | 1.5 | 1404 | $1,561 | $1.11 | 0d | 1 | 0.46mi |
| 4 Sharon Ct Florissant, MO | 3.0 | 2.0 | 1108 | $1,800 | $1.62 | 0d | 1 | 0.53mi |
| 116 Graham Rd Florissant, MO | 3.0 | 2.0 | 1578 | $1,495 | $0.95 | 4d | 1 | 0.77mi |
| 1145 Swallow Ln Florissant, MO | 3.0 | 2.0 | 1288 | $1,645 | $1.28 | 5d | 1 | 0.79mi |
| 1505 Miller Dr Florissant, MO | 3.0 | 3.0 | 1246 | $1,750 | $1.40 | 0d | 1 | 0.87mi |
| 1395 Bluebird Dr Florissant, MO | 3.0 | 2.0 | 1168 | $1,599 | $1.37 | 18d | 1 | 0.91mi |
| 240 Chez Vant Ct Hazelwood, MO | 2.0 | 1.5 | 1440 | $1,350 | $0.94 | 45d | 1 | 1.03mi |
| 3 Champlain Ct Florissant, MO | 3.0 | 1.0 | 1100 | $1,600 | $1.45 | 45d | 1 | 1.06mi |
| 1095 Humes Ln Florissant, MO | 3.0 | 1.5 | 1100 | $1,650 | $1.50 | 6d | 1 | 1.07mi |
| 1740 Deborah Dr Florissant, MO | 3.0 | 2.5 | 1650 | $1,750 | $1.06 | 19d | 1 | 1.18mi |
| 14 Rivermeadows Dr Florissant, MO | 3.0 | 2.0 | 1587 | $2,386 | $1.50 | 16d | 1 | 1.21mi |
| 2245 Lindsay Ln Florissant, MO | 4.0 | 2.0 | 1466 | $1,800 | $1.23 | 18d | 1 | 1.25mi |
| 16 Mary Rose Ct Hazelwood, MO | 3.0 | 2.0 | 1506 | $1,706 | $1.13 | 16d | 1 | 1.29mi |
| 2400 Teakwood Manor Dr Florissant, MO | 3.0 | 2.0 | 1380 | $1,725 | $1.25 | 45d | 1 | 1.30mi |
| 2160 Splendor Dr Florissant, MO | 3.0 | 2.0 | 1100 | $1,800 | $1.64 | 5d | 1 | 1.31mi |
| 1095 Cedar Pl Florissant, MO | 3.0 | 1.5 | 1107 | $1,710 | $1.54 | 0d | 1 | 1.38mi |
| 750 Carriage Ln Hazelwood, MO | 4.0 | 2.0 | 1701 | $2,026 | $1.19 | 14d | 1 | 1.42mi |
| 1280 Saint Catherine St Florissant, MO | 3.0 | 1.0 | 1274 | $1,600 | $1.26 | 16d | 1 | 1.44mi |
| 537 Lynn Haven Ln Hazelwood, MO | 3.0 | 2.0 | 1242 | $1,675 | $1.35 | 25d | 1 | 1.44mi |
| 560 Bardot Dr Florissant, MO | 3.0 | 2.0 | 1976 | $1,875 | $0.95 | 0d | 1 | 1.46mi |
Listing history 16 events
-
2026-06-21days on market $198,000 Active 26 DOM
-
2026-06-18days on market $198,000 Active 23 DOM
-
2026-06-17days on market $198,000 Active 22 DOM
-
2026-06-16days on market $198,000 Active 21 DOM
-
2026-06-15days on market $198,000 Active 20 DOM
-
2026-06-13days on market $198,000 Active 18 DOM
-
2026-06-13days on market $198,000 Active 17 DOM
-
2026-06-09days on market $198,000 Active 14 DOM
-
2026-06-08days on market $198,000 Active 13 DOM
-
2026-06-07days on market $198,000 Active 12 DOM
-
2026-06-05days on market $198,000 Active 9 DOM
-
2026-06-03days on market $198,000 Active 8 DOM
-
2026-06-02days on market $198,000 Active 7 DOM
-
2026-06-01days on market $198,000 Active 6 DOM
-
2026-05-31days on market $198,000 Active 5 DOM
-
2026-05-26$198,000 Active
ⓘ Source: listings_history table (triggers on properties + properties_extension) + one-shot
backfill from property_details.listing_events for pre-trigger history.
Climate risk First Street
- Flood 1/10 Low FEMA zone X (unshaded) · 0% chance over 30 yrs
- Wildfire 1/10 Low
- Heat 5/10 Major 7 d/yr ≥105°F today · 21 d/yr by 30 yrs out
- Wind 2/10 Low 100% chance of damaging wind over 30 yrs
- Air quality 3/10 Moderate 3 unhealthy d/yr today · 5 by 30 yrs out
Nearby sold comps map
Loading sold comps map…
Walkable amenities ~0.75 mi
Loading nearby amenities…
Taxation est. · year 1
- Rental income
- $21,298
- − Mortgage interest
- −$11,091
- − Property taxes
- −$2,970
- − Insurance
- −$990
- − Repairs & maintenance
- −$1,704
- − Management
- −$1,704
- − Depreciation
- −$5,760
- Taxable loss
- −$2,921
- Est. tax savings @ 24.0%
- +$701
- After-tax cash flow
- $1,107/yr
For passive investors: Depreciation is non-cash, so a rental often shows a tax loss while cash-flowing — sheltering income. Rental losses are passive: they offset passive income freely, and up to $25,000/yr can offset ordinary (W-2) income if you actively participate and your MAGI is under $100k (phasing out to $0 by $150k); unused losses carry forward. On sale, claimed depreciation is recaptured at up to 25%, and gains may owe capital-gains tax (a 1031 exchange can defer both). Figures are a year-1 estimate at your 24.0% rate — not tax advice; consult a CPA.
Condition & rehab AI · 17 photos
This home has been recently updated with fresh paint and flooring, making it move-in ready with good curb appeal and functional living spaces.
Repairs flagged
- Minor kitchen cabinets — slight wear
- Minor bathroom fixtures — standard fixtures
Value-add opportunities
- Both paint exterior — enhances curb appeal and value
- Both replace kitchen countertops — modernizes kitchen and improves functionality
Renovation cost estimate screening
| Repair item | Severity | Est. cost |
|---|---|---|
| kitchen cabinets · slight wear | Minor | $500–3,000 |
| bathroom fixtures · standard fixtures | Minor | $500–3,000 |
| Total estimated repair cost · 2 items | $1,000–6,000 |
Value-add ROI direction
- Both paint exterior — enhances curb appeal and value ↑
- Both replace kitchen countertops — modernizes kitchen and improves functionality ↑
ⓘ Cost ranges are severity-bucket heuristics (US national rule-of-thumb). Get contractor quotes + a written scope before underwriting a rehab budget.
Schools (NCES district)
- District
- Hazelwood
- NCES district ID
- 2913830
- Math proficiency
- 11% ▼ -13.00%
- Reading proficiency
- 26% ▼ -6.00%
- Median HH income
- $51,621
- Composite
- 16.77/100
- National rank
- #9156
- State rank
- #306 of 324 in MO
Livability — Florissant
- Score
- 73/100
- State rank
- #82
- US rank
- #5406
Category grades
Schools grade is shown separately in the Schools card above.
Census & demographics
- Census place
- Florissant, MO
- County
- Saint Louis County · 888,823 people
- City population
- 69,104
- Metro
- St. Louis, MO-IL
- Population (ZIP)
- 50,196
- Household income
- $70,811
- Rent vs Own
- Severe rent burden
- 1279.0
Population outlook (St. Louis County) Hauer SSP2
- Today (2025)
- 1,025,227 people
- By 2030
- 1,028,023 · +0.3%
- By 2040
- 1,020,940 · -0.4%
- By 2050
- 1,007,280 · -1.8%
- By 2075
- 987,277 · -3.7%
- By 2100
- 921,984 · -10.1%
Race, ethnicity, and origin ACS 2023
- Neighborhood character
- Diverse neighborhood (Simpson 0.58)
- Race & ethnicity
- White 49% Black 41% Two or more races 7% Hispanic / Latino 2%
- Common ancestry
- Romanian 3% Lithuanian 3% Swedish 1%
- Foreign-born
- 5% · Canada, Jamaica
- Languages at home
- 94% English-only · Spanish 2% Arabic 1%
Political lean MEDSL · St. Louis
- 2024 margin
- Strong D (+23.4) · D 60.8% · R 37.4% · Other 1.7%
- 2008→2024 swing
- +3.5pp toward D · 2008: 19.9pp · 2024: 23.4pp
- All cycles
- 2024: D+23.4 2020: D+24.0 2016: D+16.2 2012: D+13.7 2008: D+19.9
Not yet ingested
- Civics
- —
Market trends
- HPI YoY
- ▼ -223.57%
- Current HPI
- 202.7192
- Rent YoY
- ▲ 4.27%
- Metro
- St. Louis, MO-IL
- State GDP YoY
- ▲ 1.84%
- F500 in state
- 20
Industry mix (Fortune 500 HQ in MO)
| Industry | F500 HQs | Revenue |
|---|---|---|
| Healthcare | 1 | $163B |
|
||
| Insurance | 1 | $21B |
|
||
| Industrial Technology | 1 | $17B |
|
||
| Retail | 1 | $16B |
|
||
| Industrial Distribution | 1 | $10B |
|
||
| Utilities | 1 | $9B |
|
||
Price history
1 event — show timeline
- 2026-05-26 Listed $198,000 MARIS as Distributed by MLS Grid
Cash-flow waterfall
monthlySold comps — $/sqft
last 12 mo · ≤1 miLoading sold comps…