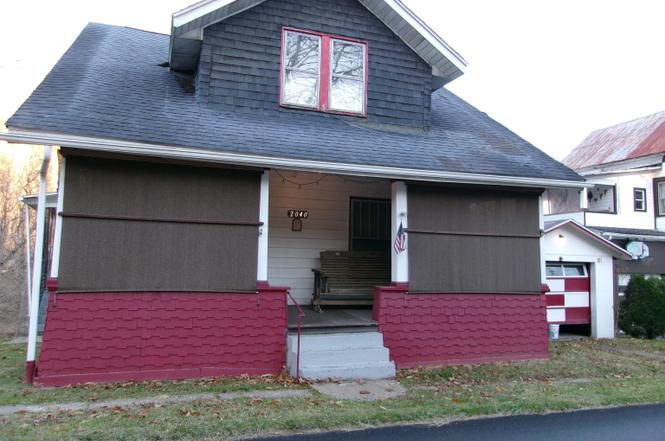
2040 Monumental Rd · Grant Town, WV
Flood risk 8/10 · Major
- FEMA flood zone
- X (unshaded)
- Chance of flooding over 30 yrs
- 0.99%
- Est. flood insurance / yr
- $473 – $860
Fire risk 3/10 · Minor
- Est. fire insurance / yr
- $787 – $1,461
Heat risk 4/10 · Minor
- Hot days now (above 97°F)
- 7 days/yr
- Hot days in 30 yrs
- 19 days/yr
Wind risk 1/10 · Minimal
- Chance of severe wind over 30 yrs
- 0.0%
Air-quality risk 1/10 · Minimal
- Unhealthy air days now
- 0 days/yr
- Unhealthy air days in 30 yrs
- 0 days/yr
Risk factors via First Street. Map © Google.
Why this score? — see what drove the B+ grade
The composite is a weighted blend of 9 inputs, each scored 0–100. Each bar is that input's sub-score; the figure is the points it added to the 100-point composite (weight × sub-score).
- Cash flow +30.0/30.0
- 1% rule +10.0/10.0
- DSCR +10.0/10.0
- ARV discount +7.5/15.0
- Appreciation +6.6/10.0
- Livability +3.2/5.0
- Schools +3.1/10.0
- Rent growth +2.5/5.0
- Condition / age +2.5/5.0
$59,900
🖨 Deal sheet (PDF) 📄 Offer letter ✓ Due diligence
Listing remarks
Original woodwork, french doors, built-ins and fireplace give this cape cod so much charm. Formal foyer and dining room. Possible hardwood floors under carpet throughout. Spacious bedrooms and bath on 2nd floor with oversized closets. Single stall detached garage.
Key facts
- French doors
- Formal foyer
- Original woodwork
Tags
Property features AI
Finance
- Other: Public listing handled by VANTAGE POINT REALTY, LLC
Exterior
- Parking: Detached garage (1 car); Off-street and on-street parking
- Utilities: Public water; Public sewer; Cable available
- Home design: Single-family detached residence; One story
- Construction: Frame construction with vinyl siding; Shingle roof
- Exterior features: Front porch; Level to sloped lot
Interior
- Kitchen: Range; Refrigerator
- Flooring: Laminate flooring; Vinyl flooring
- Bathrooms: One full bathroom
- Heating & cooling: Natural gas heating; Ceiling fan(s) for cooling
- Interior features: Refrigerator and range included; One masonry fireplace; Basement with concrete floor; Five total rooms
Neighborhood map
What this means for you Summary
Snapshot
- This is a 2-bed/1.0-bath single-family listed at $60k.
Deal economics
- At list price, monthly cash flow is $430 ($5k/yr) — positive.
- The deal already cash-flows at list — no discount required.
- Meets the 1% rule at list price ($1k rent vs $60k).
- Recommended offer: $53k (12.0% below list) — sets the bar for market timing.
Location & tenants
- Location reads 63/100 on livability (#158 in WV) — a middle-class / working-renter tenant base. Strengths: cost of living A+, housing A+; Watch: health & safety C-, employment D+, amenities F.
- Marion County Schools (town): math 30% / reading 43% proficiency, ranked #11 of 55 in WV (top 20%) — families likely to look elsewhere, expect single-tenant / working-renter base with shorter leases.
- Zoned schools: Fairview Elementary School (math 30% / reading 30%, grade F, #218 of 377 statewide, top 59%, 130 students, 0% FRL); West Fairmont Middle School (math 27% / reading 41%, grade F, #36 of 109 statewide, top 35%, 629 students, 0% FRL); East Fairmont High School (math 27% / reading 52%, grade F, #21 of 110 statewide, top 26%, 689 students, 0% FRL) — zoned schools average 0% FRL vs 46% district-wide (46 pts lower); this property's tenant base skews higher-income than the district average.
- Market conditions: 4 active listings in the ZIP; 3 units permitted in Marion County in 2024 (0 in 5+ unit buildings).
Forward outlook
- In year one you build about $2k of equity ($414 loan paydown + $2k appreciation (3.1% local appreciation)).
- At projected returns (3.1% appreciation + 3.0% rent growth), your $17k cash investment doubles in ~3 years — after that, you're playing with house money.
Negotiation context
- It's been on market 577 days — a 12% lower offer ($53k) is reasonable based on typical stale-listing flexibility.
- 3 sale attempts since 2y ago; this cycle's ask has dropped $10k (14%) from the opening price — seller is motivated, your offer sets the floor, not the list.
Risks & watch-outs
- Watch-outs: flood insurance adds $56/mo; built in 1910 — expect roof / HVAC / electrical / plumbing capex.
- Climate carrying-cost: severe flood risk — expect insurance premiums to compound above CPI over the hold.
Questions for the listing agent
- It's been on market 577 days. Have you received any prior offers? Is the seller open to a 12% concession, seller financing, or rate buy-down credit?
- Built in 1910 — when were the roof, HVAC, electrical panel, plumbing, and water heater last replaced?
- What's the actual annual flood-insurance premium (NFIP or private), and is the property in a SFHA with mandatory coverage?
- Why hasn't it sold? Are there any deal-killer items the seller is aware of (foundation, flood, title, zoning, code violations)?
- Is there a deadline driving the sale (1031 exchange, divorce, estate, relocation)? That informs how much negotiation room exists.
- Schools are F-rated, which usually means shorter tenancies and higher turnover. Who's the typical renter profile here, and what's been the actual vacancy rate?
- What's the average days-on-market for RENTAL listings here right now (not sales)? A rising rental-DOM trend means longer vacancies and softer asking-rent achievability than the comps imply.
- What's the recent tenant-quality profile in this submarket — average credit score on applications, eviction rate, late-payment / NSF rate, and stable-employment percentage? A property-management company in the area should have these aggregated.
- How much new for-sale + rental construction is in the pipeline within 1–3 miles? Heavy new supply typically softens prices + rents 12–24 months out; constrained supply supports both.
Investment metrics
- 1% rule
- 1.79% ✓
- Cap rate
- 16.02%
- Cash-on-cash
- 34.72%
- DSCR
- 2.54
- GRM
- 4.7
CMA / ARV
No comps found within radius.
Projected returns pro-forma
3.11% appreciation · 3.0% rent growth · sell at horizon
- IRR
- 36.8%
- Equity multiple
- 3.08×
- Total profit
- $34,961
- Equity at exit
- $27,312
- IRR
- 36.7%
- Equity multiple
- 6.11×
- Total profit
- $85,692
- Equity at exit
- $42,388
Cash invested: $16,772 (down + closing). Projections, not guarantees.
Landlord ↔ Tenant lean methodology
- Overall (STATE)
- 83 Strongly Landlord-Friendly
- State West Virginia
- 83 Strongly Landlord-Friendly · R+22
- County
- — inherits STATE
- City
- — inherits STATE
ZIP-level market 26588
- Home prices YoY
- 1.7%
- Active inventory
- 4
- Price-to-rent
- 4.7×
Monthly cashflow live
- Estimated rent
- $1,072 medium interval (Pro) →
- Mortgage (P&I)
- −$314
- Tax from tax record
- −$22 /mo · $267/yr
- Insurance
- −$25
- Flood insurance flood zone
- −$56 /mo · $666/yr
- HOA
- −$0
- Vacancy / Maint / Mgmt
- −$225
- Net cashflow
- $430
Break-even live
Sensitivity live
| Price | -10% $464 | -5% $447 | +0% $430 | +5% $413 | +10% $396 |
|---|---|---|---|---|---|
| Rent | -10% $345 | -5% $387 | +0% $430 | +5% $472 | +10% $514 |
| Rate | -1.0pp $460 | -0.5pp $445 | base $430 | +0.5pp $414 | +1.0pp $398 |
UW: 25.0% down · 7.5% · 30yr · 1.5% tax · 5.0% vac · 8.0% maint · 8.0% mgmt
Financing live
Cash to close
- Down payment
- $14,975
- Closing costs
- $1,797
- Reserves months
- —
- Total cash needed
- —
Loan-product check · same deal, 3 products live
Conventional
25% down · 7.5% · 30yr
- Down + closing
- —
- Monthly P&I
- —
- Monthly cashflow
- —
- DSCR
- —
- Eligible?
- —
Personal DTI + credit; lowest rate.
DSCR
20% down · 8.5% · 30yr
- Down + closing
- —
- Monthly P&I
- —
- Monthly cashflow
- —
- DSCR
- —
- Eligible?
- —
No personal income docs; deal must DSCR.
Hard money
10% down · 12.0% · 12mo
- Down + closing
- —
- Monthly P&I
- —
- Monthly cashflow
- —
- DSCR
- —
- Eligible?
- —
Short-term bridge; refi at stabilization.
Listing history 21 events
-
2026-06-21days on market $59,900 Active 577 DOM
-
2026-06-19days on market $59,900 Active 575 DOM
-
2026-06-18days on market $59,900 Active 574 DOM
-
2026-06-17days on market $59,900 Active 573 DOM
-
2026-06-16days on market $59,900 Active 572 DOM
-
2026-06-15days on market $59,900 Active 571 DOM
-
2026-06-14days on market $59,900 Active 569 DOM
-
2026-06-13days on market $59,900 Active 568 DOM
-
2026-06-10days on market $59,900 Active 566 DOM
-
2026-06-09days on market $59,900 Active 565 DOM
-
2026-06-08days on market $59,900 Active 564 DOM
-
2026-06-07days on market $59,900 Active 563 DOM
-
2026-06-02days on market $59,900 Active 558 DOM
-
2026-06-01days on market $59,900 Active 557 DOM
-
2026-05-31days on market $59,900 Active 556 DOM
-
2026-05-30days on market $59,900 Active 555 DOM
-
2025-08-14status Active
-
2025-08-14price $59,900
-
2025-08-07historical
-
2025-05-14status Active
-
2024-11-06$69,900 Active
ⓘ Source: listings_history table (triggers on properties + properties_extension) + one-shot
backfill from property_details.listing_events for pre-trigger history.
Tax reassessment forecast WV · Resets to sale price
- Current annual tax
- $267 · $22/mo
- Projected year-2 tax
- $353 · $29/mo
- Expected delta
- +$86/yr (+$7/mo · 32.2%)
ⓘ Screening estimate from a state-policy table — verify with the county assessor before closing.
Climate risk First Street
- Flood 8/10 Severe FEMA zone X (unshaded) · 99% chance over 30 yrs
- Wildfire 3/10 Moderate
- Heat 4/10 Moderate 7 d/yr ≥97°F today · 19 d/yr by 30 yrs out
- Wind 1/10 Low 0% chance of damaging wind over 30 yrs
- Air quality 1/10 Low 0 unhealthy d/yr today · 0 by 30 yrs out
Nearby sold comps map
Loading sold comps map…
Walkable amenities ~0.75 mi
Loading nearby amenities…
Taxation est. · year 1
- Rental income
- $12,861
- − Mortgage interest
- −$3,355
- − Property taxes
- −$267
- − Insurance
- −$966
- − Repairs & maintenance
- −$1,029
- − Management
- −$1,029
- − Depreciation
- −$1,743
- Taxable income
- $4,472
- Est. tax owed @ 24.0%
- −$1,073
- After-tax cash flow
- $4,084/yr
For passive investors: Depreciation is non-cash, so a rental often shows a tax loss while cash-flowing — sheltering income. Rental losses are passive: they offset passive income freely, and up to $25,000/yr can offset ordinary (W-2) income if you actively participate and your MAGI is under $100k (phasing out to $0 by $150k); unused losses carry forward. On sale, claimed depreciation is recaptured at up to 25%, and gains may owe capital-gains tax (a 1031 exchange can defer both). Figures are a year-1 estimate at your 24.0% rate — not tax advice; consult a CPA.
Schools (NCES district)
- District
- Marion County Schools
- NCES district ID
- 5400720
- Math proficiency
- 30% ▼ -14.00%
- Reading proficiency
- 43% ▼ -8.00%
- Median HH income
- $42,195
- Composite
- 30.8/100
- National rank
- #6145
- State rank
- #11 of 55 in WV
Livability — Grant Town
- Score
- 63/100
- State rank
- #158
- US rank
- #15100
Category grades
Schools grade is shown separately in the Schools card above.
Census & demographics
- City population
- 405
- Population (ZIP)
- 2,911
Population outlook (Marion County) Hauer SSP2
- Today (2025)
- 56,923 people
- By 2030
- 56,850 · -0.1%
- By 2040
- 56,469 · -0.8%
- By 2050
- 56,027 · -1.6%
- By 2075
- 55,509 · -2.5%
- By 2100
- 51,082 · -10.3%
Race, ethnicity, and origin ACS 2023
- Neighborhood character
- Predominantly White (93%)
- Race & ethnicity
- White 93% Two or more races 5% Hispanic / Latino 1%
- Common ancestry
- Romanian 4% Iranian 2% Slovak 1%
- Foreign-born
- 1%
- Languages at home
- 98% English-only · German/W. Germanic 1%
Political lean MEDSL · Marion
- 2024 margin
- Solid R (+31.2) · D 33.2% · R 64.5% · Other 2.3%
- 2008→2024 swing
- -31.7pp toward R · 2008: 0.5pp · 2024: -31.2pp
- All cycles
- 2024: R+31.2 2020: R+28.7 2016: R+33.5 2012: R+14.4 2008: D+0.5
Not yet ingested
- Civics
- —
Market trends
- HPI YoY
- ▲ 3.11%
- Current HPI
- 189.8469
- Rent YoY
- —
- Metro
- —
- State GDP YoY
- —
- F500 in state
- 0
Price history
-14.3% since first listed5 events — show timeline
- 2025-08-14 Relisted — NCWVREIN
- 2025-08-14 Price Changed $59,900 NCWVREIN
- 2025-08-07 Delisted — NCWVREIN
- 2025-05-14 Relisted — NCWVREIN
- 2024-11-06 Listed $69,900 NCWVREIN
Property tax history
+9.7%/yrLatest (2025): $267 · +7.9% YoY. Source: county tax records.
Cash-flow waterfall
monthlySold comps — $/sqft
last 12 mo · ≤1 miLoading sold comps…