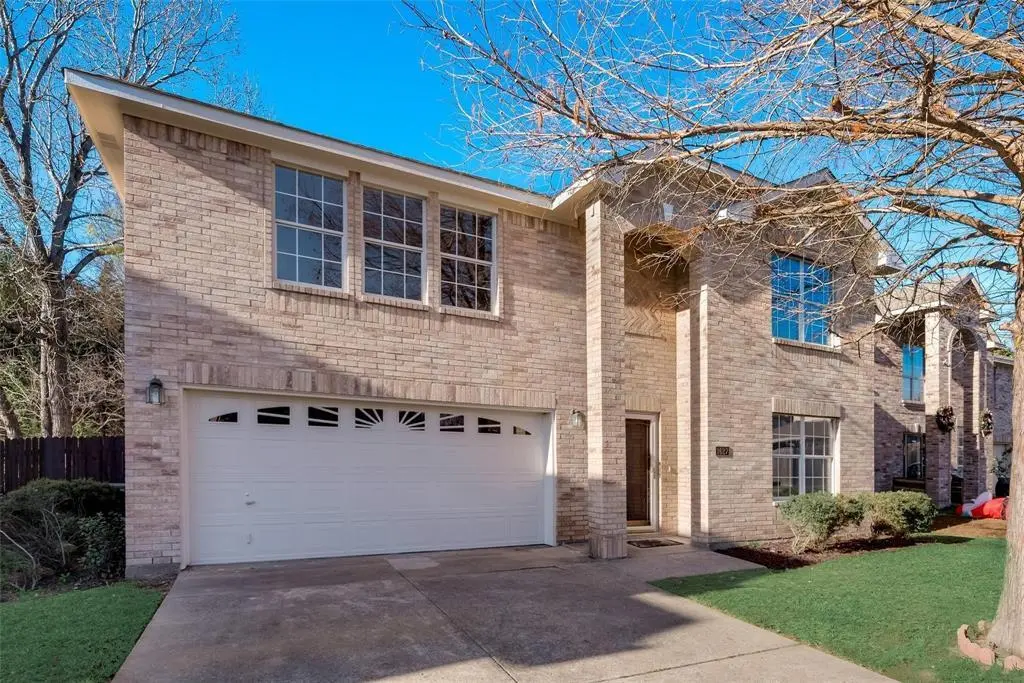
1627 Cedarbrook Dr · Mesquite, TX
Flood risk 3/10 · Minor
- FEMA flood zone
- X (unshaded)
- Chance of flooding over 30 yrs
- 0.2%
- Est. flood insurance / yr
- $507 – $1,088
Fire risk 3/10 · Minor
- Est. fire insurance / yr
- $1,222 – $2,270
Heat risk 8/10 · Major
- Hot days now (above 110°F)
- 7 days/yr
- Hot days in 30 yrs
- 25 days/yr
Wind risk 6/10 · Moderate
- Chance of severe wind over 30 yrs
- 27.0%
Air-quality risk 2/10 · Minimal
- Unhealthy air days now
- 1 days/yr
- Unhealthy air days in 30 yrs
- 1 days/yr
Risk factors via First Street. Map © Google.
Why this score? — see what drove the D grade
The composite is a weighted blend of 9 inputs, each scored 0–100. Each bar is that input's sub-score; the figure is the points it added to the 100-point composite (weight × sub-score).
- Cash flow +12.0/30.0
- ARV discount +10.8/15.0
- 1% rule +4.4/10.0
- DSCR +3.5/10.0
- Livability +3.5/5.0
- Schools +2.9/10.0
- Rent growth +2.5/5.0
- Condition / age +2.5/5.0
- Appreciation +0.0/10.0
$339,900
🖨 Deal sheet (PDF) 📄 Offer letter ✓ Due diligence
Listing remarks MLS
Nestled on an expansive 0.289-acre lot, this beautifully remodeled five-bedroom home offers a modern elegance and comfortable living. Step inside to discover a light-filled interior, where a thoughtfully designed kitchen awaits. Sleek stainless steel appliances complement the quartz countertops, creating an inviting space for culinary endeavors. A generously sized pantry and a dedicated laundry area add to the home's practicality. Retreat to the expansive master suite featuring a spacious bathroom appointed with separate quartz-topped vanities, a separate shower and bathtub, and not one, but two walk-in closets. Each of the additional four bedrooms also has a walk-in closets, ensuring ample storage throughout. Extend your living outdoors to the covered patio, an ideal spot to savor the tranquil views of the surrounding trees. Beyond the beauty of the home itself, its prime location offers unparalleled convenience, with numerous shopping centers and major highways just moments away. No HOA Restrictions for rentals. Investors are welcome
Key facts
- Expansive lot
- Quartz countertops
- Remodeled home
Tags
Neighborhood map
What this means for you Summary
Snapshot
- This is a 4-bed/2.5-bath single-family listed at $340k.
Deal economics
- At list price, monthly cash flow is $-84 ($-1k/yr) — negative.
- To cash-flow at today's rent, offer at most $325k (4.3% below list).
- To meet the 1% rule (rent ≥ 1% of price), the offer needs to be $318k (6.4% below list).
- Recommended offer: $318k (6.4% below list) — sets the bar for 1% rule.
- Cap rate 6.0% vs local median 4.4% in Mesquite — top-decile yield for the area; either an underpriced asset or a hidden risk that comps aren't pricing in. Stress-test before assuming the spread holds.
Location & tenants
- Location reads 70/100 on livability (#358 in TX) — a middle-class / working-renter tenant base. Strengths: cost of living A+, housing A+, health & safety A-; Watch: schools C-, crime F, commute F.
- Mesquite ISD (suburban): math 35% / reading 32% proficiency, ranked #536 of 826 in TX (top 65%) — families likely to look elsewhere, expect single-tenant / working-renter base with shorter leases; 63% free/reduced lunch — lower-income household profile, screen leases tightly.
- Market conditions: Rents flat; 597 active listings in the ZIP; 22 comparable units currently listed for rent nearby; rentals at typical pace (median 26d on market — plan ~3-4 weeks tenant-placement turnaround); high-income renter base; 12,577 units permitted in Dallas County in 2024 (6,829 in 5+ unit buildings).
- This rent runs 34% of the median local income ($111k/yr) — at the standard rent-burdened threshold; future hikes will face affordability resistance.
Forward outlook
- Local home prices are declining (-3.0%/yr); year-one equity from $2k of loan paydown is wiped out by about $10k of value loss. Plan a longer hold.
- Dallas County population projected at +35% by 2050 — long-run rental-demand tailwind backs the buy-and-hold thesis.
Negotiation context
- It's been on market 65 days — a 6% lower offer ($320k) is reasonable based on typical stale-listing flexibility.
- 5 sale attempts since 5y ago; this cycle's ask has dropped $30k (8%) from the opening price — seller is motivated, your offer sets the floor, not the list.
Risks & watch-outs
- Climate carrying-cost: major wind risk, 27% chance of damaging wind over 30y; extreme-heat days projected 7→25/yr by 2055 (HVAC capex compounding) — expect insurance premiums to compound above CPI over the hold.
Questions for the listing agent
- What do current leases actually rent for vs. the listed asking? Can we see a recent rent roll and the last 12 months of T-12 income?
- It's been on market 65 days. Have you received any prior offers? Is the seller open to a 6% concession, seller financing, or rate buy-down credit?
- Why hasn't it sold? Are there any deal-killer items the seller is aware of (foundation, flood, title, zoning, code violations)?
- Is there a deadline driving the sale (1031 exchange, divorce, estate, relocation)? That informs how much negotiation room exists.
- Crime grade is F in this area — have there been break-ins, vandalism, or insurance claims at this property in the last 3 years? What carrier currently insures it and at what premium?
- The area grade is low — what's the realistic commute time and amenity access for the typical tenant pool here? Any planned neighborhood developments (good or bad) we should know about?
- What's the average days-on-market for RENTAL listings here right now (not sales)? A rising rental-DOM trend means longer vacancies and softer asking-rent achievability than the comps imply.
- What's the recent tenant-quality profile in this submarket — average credit score on applications, eviction rate, late-payment / NSF rate, and stable-employment percentage? A property-management company in the area should have these aggregated.
- How much new for-sale + rental construction is in the pipeline within 1–3 miles? Heavy new supply typically softens prices + rents 12–24 months out; constrained supply supports both.
Investment metrics
- 1% rule
- 0.94% ✗
- Cap rate
- 6.00%
- Cash-on-cash
- -1.06%
- DSCR
- 0.95
- GRM
- 8.9
CMA / ARV
- ARV (median comp)
- $366,732
- List price
- $339,900
- Delta
- -4.59%
- Verdict
- FAIR
- Comps
- 20 within 1.0 mi
Show comp detail 12 sales within ~0.75 mi
| Address | Dist | Beds/Ba | Sqft | Sold | Price | $/sf | Match |
|---|---|---|---|---|---|---|---|
| 1806 Cedar Ridge Dr | 0.07mi | 4/2.5 | 2,686 (+4%) | 2mo | $345,000 | $128 | 89 |
| 1813 Forest Wood Ln | 0.21mi | 4/2.5 | 2,630 (+2%) | 1mo | $414,990 | $158 | 86 |
| 1801 Jade Forest Ln | 0.31mi | 4/2.5 | 2,495 (-4%) | 3mo | $487,955 | $196 | 77 |
| 2101 Hazel Lily Run | 0.39mi | 4/2.5 | 2,495 (-4%) | 2mo | $474,000 | $190 | 74 |
| 2025 Lone Oak Trl | 0.27mi | 4/3.0 | 2,448 (-5%) | 3mo | $424,990 | $174 | 74 |
| 1933 Jade Forest Ln | 0.31mi | 3/2.5 (-1) | 2,500 (-3%) | 3mo | $409,990 | $164 | 72 |
| 913 Bridgewater Ln | 0.50mi | 4/2.5 | 2,512 (-3%) | 0mo | $390,000 | $155 | 72 |
| 2221 Hazel Lily Run | 0.47mi | 3/2.5 (-1) | 2,500 (-3%) | 3mo | $409,990 | $164 | 65 |
| 1317 Osage Trl | 0.70mi | 4/2.5 | 2,600 (+0%) | 3mo | $419,900 | $162 | 64 |
| 2225 Hazel Lily Run | 0.48mi | 4/3.0 | 2,358 (-9%) | 0mo | $414,990 | $176 | 61 |
| 1825 Jasmine June | 0.71mi | 5/4.0 (+1) | 2,683 (+4%) | 2mo | $529,950 | $198 | 48 |
| 1837 Rustic Vine Rd | 0.49mi | 5/3.5 (+1) | 2,925 (+13%) | 3mo | $473,000 | $162 | 44 |
Match score weights: distance 35% · size 25% · config 20% · recency 20%. Top-matched comps best support the ARV.
Projected returns pro-forma
-3.0% appreciation · 0.07% rent growth · sell at horizon
- IRR
- -21.7%
- Equity multiple
- 0.27×
- Total profit
- $-69,321
- Equity at exit
- $50,680
- IRR
- -26.0%
- Equity multiple
- -0.07×
- Total profit
- $-101,680
- Equity at exit
- $29,388
Cash invested: $95,172 (down + closing). Projections, not guarantees.
Landlord ↔ Tenant lean methodology
- Overall (STATE)
- 87 Strongly Landlord-Friendly
- State Texas
- 87 Strongly Landlord-Friendly · R+5
- County
- — inherits STATE
- City
- — inherits STATE
ZIP-level market 75181
- Home prices YoY
- -9.4%
- Rents YoY
- 0.1%
- Active inventory
- 597
- Price-to-rent
- 8.9×
Monthly cashflow live
- Estimated rent
- $3,182 high interval (Pro) →
- Mortgage (P&I)
- −$1,782
- Tax from tax record
- −$673 /mo · $8,079/yr
- Insurance
- −$142
- HOA
- −$0
- Vacancy / Maint / Mgmt
- −$668
- Net cashflow
- $-84
Break-even live
Sensitivity live
| Price | -10% $109 | -5% $13 | +0% $-84 | +5% $-180 | +10% $-276 |
|---|---|---|---|---|---|
| Rent | -10% $-335 | -5% $-209 | +0% $-84 | +5% $42 | +10% $168 |
| Rate | -1.0pp $87 | -0.5pp $3 | base $-84 | +0.5pp $-172 | +1.0pp $-261 |
UW: 25.0% down · 7.5% · 30yr · 1.5% tax · 5.0% vac · 8.0% maint · 8.0% mgmt
Financing live
Cash to close
- Down payment
- $84,975
- Closing costs
- $10,197
- Reserves months
- —
- Total cash needed
- —
Loan-product check · same deal, 3 products live
Conventional
25% down · 7.5% · 30yr
- Down + closing
- —
- Monthly P&I
- —
- Monthly cashflow
- —
- DSCR
- —
- Eligible?
- —
Personal DTI + credit; lowest rate.
DSCR
20% down · 8.5% · 30yr
- Down + closing
- —
- Monthly P&I
- —
- Monthly cashflow
- —
- DSCR
- —
- Eligible?
- —
No personal income docs; deal must DSCR.
Hard money
10% down · 12.0% · 12mo
- Down + closing
- —
- Monthly P&I
- —
- Monthly cashflow
- —
- DSCR
- —
- Eligible?
- —
Short-term bridge; refi at stabilization.
Rent comps 22 comps
| Address | Beds | Baths | Sqft | Rent | $/sqft | DOM | Units | Dist |
|---|---|---|---|---|---|---|---|---|
| 1817 Cedarbriar Dr Mesquite, TX | 5.0 | 3.5 | 2538 | $3,495 | $1.38 | 45d | 1 | 0.19mi |
| 732 Creekview Ct Mesquite, TX | 5.0 | 3.0 | 2313 | $3,495 | $1.51 | 45d | 1 | 0.31mi |
| 2201 Cantura Dr Mesquite, TX | 4.0 | 2.0 | 2432 | $2,700 | $1.11 | 0d | 1 | 0.45mi |
| 1908 Twisted Tree Ln Mesquite, TX | 5.0 | 2.5 | 2750 | $3,670 | $1.33 | 25d | 1 | 0.46mi |
| 815 Valleycreek Rd Mesquite, TX | 3.0 | 2.0 | 1788 | $2,500 | $1.40 | 45d | 1 | 0.57mi |
| 1626 Rancho Dr Mesquite, TX | 4.0 | 2.0 | 2562 | $2,419 | $0.94 | 25d | 1 | 0.72mi |
| 1809 Osage Trl Mesquite, TX | 4.0 | 2.0 | 2022 | $2,599 | $1.29 | 18d | 1 | 0.73mi |
| 1513 Colborne Dr Mesquite, TX | 3.0 | 2.0 | 1805 | $2,045 | $1.13 | 45d | 1 | 0.93mi |
| 924 Hillrise Dr Mesquite, TX | 3.0 | 2.0 | 1937 | $2,100 | $1.08 | 0d | 1 | 1.03mi |
| 1309 Dawson Way Mesquite, TX | 4.0 | 2.0 | 1952 | $2,222 | $1.14 | 9d | 1 | 1.04mi |
| 1332 Nimitz Way Mesquite, TX | 4.0 | 2.0 | 2109 | $2,280 | $1.08 | 22d | 1 | 1.08mi |
| 1308 Dawson Way Mesquite, TX | 4.0 | 2.5 | 2476 | $3,573 | $1.44 | 25d | 1 | 1.08mi |
| 716 Elm Falls Pl Mesquite, TX | 3.0 | 2.0 | 2444 | $2,300 | $0.94 | 22d | 1 | 1.09mi |
| 2439 Whitetail Dr Mesquite, TX | 4.0 | 2.5 | 2484 | $2,800 | $1.13 | 25d | 1 | 1.11mi |
| 1226 Rivercrest Dr Mesquite, TX | 5.0 | 3.0 | 3221 | $3,970 | $1.23 | 0d | 1 | 1.13mi |
| 2033 Spring Mills Rd Unit 1056398P Mesquite, TX | 4.0 | 2.5 | 1872 | $7,925 | $4.23 | 0d | 1 | 1.19mi |
| 2749 Ingram Cir Mesquite, TX | 3.0 | 2.0 | 1791 | $2,119 | $1.18 | 4d | 1 | 1.19mi |
| 2829 Kerrville Dr Mesquite, TX | 4.0 | 2.5 | 2349 | $2,700 | $1.15 | 5d | 1 | 1.32mi |
| 2621 Ash Crk Mesquite, TX | 3.0 | 2.0 | 1843 | $2,299 | $1.25 | 45d | 1 | 1.35mi |
| 2312 Gerber Dr Mesquite, TX | 4.0 | 2.5 | 2285 | $2,495 | $1.09 | 0d | 1 | 1.35mi |
| 2801 Sonora Ln Mesquite, TX | 4.0 | 2.0 | 1938 | $2,245 | $1.16 | 25d | 1 | 1.35mi |
| 2637 Austin Dr Mesquite, TX | 4.0 | 2.5 | 2291 | $3,350 | $1.46 | 45d | 1 | 1.49mi |
Listing history 31 events
-
2026-06-21pricedays on market $339,900 Active 65 DOM
-
2026-06-18days on market $349,900 Active 62 DOM
-
2026-06-17days on market $349,900 Active 61 DOM
-
2026-06-16days on market $349,900 Active 60 DOM
-
2026-06-15days on market $349,900 Active 59 DOM
-
2026-06-13days on market $349,900 Active 57 DOM
-
2026-06-13days on market $349,900 Active 56 DOM
-
2026-06-09days on market $349,900 Active 53 DOM
-
2026-06-08days on market $349,900 Active 52 DOM
-
2026-06-07days on market $349,900 Active 51 DOM
-
2026-06-04days on market $349,900 Active 48 DOM
-
2026-06-03days on market $349,900 Active 47 DOM
-
2026-06-02days on market $349,900 Active 46 DOM
-
2026-06-01days on market $349,900 Active 45 DOM
-
2026-05-31days on market $349,900 Active 44 DOM
-
2026-05-13price $349,900 1053-char remark
Show marketing remark (1053 chars)
Nestled on an expansive 0.289-acre lot, this beautifully remodeled five-bedroom home offers a modern elegance and comfortable living. Step inside to discover a light-filled interior, where a thoughtfully designed kitchen awaits. Sleek stainless steel appliances complement the quartz countertops, creating an inviting space for culinary endeavors. A generously sized pantry and a dedicated laundry area add to the home's practicality. Retreat to the expansive master suite featuring a spacious bathroom appointed with separate quartz-topped vanities, a separate shower and bathtub, and not one, but two walk-in closets. Each of the additional four bedrooms also has a walk-in closets, ensuring ample storage throughout. Extend your living outdoors to the covered patio, an ideal spot to savor the tranquil views of the surrounding trees. Beyond the beauty of the home itself, its prime location offers unparalleled convenience, with numerous shopping centers and major highways just moments away. No HOA Restrictions for rentals. Investors are welcome
-
2026-04-17$369,900 Active 1053-char remark
Show marketing remark (1053 chars)
Nestled on an expansive 0.289-acre lot, this beautifully remodeled five-bedroom home offers a modern elegance and comfortable living. Step inside to discover a light-filled interior, where a thoughtfully designed kitchen awaits. Sleek stainless steel appliances complement the quartz countertops, creating an inviting space for culinary endeavors. A generously sized pantry and a dedicated laundry area add to the home's practicality. Retreat to the expansive master suite featuring a spacious bathroom appointed with separate quartz-topped vanities, a separate shower and bathtub, and not one, but two walk-in closets. Each of the additional four bedrooms also has a walk-in closets, ensuring ample storage throughout. Extend your living outdoors to the covered patio, an ideal spot to savor the tranquil views of the surrounding trees. Beyond the beauty of the home itself, its prime location offers unparalleled convenience, with numerous shopping centers and major highways just moments away. No HOA Restrictions for rentals. Investors are welcome
-
2025-05-30price $379,900
-
2025-05-02$384,900 Active
-
2023-12-24historical $3,550
-
2023-11-10price $3,550
-
2023-10-31$3,250
-
2023-10-25historical $3,550
-
2023-09-23$3,550
-
2022-08-30soldstatus
-
2022-02-09soldstatus
-
2022-02-04soldstatus Sold
-
2022-01-10status Pending
-
2021-12-31historical Active Option Contract
-
2021-11-29$369,000 Active
-
2021-09-09soldstatus
ⓘ Source: listings_history table (triggers on properties + properties_extension) + one-shot
backfill from property_details.listing_events for pre-trigger history.
Tax reassessment forecast TX · Resets to sale price
- Current annual tax
- $8,079 · $673/mo
- Projected year-2 tax
- $8,079 · $673/mo
- Expected delta
- $0/yr ($0/mo · -0.0%)
ⓘ Screening estimate from a state-policy table — verify with the county assessor before closing.
Climate risk First Street
- Flood 3/10 Moderate FEMA zone X (unshaded) · 20% chance over 30 yrs
- Wildfire 3/10 Moderate
- Heat 8/10 Severe 7 d/yr ≥110°F today · 25 d/yr by 30 yrs out
- Wind 6/10 Major 27% chance of damaging wind over 30 yrs
- Air quality 2/10 Low 1 unhealthy d/yr today · 1 by 30 yrs out
Nearby sold comps map
Loading sold comps map…
Walkable amenities ~0.75 mi
Loading nearby amenities…
Taxation est. · year 1
- Rental income
- $38,182
- − Mortgage interest
- −$19,040
- − Property taxes
- −$8,079
- − Insurance
- −$1,700
- − Repairs & maintenance
- −$3,055
- − Management
- −$3,055
- − Depreciation
- −$9,888
- Taxable loss
- −$6,633
- Est. tax savings @ 24.0%
- +$1,592
- After-tax cash flow
- $588/yr
For passive investors: Depreciation is non-cash, so a rental often shows a tax loss while cash-flowing — sheltering income. Rental losses are passive: they offset passive income freely, and up to $25,000/yr can offset ordinary (W-2) income if you actively participate and your MAGI is under $100k (phasing out to $0 by $150k); unused losses carry forward. On sale, claimed depreciation is recaptured at up to 25%, and gains may owe capital-gains tax (a 1031 exchange can defer both). Figures are a year-1 estimate at your 24.0% rate — not tax advice; consult a CPA.
Schools (NCES district)
- District
- Mesquite ISD
- NCES district ID
- 4830390
- Math proficiency
- 35% ▼ -11.00%
- Reading proficiency
- 32% ▼ -7.00%
- Median HH income
- $49,372
- Composite
- 29.06/100
- National rank
- #6606
- State rank
- #536 of 826 in TX
Livability — Mesquite
- Score
- 70/100
- State rank
- #358
- US rank
- #7743
Category grades
Schools grade is shown separately in the Schools card above.
Census & demographics
- Census place
- Mesquite, TX
- County
- Dallas County · 2,612,404 people
- City population
- 150,788
- Metro
- Dallas-Fort Worth-Arlington, TX
- Population (ZIP)
- 29,788
- Household income
- $111,052
- Rent vs Own
- Severe rent burden
- 857.0
Population outlook (Dallas County) Hauer SSP2
- Today (2025)
- 2,979,839 people
- By 2030
- 3,191,823 · +7.1%
- By 2040
- 3,619,611 · +21.5%
- By 2050
- 4,026,915 · +35.1%
- By 2075
- 4,957,073 · +66.4%
- By 2100
- 5,508,725 · +84.9%
Race, ethnicity, and origin ACS 2023
- Neighborhood character
- Highly diverse neighborhood (Simpson 0.71)
- Race & ethnicity
- Black 39% Hispanic / Latino 32% Two or more races 21% White 16% Asian 5% Native American 1%
- Hispanic origin (detail)
- Mexican 27% Puerto Rican 1%
- Common ancestry
- Slovak 2% Italian 1%
- Foreign-born
- 22% · Canada, Vietnam
- Languages at home
- 64% English-only · Spanish 27% Tagalog/Filipino 3% Other Asian/Pacific 1%
Political lean MEDSL · Dallas
- 2024 margin
- Strong D (+22.2) · D 60.2% · R 38.0% · Other 1.8%
- 2008→2024 swing
- +6.9pp toward D · 2008: 15.3pp · 2024: 22.2pp
- All cycles
- 2024: D+22.2 2020: D+31.6 2016: D+26.2 2012: D+15.4 2008: D+15.3
Not yet ingested
- Civics
- —
Market trends
- HPI YoY
- ▼ -26.63%
- Current HPI
- 257.0959
- Rent YoY
- ▲ 0.07%
- Metro
- Dallas-Fort Worth-Arlington, TX
- State GDP YoY
- ▲ 3.95%
- F500 in state
- 110
Industry mix (Fortune 500 HQ in TX)
| Industry | F500 HQs | Revenue |
|---|---|---|
| Energy | 16 | $1,198B |
|
||
| Technology | 5 | $198B |
|
||
| Engineering / Construction | 4 | $72B |
|
||
| Energy Services | 3 | $60B |
|
||
| Utilities | 3 | $41B |
|
||
| Healthcare | 2 | $330B |
|
||
Price history
-5.2% since first listed16 events — show timeline
- 2026-05-13 Price Changed $349,900 NTREIS
- 2026-04-17 Listed $369,900 NTREIS
- 2025-05-30 Price Changed $379,900 NTREIS
- 2025-05-02 Listed $384,900 NTREIS
- 2023-12-24 Rental Removed $3,550 NTREIS
- 2023-11-10 Price Changed $3,550 NTREIS
- 2023-10-31 Listed for Rent $3,250 NTREIS
- 2023-10-25 Rental Removed $3,550 NTREIS
- 2023-09-23 Listed for Rent $3,550 NTREIS
- 2022-08-30 Sold (Public Records) — Public Records
- 2022-02-09 Sold (Public Records) — Public Records
- 2022-02-04 Sold (MLS) — NTREIS
- 2022-01-10 Pending — NTREIS
- 2021-12-31 Contingent — NTREIS
- 2021-11-29 Listed $369,000 NTREIS
- 2021-09-09 Sold (Public Records) — Public Records
Property tax history
+4.7%/yrLatest (2025): $8,079 · -5.1% YoY. Source: county tax records.
Cash-flow waterfall
monthlySold comps — $/sqft
last 12 mo · ≤1 miLoading sold comps…