135 Oak St · St. Johnsbury, VT
Flood risk 8/10 · Major
- FEMA flood zone
- X
- Chance of flooding over 30 yrs
- 0.99%
- Est. flood insurance / yr
- $507 – $1,088
Fire risk 1/10 · Minimal
- Est. fire insurance / yr
- $480 – $892
Heat risk 2/10 · Minimal
- Hot days now (above 90°F)
- 7 days/yr
- Hot days in 30 yrs
- 17 days/yr
Wind risk 2/10 · Minimal
- Chance of severe wind over 30 yrs
- 4.0%
Air-quality risk 2/10 · Minimal
- Unhealthy air days now
- 1 days/yr
- Unhealthy air days in 30 yrs
- 1 days/yr
Risk factors via First Street. Map © Google.
Why this score? — see what drove the D grade
The composite is a weighted blend of 9 inputs, each scored 0–100. Each bar is that input's sub-score; the figure is the points it added to the 100-point composite (weight × sub-score).
- 1% rule +9.6/10.0
- Cash flow +8.7/30.0
- ARV discount +7.5/15.0
- Schools +5.0/10.0
- Appreciation +3.8/10.0
- Rent growth +2.5/5.0
- Livability +2.5/5.0
- Condition / age +2.5/5.0
- DSCR +2.4/10.0
$89,831
🖨 Deal sheet (PDF) 📄 Offer letter ✓ Due diligence
Listing remarks MLS
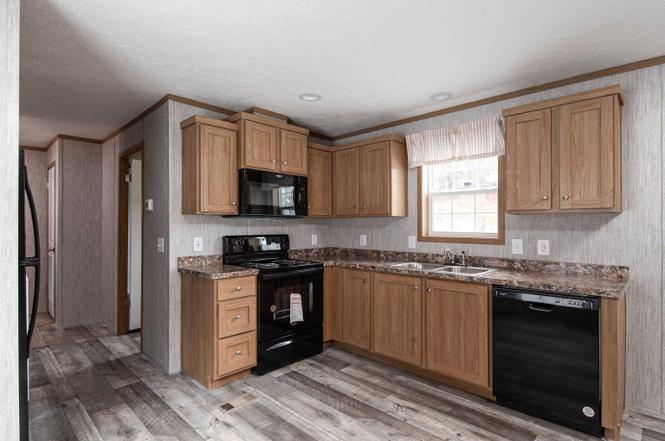
THIS 1975 SINGLEWIDE MOBILE HOME IS LOCATED IN A SMALL PARK AT THE END OF A DEAD END STREET AND IS READY TO MOVE INTO. LOT RENT IS $208 WHICH INCLUDES WATER, SEWER, RUBBISH, PLOWING. ALL APPLIANCES ARE INCLUDED. LEAVE HOME HERE OR MOVE TO YOUR LOCATION.
Key facts
- Move-in-ready option
- Open-concept layout
- Built 2024
Tags
Property features AI
Finance
- Other: Road frontage on paved public road; High-speed internet available; cable and telephone available
- HOA & community: Monthly park fee of $491 covering park fees, water, sewer and trash
Exterior
- Parking: Dirt driveway
- Utilities: Public water; Public sewer
- Home design: Single-wide manufactured home; New construction (2024); Cypress exterior color; Shingle (asphalt) roof; Manufactured home model H4 Colony DS 1007-P; Located in River Bend MHC (park-approved)
- Construction: Vinyl siding exterior; Built in 2024
- Exterior features: Level lot; Dirt driveway
Interior
- Kitchen: Electric stove; Microwave; Dishwasher
- Bedrooms: Bedroom (first level) — 13'4" x 10'; Bedroom (first level) — 13'4" x 8'
- Bathrooms: Full bath (first level)
- Heating & cooling: Propane forced-air heating
- Interior features: 3 total rooms; 1 full bathroom
- Laundry & utility: Energy Star washer; Energy Star dryer
Neighborhood map
What this means for you Summary
Snapshot
- This is a 2-bed/1.0-bath manufactured listed at $90k.
Deal economics
- At list price, monthly cash flow is $-142 ($-2k/yr) — negative.
- To cash-flow at today's rent, offer at most $69k (22.8% below list).
- Meets the 1% rule at list price ($1k rent vs $90k).
- Recommended offer: $69k (22.8% below list) — sets the bar for cash-flow.
- Cap rate 5.3% vs local median 3.4% in St. Johnsbury — top-decile yield for the area; either an underpriced asset or a hidden risk that comps aren't pricing in. Stress-test before assuming the spread holds.
Location & tenants
- Location reads: area grade D — affects rentability + tenant quality, not the cash-flow math above.
- Zoned schools: St. Johnsbury School (math 19% / reading 37%, grade F, #149 of 192 statewide, top 78%, 702 students, 52% FRL).
- Market conditions: 66 active listings in the ZIP; 112 units permitted in Caledonia County in 2024 (15 in 5+ unit buildings).
Forward outlook
- Local home prices are declining (-2.4%/yr); year-one equity from $621 of loan paydown is wiped out by about $2k of value loss. Plan a longer hold.
- Caledonia County population projected at -20% by 2050 — secular population decline; favor cash flow + early exit over multi-decade hold.
Negotiation context
- It's been on market 464 days — a 12% lower offer ($79k) is reasonable based on typical stale-listing flexibility.
- 2 sale attempts since 24y ago with the ask held roughly flat each time — persistent listings suggest the price (not the market) is what's stuck; bring a comps-based counter.
- Current owner paid $6k; list at $90k implies a 1349% gain — meaningful room to come down on a strong offer.
Risks & watch-outs
- Watch-outs: flood insurance adds $66/mo; HOA is 37% of rent.
- Climate carrying-cost: severe flood risk — expect insurance premiums to compound above CPI over the hold.
Questions for the listing agent
- What do current leases actually rent for vs. the listed asking? Can we see a recent rent roll and the last 12 months of T-12 income?
- It's been on market 464 days. Have you received any prior offers? Is the seller open to a 23% concession, seller financing, or rate buy-down credit?
- What's the actual annual flood-insurance premium (NFIP or private), and is the property in a SFHA with mandatory coverage?
- What does the HOA fee cover, when was the last increase, and are there any pending special assessments or reserve-fund shortfalls?
- Why hasn't it sold? Are there any deal-killer items the seller is aware of (foundation, flood, title, zoning, code violations)?
- Is there a deadline driving the sale (1031 exchange, divorce, estate, relocation)? That informs how much negotiation room exists.
- The area grade is low — what's the realistic commute time and amenity access for the typical tenant pool here? Any planned neighborhood developments (good or bad) we should know about?
- What's the average days-on-market for RENTAL listings here right now (not sales)? A rising rental-DOM trend means longer vacancies and softer asking-rent achievability than the comps imply.
- What's the recent tenant-quality profile in this submarket — average credit score on applications, eviction rate, late-payment / NSF rate, and stable-employment percentage? A property-management company in the area should have these aggregated.
- How much new for-sale + rental construction is in the pipeline within 1–3 miles? Heavy new supply typically softens prices + rents 12–24 months out; constrained supply supports both.
Investment metrics
- 1% rule
- 1.46% ✓
- Cap rate
- 5.29%
- Cash-on-cash
- -3.59%
- DSCR
- 0.84
- GRM
- 5.7
CMA / ARV
No comps found within radius.
Projected returns pro-forma
-2.41% appreciation · 3.0% rent growth · sell at horizon
- IRR
- -22.8%
- Equity multiple
- 0.17×
- Total profit
- $-20,989
- Equity at exit
- $15,768
- IRR
- -16.0%
- Equity multiple
- -0.05×
- Total profit
- $-26,478
- Equity at exit
- $11,907
Cash invested: $25,153 (down + closing). Projections, not guarantees.
Landlord ↔ Tenant lean methodology
- Overall (STATE)
- 41 Moderately Tenant-Leaning
- State Vermont
- 41 Moderately Tenant-Leaning · D+15
- County
- — inherits STATE
- City
- — inherits STATE
ZIP-level market 05819
- Home prices YoY
- -0.8%
- Active inventory
- 66
- Price-to-rent
- 5.7×
Monthly cashflow live
- Estimated rent
- $1,312 medium interval (Pro) →
- Mortgage (P&I)
- −$471
- Tax est. 1.5%
- −$112 /mo · $1,347/yr
- Insurance
- −$37
- Flood insurance flood zone
- −$66 /mo · $798/yr
- HOA
- −$491
- Vacancy / Maint / Mgmt
- −$276
- Net cashflow
- $-142
Break-even live
Sensitivity live
| Price | -10% $-80 | -5% $-111 | +0% $-142 | +5% $-173 | +10% $-204 |
|---|---|---|---|---|---|
| Rent | -10% $-245 | -5% $-194 | +0% $-142 | +5% $-90 | +10% $-38 |
| Rate | -1.0pp $-96 | -0.5pp $-119 | base $-142 | +0.5pp $-165 | +1.0pp $-189 |
UW: 25.0% down · 7.5% · 30yr · 1.5% tax · 5.0% vac · 8.0% maint · 8.0% mgmt
Financing live
Cash to close
- Down payment
- $22,458
- Closing costs
- $2,695
- Reserves months
- —
- Total cash needed
- —
Loan-product check · same deal, 3 products live
Conventional
25% down · 7.5% · 30yr
- Down + closing
- —
- Monthly P&I
- —
- Monthly cashflow
- —
- DSCR
- —
- Eligible?
- —
Personal DTI + credit; lowest rate.
DSCR
20% down · 8.5% · 30yr
- Down + closing
- —
- Monthly P&I
- —
- Monthly cashflow
- —
- DSCR
- —
- Eligible?
- —
No personal income docs; deal must DSCR.
Hard money
10% down · 12.0% · 12mo
- Down + closing
- —
- Monthly P&I
- —
- Monthly cashflow
- —
- DSCR
- —
- Eligible?
- —
Short-term bridge; refi at stabilization.
HOA detail
- Monthly dues
- $491 · $5,892/yr
- Likely covers
- watersewer
Listing history 20 events
-
2026-06-21days on market $89,831 Active 464 DOM
-
2026-06-21days on market $89,831 Active 463 DOM
-
2026-06-18days on market $89,831 Active 461 DOM
-
2026-06-17days on market $89,831 Active 460 DOM
-
2026-06-16days on market $89,831 Active 459 DOM
-
2026-06-15days on market $89,831 Active 458 DOM
-
2026-06-15days on market $89,831 Active 457 DOM
-
2026-06-13days on market $89,831 Active 456 DOM
-
2026-06-12days on market $89,831 Active 455 DOM
-
2026-06-09days on market $89,831 Active 452 DOM
-
2026-06-08days on market $89,831 Active 451 DOM
-
2026-06-08days on market $89,831 Active 450 DOM
-
2026-06-07days on market $89,831 Active 449 DOM
-
2026-06-03days on market $89,831 Active 446 DOM
-
2026-06-02days on market $89,831 Active 445 DOM
-
2026-06-01days on market $89,831 Active 444 DOM
-
2026-05-31days on market $89,831 Active 443 DOM
-
2025-03-14$89,831 Active
-
2002-06-28soldstatus $6,200 253-char remark
Show marketing remark (253 chars)
THIS 1975 SINGLEWIDE MOBILE HOME IS LOCATED IN A SMALL PARK AT THE END OF A DEAD END STREET AND IS READY TO MOVE INTO. LOT RENT IS $208 WHICH INCLUDES WATER, SEWER, RUBBISH, PLOWING. ALL APPLIANCES ARE INCLUDED. LEAVE HOME HERE OR MOVE TO YOUR LOCATION.
-
2002-01-10$8,000 253-char remark
Show marketing remark (253 chars)
THIS 1975 SINGLEWIDE MOBILE HOME IS LOCATED IN A SMALL PARK AT THE END OF A DEAD END STREET AND IS READY TO MOVE INTO. LOT RENT IS $208 WHICH INCLUDES WATER, SEWER, RUBBISH, PLOWING. ALL APPLIANCES ARE INCLUDED. LEAVE HOME HERE OR MOVE TO YOUR LOCATION.
ⓘ Source: listings_history table (triggers on properties + properties_extension) + one-shot
backfill from property_details.listing_events for pre-trigger history.
Climate risk First Street
- Flood 8/10 Severe FEMA zone X · 99% chance over 30 yrs
- Wildfire 1/10 Low
- Heat 2/10 Low 7 d/yr ≥90°F today · 17 d/yr by 30 yrs out
- Wind 2/10 Low 4% chance of damaging wind over 30 yrs
- Air quality 2/10 Low 1 unhealthy d/yr today · 1 by 30 yrs out
Nearby sold comps map
Loading sold comps map…
Walkable amenities ~0.75 mi
Loading nearby amenities…
Taxation est. · year 1
- Rental income
- $15,745
- − Mortgage interest
- −$5,032
- − Property taxes
- −$1,347
- − Insurance
- −$1,247
- − Repairs & maintenance
- −$1,260
- − Management
- −$1,260
- − HOA
- −$5,892
- − Depreciation
- −$2,613
- Taxable loss
- −$2,906
- Est. tax savings @ 24.0%
- +$697
- After-tax cash flow
- $-1,003/yr
For passive investors: Depreciation is non-cash, so a rental often shows a tax loss while cash-flowing — sheltering income. Rental losses are passive: they offset passive income freely, and up to $25,000/yr can offset ordinary (W-2) income if you actively participate and your MAGI is under $100k (phasing out to $0 by $150k); unused losses carry forward. On sale, claimed depreciation is recaptured at up to 25%, and gains may owe capital-gains tax (a 1031 exchange can defer both). Figures are a year-1 estimate at your 24.0% rate — not tax advice; consult a CPA.
Schools (NCES district)
No district data.
Livability — St. Johnsbury
No livability data for this city. (Only ~50 U.S. cities are tracked.)
Census & demographics
- Census place
- St. Johnsbury, VT
- Population (ZIP)
- 9,323
Population outlook (Caledonia County) Hauer SSP2
- Today (2025)
- 29,828 people
- By 2030
- 28,820 · -3.4%
- By 2040
- 26,262 · -12.0%
- By 2050
- 23,780 · -20.3%
- By 2075
- 18,516 · -37.9%
- By 2100
- 13,647 · -54.2%
Race, ethnicity, and origin ACS 2023
- Neighborhood character
- Predominantly White (92%)
- Race & ethnicity
- White 92% Two or more races 5% Hispanic / Latino 2%
- Common ancestry
- Lithuanian 11% Slovak 6% Serbian 3%
- Foreign-born
- 2% · Canada
- Languages at home
- 93% English-only · French/Haitian/Cajun 3% Other Asian/Pacific 2% Spanish 1%
Political lean MEDSL · Caledonia
- 2024 margin
- D (+12.4) · D 54.5% · R 42.0% · Other 3.5%
- 2008→2024 swing
- -10.8pp toward R · 2008: 23.3pp · 2024: 12.4pp
- All cycles
- 2024: D+12.4 2020: D+15.2 2016: D+7.0 2012: D+22.9 2008: D+23.3
Not yet ingested
- Civics
- —
Market trends
- HPI YoY
- ▼ -2.41%
- Current HPI
- 291.8894
- Rent YoY
- —
- Metro
- —
- State GDP YoY
- —
- F500 in state
- 0
Price history
+1022.9% since first listed3 events — show timeline
- 2025-03-14 Listed $89,831 PrimeMLS
- 2002-06-28 Sold (MLS) $6,200 PrimeMLS
- 2002-01-10 Listed $8,000 PrimeMLS
Cash-flow waterfall
monthlySold comps — $/sqft
last 12 mo · ≤1 miLoading sold comps…