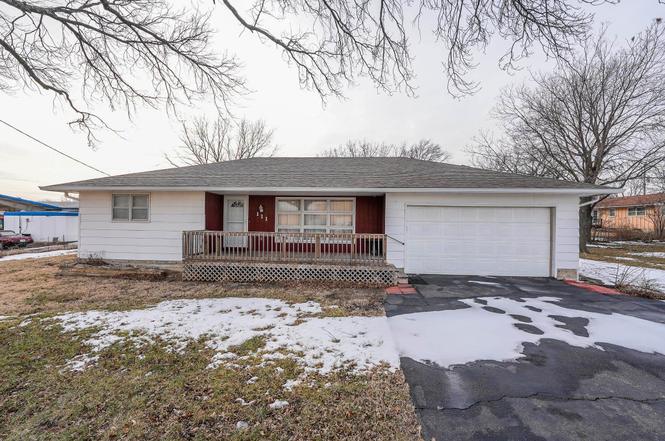
111 S Jefferson St · Eureka, KS
Flood risk 1/10 · Minimal
- FEMA flood zone
- X
- Chance of flooding over 30 yrs
- 0.0%
- Est. flood insurance / yr
- $473 – $860
Fire risk 5/10 · Moderate
- Est. fire insurance / yr
- $1,154 – $2,142
Heat risk 5/10 · Moderate
- Hot days now (above 108°F)
- 7 days/yr
- Hot days in 30 yrs
- 18 days/yr
Wind risk 2/10 · Minimal
- Chance of severe wind over 30 yrs
- 1.0%
Air-quality risk 3/10 · Minor
- Unhealthy air days now
- 3 days/yr
- Unhealthy air days in 30 yrs
- 4 days/yr
Risk factors via First Street. Map © Google.
Why this score? — see what drove the D grade
The composite is a weighted blend of 9 inputs, each scored 0–100. Each bar is that input's sub-score; the figure is the points it added to the 100-point composite (weight × sub-score).
- Appreciation +9.8/10.0
- Cash flow +8.9/30.0
- ARV discount +7.5/15.0
- Livability +3.5/5.0
- Schools +2.8/10.0
- 1% rule +2.7/10.0
- DSCR +2.5/10.0
- Rent growth +2.5/5.0
- Condition / age +2.5/5.0
$135,000
🖨 Deal sheet (PDF) 📄 Offer letter ✓ Due diligence
Key facts
- 0.34 acre lot
- 2 garage spots
- Built 1964
Property features AI
Finance
- Other:
- Financial info:
- HOA & community:
Exterior
- Parking: 2-car garage
- Security:
- Utilities: Public water; Sewer available; Natural gas available
- Home design: Single-family onsite-built home
- Construction: Composition roof; Full foundation (no egress windows)
- Exterior features: One-level property; Covered patio; Storage structure
Interior
- Kitchen: Dishwasher; Refrigerator; Range
- Bedrooms:
- Flooring:
- Bathrooms: 1 full bathroom; 1 half bathroom
- Heating & cooling: Forced air heating (natural gas); Central electric air conditioning
- Interior features: Unfinished basement; Covered patio; Storage structure; Trash compactor
- Laundry & utility: Main floor laundry in a separate room with sink and 220V outlet
Neighborhood map
What this means for you Summary
Snapshot
- This is a 2-bed/1.0-bath single-family listed at $135k.
Deal economics
- At list price, monthly cash flow is $-109 ($-1k/yr) — negative.
- To cash-flow at today's rent, offer at most $119k (11.7% below list).
- To meet the 1% rule (rent ≥ 1% of price), the offer needs to be $104k (22.7% below list).
- Recommended offer: $104k (22.7% below list) — sets the bar for 1% rule.
Location & tenants
- Location reads 69/100 on livability (#192 in KS) — a middle-class / working-renter tenant base. Strengths: cost of living A+, health & safety A+, housing A-; Watch: amenities F, commute F, employment F.
- Eureka (rural): math 28% / reading 39% proficiency, ranked #86 of 169 in KS (top 51%) — families likely to look elsewhere, expect single-tenant / working-renter base with shorter leases.
- Zoned schools: Marshall Elementary School (math 37% / reading 42%, grade F, #321 of 684 statewide, top 52%, 307 students, 67% FRL); Eureka Jr/Sr High (math 22% / reading 37%, grade F, #60 of 327 statewide, top 24%, 252 students, 56% FRL).
- Market conditions: 24 active listings in the ZIP; 3 units permitted in Greenwood County in 2024 (0 in 5+ unit buildings).
Forward outlook
- In year one you build about $14k of equity ($933 loan paydown + $13k appreciation (9.5% local appreciation)).
- Greenwood County population projected at -35% by 2050 — secular population decline; favor cash flow + early exit over multi-decade hold.
- By year 3, paydown + projected appreciation supports a ~$35k cash-out refi (75% LTV) — recoverable capital for the next deal without selling this one.
Negotiation context
- It's been on market 119 days — a 9% lower offer ($123k) is reasonable based on typical stale-listing flexibility.
- 5 sale attempts since 16y ago; this cycle's ask has dropped $10k (7%) from the opening price — seller is motivated, your offer sets the floor, not the list.
- Current owner paid $51k; list at $135k implies a 165% gain — meaningful room to come down on a strong offer.
Risks & watch-outs
- Climate carrying-cost: moderate wildfire risk; extreme-heat days projected 7→18/yr by 2055 (HVAC capex compounding) — expect insurance premiums to compound above CPI over the hold.
Questions for the listing agent
- What do current leases actually rent for vs. the listed asking? Can we see a recent rent roll and the last 12 months of T-12 income?
- It's been on market 119 days. Have you received any prior offers? Is the seller open to a 23% concession, seller financing, or rate buy-down credit?
- Built in 1964 — when were the roof, HVAC, electrical panel, plumbing, and water heater last replaced?
- Why hasn't it sold? Are there any deal-killer items the seller is aware of (foundation, flood, title, zoning, code violations)?
- Is there a deadline driving the sale (1031 exchange, divorce, estate, relocation)? That informs how much negotiation room exists.
- Schools are F-rated, which usually means shorter tenancies and higher turnover. Who's the typical renter profile here, and what's been the actual vacancy rate?
- The area grade is low — what's the realistic commute time and amenity access for the typical tenant pool here? Any planned neighborhood developments (good or bad) we should know about?
- What's the average days-on-market for RENTAL listings here right now (not sales)? A rising rental-DOM trend means longer vacancies and softer asking-rent achievability than the comps imply.
- What's the recent tenant-quality profile in this submarket — average credit score on applications, eviction rate, late-payment / NSF rate, and stable-employment percentage? A property-management company in the area should have these aggregated.
- How much new for-sale + rental construction is in the pipeline within 1–3 miles? Heavy new supply typically softens prices + rents 12–24 months out; constrained supply supports both.
Investment metrics
- 1% rule
- 0.77% ✗
- Cap rate
- 5.33%
- Cash-on-cash
- -3.45%
- DSCR
- 0.85
- GRM
- 10.8
CMA / ARV
No comps found within radius.
Projected returns pro-forma
9.51% appreciation · 3.0% rent growth · sell at horizon
- IRR
- 20.8%
- Equity multiple
- 2.64×
- Total profit
- $62,066
- Equity at exit
- $116,780
- IRR
- 18.9%
- Equity multiple
- 5.95×
- Total profit
- $187,159
- Equity at exit
- $246,864
Cash invested: $37,800 (down + closing). Projections, not guarantees.
Landlord ↔ Tenant lean methodology
- Overall (STATE)
- 83 Strongly Landlord-Friendly
- State Kansas
- 83 Strongly Landlord-Friendly · R+10
- County
- — inherits STATE
- City
- — inherits STATE
ZIP-level market 67045
- Home prices YoY
- 5.5%
- Active inventory
- 24
- Price-to-rent
- 10.8×
Monthly cashflow live
- Estimated rent
- $1,043 medium interval (Pro) →
- Mortgage (P&I)
- −$708
- Tax est. 1.5%
- −$169 /mo · $2,025/yr
- Insurance
- −$56
- HOA
- −$0
- Vacancy / Maint / Mgmt
- −$219
- Net cashflow
- $-109
Break-even live
Sensitivity live
| Price | -10% $-15 | -5% $-62 | +0% $-109 | +5% $-155 | +10% $-202 |
|---|---|---|---|---|---|
| Rent | -10% $-191 | -5% $-150 | +0% $-109 | +5% $-68 | +10% $-26 |
| Rate | -1.0pp $-41 | -0.5pp $-74 | base $-109 | +0.5pp $-144 | +1.0pp $-179 |
UW: 25.0% down · 7.5% · 30yr · 1.5% tax · 5.0% vac · 8.0% maint · 8.0% mgmt
Financing live
Cash to close
- Down payment
- $33,750
- Closing costs
- $4,050
- Reserves months
- —
- Total cash needed
- —
Loan-product check · same deal, 3 products live
Conventional
25% down · 7.5% · 30yr
- Down + closing
- —
- Monthly P&I
- —
- Monthly cashflow
- —
- DSCR
- —
- Eligible?
- —
Personal DTI + credit; lowest rate.
DSCR
20% down · 8.5% · 30yr
- Down + closing
- —
- Monthly P&I
- —
- Monthly cashflow
- —
- DSCR
- —
- Eligible?
- —
No personal income docs; deal must DSCR.
Hard money
10% down · 12.0% · 12mo
- Down + closing
- —
- Monthly P&I
- —
- Monthly cashflow
- —
- DSCR
- —
- Eligible?
- —
Short-term bridge; refi at stabilization.
Listing history 30 events
-
2026-06-22days on market $135,000 Active 119 DOM
-
2026-06-21days on market $135,000 Active 118 DOM
-
2026-06-21days on market $135,000 Active 117 DOM
-
2026-06-18days on market $135,000 Active 115 DOM
-
2026-06-17days on market $135,000 Active 114 DOM
-
2026-06-16days on market $135,000 Active 113 DOM
-
2026-06-15days on market $135,000 Active 112 DOM
-
2026-06-13days on market $135,000 Active 110 DOM
-
2026-06-12days on market $135,000 Active 109 DOM
-
2026-06-09days on market $135,000 Active 106 DOM
-
2026-06-08days on market $135,000 Active 105 DOM
-
2026-06-07days on market $135,000 Active 104 DOM
-
2026-06-05pricedays on market $135,000 Active 102 DOM
-
2026-06-04days on market $140,000 Active 100 DOM
-
2026-06-02days on market $140,000 Active 99 DOM
-
2026-06-01days on market $140,000 Active 98 DOM
-
2026-05-31days on market $140,000 Active 97 DOM
-
2026-05-31days on market $140,000 Active 96 DOM
-
2026-03-18price $140,000
-
2026-02-23$145,000 Active
-
2026-01-22historical
-
2025-10-16price $150,000
-
2025-09-25price $160,000
-
2025-08-01$165,000 Active
-
2013-04-03$89,500
-
2011-07-05historical
-
2011-05-04$89,500
-
2011-01-24historical
-
2010-07-23$89,500
-
2005-07-01soldstatus $51,000
ⓘ Source: listings_history table (triggers on properties + properties_extension) + one-shot
backfill from property_details.listing_events for pre-trigger history.
Climate risk First Street
- Flood 1/10 Low FEMA zone X · 0% chance over 30 yrs
- Wildfire 5/10 Major
- Heat 5/10 Major 7 d/yr ≥108°F today · 18 d/yr by 30 yrs out
- Wind 2/10 Low 100% chance of damaging wind over 30 yrs
- Air quality 3/10 Moderate 3 unhealthy d/yr today · 4 by 30 yrs out
Nearby sold comps map
Loading sold comps map…
Walkable amenities ~0.75 mi
Loading nearby amenities…
Taxation est. · year 1
- Rental income
- $12,520
- − Mortgage interest
- −$7,562
- − Property taxes
- −$2,025
- − Insurance
- −$675
- − Repairs & maintenance
- −$1,002
- − Management
- −$1,002
- − Depreciation
- −$3,927
- Taxable loss
- −$3,673
- Est. tax savings @ 24.0%
- +$881
- After-tax cash flow
- $-423/yr
For passive investors: Depreciation is non-cash, so a rental often shows a tax loss while cash-flowing — sheltering income. Rental losses are passive: they offset passive income freely, and up to $25,000/yr can offset ordinary (W-2) income if you actively participate and your MAGI is under $100k (phasing out to $0 by $150k); unused losses carry forward. On sale, claimed depreciation is recaptured at up to 25%, and gains may owe capital-gains tax (a 1031 exchange can defer both). Figures are a year-1 estimate at your 24.0% rate — not tax advice; consult a CPA.
Schools (NCES district)
- District
- Eureka
- NCES district ID
- 2006120
- Math proficiency
- 28% ▼ -1.00%
- Reading proficiency
- 39% ▲ 1.00%
- Median HH income
- $37,104
- Composite
- 27.83/100
- National rank
- #6885
- State rank
- #86 of 169 in KS
Livability — Eureka
- Score
- 69/100
- State rank
- #192
- US rank
- #8682
Category grades
Schools grade is shown separately in the Schools card above.
Census & demographics
- Census place
- Eureka, KS
- Population (ZIP)
- 3,119
Population outlook (Greenwood County) Hauer SSP2
- Today (2025)
- 5,505 people
- By 2030
- 5,103 · -7.3%
- By 2040
- 4,287 · -22.1%
- By 2050
- 3,576 · -35.0%
- By 2075
- 2,370 · -56.9%
- By 2100
- 1,459 · -73.5%
Race, ethnicity, and origin ACS 2023
- Neighborhood character
- Predominantly White (91%)
- Race & ethnicity
- White 91% Hispanic / Latino 5% Two or more races 4% Native American 2%
- Common ancestry
- Lithuanian 4% Slovak 2% Iranian 2%
- Foreign-born
- 0%
- Languages at home
- 98% English-only · Spanish 1%
Political lean MEDSL · Greenwood
- 2024 margin
- Solid R (+61.0) · D 18.8% · R 79.7% · Other 1.5%
- 2008→2024 swing
- -17.2pp toward R · 2008: -43.8pp · 2024: -61.0pp
- All cycles
- 2024: R+61.0 2020: R+60.8 2016: R+59.1 2012: R+49.3 2008: R+43.8
Not yet ingested
- Civics
- —
Market trends
- HPI YoY
- ▲ 9.51%
- Current HPI
- 184.0175
- Rent YoY
- —
- Metro
- —
- State GDP YoY
- —
- F500 in state
- 0
Price history
+174.5% since first listed12 events — show timeline
- 2026-03-18 Price Changed $140,000 SCKMLS as Distributed by MLS Grid
- 2026-02-23 Listed $145,000 SCKMLS as Distributed by MLS Grid
- 2026-01-22 Listing Removed — SCKMLS as Distributed by MLS Grid
- 2025-10-16 Price Changed $150,000 SCKMLS as Distributed by MLS Grid
- 2025-09-25 Price Changed $160,000 SCKMLS as Distributed by MLS Grid
- 2025-08-01 Listed $165,000 SCKMLS as Distributed by MLS Grid
- 2013-04-03 Listed $89,500 SCKMLS as Distributed by MLS Grid
- 2011-07-05 Listing Removed — SCKMLS as Distributed by MLS Grid
- 2011-05-04 Listed $89,500 SCKMLS as Distributed by MLS Grid
- 2011-01-24 Listing Removed — SCKMLS as Distributed by MLS Grid
- 2010-07-23 Listed $89,500 SCKMLS as Distributed by MLS Grid
- 2005-07-01 Sold (Public Records) $51,000 Public Records
Cash-flow waterfall
monthlySold comps — $/sqft
last 12 mo · ≤1 miLoading sold comps…