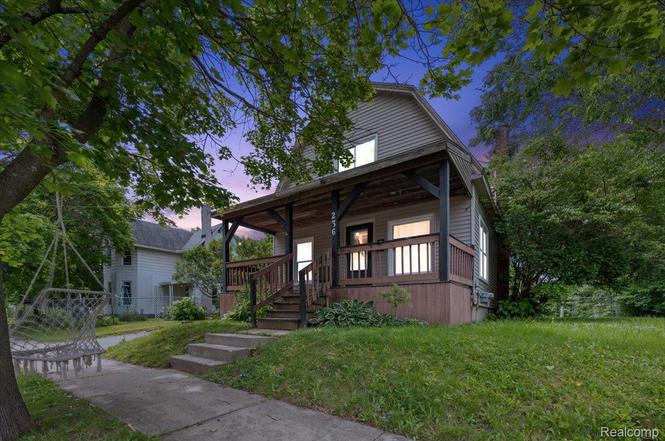
236 Lynn St · Flushing, MI
Flood risk 1/10 · Minimal
- FEMA flood zone
- X (unshaded)
- Chance of flooding over 30 yrs
- 0.0%
- Est. flood insurance / yr
- $473 – $860
Fire risk 1/10 · Minimal
- Est. fire insurance / yr
- $784 – $1,456
Heat risk 2/10 · Minimal
- Hot days now (above 96°F)
- 7 days/yr
- Hot days in 30 yrs
- 15 days/yr
Wind risk 2/10 · Minimal
- Chance of severe wind over 30 yrs
- —
Air-quality risk 2/10 · Minimal
- Unhealthy air days now
- 1 days/yr
- Unhealthy air days in 30 yrs
- 3 days/yr
Risk factors via First Street. Map © Google.
Why this score? — see what drove the B- grade
The composite is a weighted blend of 9 inputs, each scored 0–100. Each bar is that input's sub-score; the figure is the points it added to the 100-point composite (weight × sub-score).
- Cash flow +25.9/30.0
- ARV discount +13.5/15.0
- DSCR +8.7/10.0
- 1% rule +7.2/10.0
- Livability +3.8/5.0
- Schools +2.9/10.0
- Rent growth +2.5/5.0
- Condition / age +2.5/5.0
- Appreciation +0.0/10.0
$180,000
🖨 Deal sheet 📄 Offer letter ✓ Due diligence
Listing remarks MLS
Welcome home to this charming 4-bedroom, 1-bath residence located on a quiet street in the heart of downtown Flushing! Situated within the highly desirable Flushing School District, this well-maintained home offers a spacious and functional layout with three bedrooms on the upper level and one conveniently located on the main floor. The updated kitchen features ample cabinetry, a large eat-in dining area, and all appliances included, making it truly move-in ready. Enjoy additional living space with both a comfortable family room and a separate dining room, perfect for everyday living and entertaining. Outside, you'll find a large fenced backyard ideal for pets, play, or outdoor gatherings, along with a 2-car detached garage for extra storage and parking. Relax and unwind on the inviting oversized front porch, perfect for enjoying quiet evenings in this peaceful neighborhood. Additional features include a Michigan basement, updated kitchen, and a prime location just minutes from downtown shopping, dining, parks, and schools. Don't miss this opportunity to own a spacious home in one of Flushing's most sought-after locations!
Key facts
- Michigan basement
- Updated kitchen
- Prime location
Tags
Property features AI
Finance
- Other: Pets allowed
Exterior
- Parking: Detached 1-car garage; Driveway; Garage faces front
- Utilities: Public water; Public sewer
- Home design: Single-family residence; One and one-half stories; Ground-level entry with steps; Vinyl siding exterior; Composition roof
- Construction: Built with vinyl siding; Block foundation
- Exterior features: Lighting; Deck; Porch; Backyard fencing (fenced); Paved road access
Interior
- Kitchen: Dishwasher; Microwave; Free-standing electric range; Free-standing refrigerator; Stainless steel appliances
- Bathrooms: 1 full bathroom
- Heating & cooling: Central air conditioning; Forced-air heating; Natural gas heating
- Interior features: High-speed internet; Smart thermostat; Unfinished basement
- Laundry & utility: Gas water heater
Neighborhood map
What this means for you Summary
Snapshot
- This is a 4-bed/1.0-bath single-family listed at $180k.
Deal economics
- At list price, monthly cash flow is $443 ($5k/yr) — positive.
- The deal already cash-flows at list — no discount required.
- Meets the 1% rule at list price ($2k rent vs $180k).
- Cap rate 9.2% vs local median 3.4% in Flushing — top-decile yield for the area; either an underpriced asset or a hidden risk that comps aren't pricing in. Stress-test before assuming the spread holds.
Location & tenants
- Location reads 76/100 on livability (#140 in MI, #3,431 nationally) — a middle-class / working-renter tenant base. Strengths: crime A+, cost of living A+, housing A+; Watch: amenities F, commute F, health & safety F.
- Flushing Community Schools (suburban): math 25% / reading 41% proficiency, ranked #295 of 540 in MI (top 55%) — families likely to look elsewhere, expect single-tenant / working-renter base with shorter leases.
- Market conditions: 156 active listings in the ZIP; 1 comparable units currently listed for rent nearby; 419 units permitted in Genesee County in 2024 (68 in 5+ unit buildings).
Forward outlook
- Local home prices are declining (-3.0%/yr); year-one equity from $1k of loan paydown is wiped out by about $5k of value loss. Plan a longer hold.
- Genesee County population projected at -27% by 2050 — secular population decline; favor cash flow + early exit over multi-decade hold.
Negotiation context
- Only 1 days on market — expect competitive offers; lowballing is unlikely to land.
- 25 sale attempts since 126y ago with the ask held roughly flat each time — persistent listings suggest the price (not the market) is what's stuck; bring a comps-based counter.
- Current owner paid $115k; list at $180k implies a 57% gain — meaningful room to come down on a strong offer.
Risks & watch-outs
- Watch-outs: built in 1910 — expect roof / HVAC / electrical / plumbing capex.
Questions for the listing agent
- Built in 1910 — when were the roof, HVAC, electrical panel, plumbing, and water heater last replaced?
- Is there a deadline driving the sale (1031 exchange, divorce, estate, relocation)? That informs how much negotiation room exists.
- Schools are B-rated — typically a magnet for longer-tenancy family renters. What's the average tenant stay here, and is there a school-zone premium baked into asking?
- What's the average days-on-market for RENTAL listings here right now (not sales)? A rising rental-DOM trend means longer vacancies and softer asking-rent achievability than the comps imply.
- What's the recent tenant-quality profile in this submarket — average credit score on applications, eviction rate, late-payment / NSF rate, and stable-employment percentage? A property-management company in the area should have these aggregated.
- How much new for-sale + rental construction is in the pipeline within 1–3 miles? Heavy new supply typically softens prices + rents 12–24 months out; constrained supply supports both.
Investment metrics
- 1% rule
- 1.22% ✓
- Cap rate
- 9.25%
- Cash-on-cash
- 10.55%
- DSCR
- 1.47
- GRM
- 6.8
CMA / ARV
- ARV (on-the-fly)
- $207,746
- Comps found
- 12
Show comp detail 12 sales within ~0.75 mi
| Address | Dist | Beds/Ba | Sqft | Sold | Price | $/sf | Match |
|---|---|---|---|---|---|---|---|
| 220 Oak St | 0.08mi | 3/1.0 (-1) | 1,600 (+2%) | 16mo | $170,000 | $106 | 74 |
| 214 Terrace St | 0.17mi | 4/2.0 | 1,600 (+2%) | 13mo | $223,000 | $139 | 73 |
| 527 Spring Ln | 0.41mi | 3/1.5 (-1) | 1,444 (-8%) | 0mo | $230,000 | $159 | 61 |
| 115 Seymour Rd | 0.24mi | 3/1.5 (-1) | 1,685 (+8%) | 16mo | $160,000 | $95 | 55 |
| 308 N Seymour Rd | 0.50mi | 3/1.5 (-1) | 1,460 (-6%) | 6mo | $170,000 | $116 | 54 |
| 538 Autumn Dr | 0.49mi | 3/1.5 (-1) | 1,440 (-8%) | 6mo | $235,000 | $163 | 52 |
| 537 Spring Ln | 0.43mi | 4/1.5 | 1,688 (+8%) | 15mo | $219,900 | $130 | 52 |
| 112 S Mckinley Rd | 0.44mi | 3/2.0 (-1) | 1,645 (+5%) | 12mo | $110,000 | $67 | 51 |
| 218 N Maple St | 0.43mi | 3/1.0 (-1) | 1,732 (+11%) | 12mo | $230,000 | $133 | 47 |
| 517 Autumn Dr | 0.42mi | 3/1.5 (-1) | 1,340 (-14%) | 10mo | $220,000 | $164 | 42 |
| 114 E Henry St | 0.49mi | 3/1.5 (-1) | 1,354 (-13%) | 15mo | $125,000 | $92 | 36 |
| 500 Windy Blf | 0.55mi | 3/2.0 (-1) | 1,350 (-14%) | 9mo | $276,000 | $204 | 35 |
Match score weights: distance 35% · size 25% · config 20% · recency 20%. Top-matched comps best support the ARV.
Projected returns pro-forma
-3.0% appreciation · 3.0% rent growth · sell at horizon
- IRR
- -0.5%
- Equity multiple
- 0.98×
- Total profit
- $-869
- Equity at exit
- $26,839
- IRR
- 9.2%
- Equity multiple
- 1.71×
- Total profit
- $35,861
- Equity at exit
- $15,563
Cash invested: $50,400 (down + closing). Projections, not guarantees.
Landlord ↔ Tenant lean methodology
- Overall (STATE)
- 62 Landlord-Friendly
- State Michigan
- 62 Landlord-Friendly · EVEN
- County
- — inherits STATE
- City
- — inherits STATE
ZIP-level market 48433
- Active inventory
- 156
- Price-to-rent
- 6.8×
Monthly cashflow live
- Estimated rent
- $2,200 medium interval (Pro) →
- Mortgage (P&I)
- −$944
- Tax from tax record
- −$276 /mo · $3,309/yr
- Insurance
- −$75
- HOA
- −$0
- Vacancy / Maint / Mgmt
- −$462
- Net cashflow
- $443
Break-even live
UW: 25.0% down · 7.5% · 30yr · 1.5% tax · 5.0% vac · 8.0% maint · 8.0% mgmt
Financing live
Cash to close
- Down payment
- $45,000
- Closing costs
- $5,400
- Reserves months
- —
- Total cash needed
- —
Loan-product check · same deal, 3 products live
Conventional
25% down · 7.5% · 30yr
- Down + closing
- —
- Monthly P&I
- —
- Monthly cashflow
- —
- DSCR
- —
- Eligible?
- —
Personal DTI + credit; lowest rate.
DSCR
20% down · 8.5% · 30yr
- Down + closing
- —
- Monthly P&I
- —
- Monthly cashflow
- —
- DSCR
- —
- Eligible?
- —
No personal income docs; deal must DSCR.
Hard money
10% down · 12.0% · 12mo
- Down + closing
- —
- Monthly P&I
- —
- Monthly cashflow
- —
- DSCR
- —
- Eligible?
- —
Short-term bridge; refi at stabilization.
Rent comps 1 comps
| Address | Beds | Baths | Sqft | Rent | $/sqft | DOM | Units | Dist |
|---|---|---|---|---|---|---|---|---|
| 620 Carpenter Rd Flushing, MI | 3.0 | 2.0 | 2244 | $2,200 | $0.98 | 21d | 1 | 1.28mi |
Listing history 2 events
-
2026-06-17remarks 699-char remark
Show marketing remark (1140 chars)
Welcome home to this charming 4-bedroom, 1-bath residence located on a quiet street in the heart of downtown Flushing! Situated within the highly desirable Flushing School District, this well-maintained home offers a spacious and functional layout with three bedrooms on the upper level and one conveniently located on the main floor. The updated kitchen features ample cabinetry, a large eat-in dining area, and all appliances included, making it truly move-in ready. Enjoy additional living space with both a comfortable family room and a separate dining room, perfect for everyday living and entertaining. Outside, you'll find a large fenced backyard ideal for pets, play, or outdoor gatherings, along with a 2-car detached garage for extra storage and parking. Relax and unwind on the inviting oversized front porch, perfect for enjoying quiet evenings in this peaceful neighborhood. Additional features include a Michigan basement, updated kitchen, and a prime location just minutes from downtown shopping, dining, parks, and schools. Don't miss this opportunity to own a spacious home in one of Flushing's most sought-after locations!
-
2026-06-17$180,000 Active 1 DOM
Show marketing remark (1140 chars)
Welcome home to this charming 4-bedroom, 1-bath residence located on a quiet street in the heart of downtown Flushing! Situated within the highly desirable Flushing School District, this well-maintained home offers a spacious and functional layout with three bedrooms on the upper level and one conveniently located on the main floor. The updated kitchen features ample cabinetry, a large eat-in dining area, and all appliances included, making it truly move-in ready. Enjoy additional living space with both a comfortable family room and a separate dining room, perfect for everyday living and entertaining. Outside, you'll find a large fenced backyard ideal for pets, play, or outdoor gatherings, along with a 2-car detached garage for extra storage and parking. Relax and unwind on the inviting oversized front porch, perfect for enjoying quiet evenings in this peaceful neighborhood. Additional features include a Michigan basement, updated kitchen, and a prime location just minutes from downtown shopping, dining, parks, and schools. Don't miss this opportunity to own a spacious home in one of Flushing's most sought-after locations!
ⓘ Source: listings_history table (triggers on properties + properties_extension) + one-shot
backfill from property_details.listing_events for pre-trigger history.
Tax reassessment forecast MI · Partial reset (capped growth)
- Current annual tax
- $3,309 · $276/mo
- Projected year-2 tax
- $3,309 · $276/mo
- Expected delta
- $0/yr ($0/mo · 0.0%)
ⓘ Screening estimate from a state-policy table — verify with the county assessor before closing.
Climate risk First Street
- Flood 1/10 Low FEMA zone X (unshaded) · 0% chance over 30 yrs
- Wildfire 1/10 Low
- Heat 2/10 Low 7 d/yr ≥96°F today · 15 d/yr by 30 yrs out
- Wind 2/10 Low
- Air quality 2/10 Low 1 unhealthy d/yr today · 3 by 30 yrs out
Nearby sold comps map
Loading sold comps map…
Walkable amenities ~0.75 mi
Loading nearby amenities…
Taxation est. · year 1
- Rental income
- $26,400
- − Mortgage interest
- −$10,083
- − Property taxes
- −$3,309
- − Insurance
- −$900
- − Repairs & maintenance
- −$2,112
- − Management
- −$2,112
- − Depreciation
- −$5,236
- Taxable income
- $2,648
- Est. tax owed @ 24.0%
- −$635
- After-tax cash flow
- $4,684/yr
For passive investors: Depreciation is non-cash, so a rental often shows a tax loss while cash-flowing — sheltering income. Rental losses are passive: they offset passive income freely, and up to $25,000/yr can offset ordinary (W-2) income if you actively participate and your MAGI is under $100k (phasing out to $0 by $150k); unused losses carry forward. On sale, claimed depreciation is recaptured at up to 25%, and gains may owe capital-gains tax (a 1031 exchange can defer both). Figures are a year-1 estimate at your 24.0% rate — not tax advice; consult a CPA.
Schools (NCES district)
- District
- Flushing Community Schools
- NCES district ID
- 2614550
- Math proficiency
- 25% ▼ -17.00%
- Reading proficiency
- 41% ▼ -11.00%
- Median HH income
- $58,883
- Composite
- 29.48/100
- National rank
- #6506
- State rank
- #295 of 540 in MI
Livability — Flushing
- Score
- 76/100
- State rank
- #140
- US rank
- #3431
Category grades
Schools grade is shown separately in the Schools card above.
Census & demographics
- Census place
- Flushing, MI
- Population (ZIP)
- 25,756
Population outlook (Genesee County) Hauer SSP2
- Today (2025)
- 381,312 people
- By 2030
- 362,731 · -4.9%
- By 2040
- 321,550 · -15.7%
- By 2050
- 279,212 · -26.8%
- By 2075
- 193,336 · -49.3%
- By 2100
- 128,118 · -66.4%
Race, ethnicity, and origin ACS 2023
- Neighborhood character
- Predominantly White (85%)
- Race & ethnicity
- White 85% Two or more races 6% Hispanic / Latino 4% Black 4%
- Common ancestry
- Romanian 5% Lithuanian 3% Slovak 3%
- Foreign-born
- 3% · Canada
- Languages at home
- 95% English-only · Arabic 2% Spanish 1% Other Indo-European 1%
Political lean MEDSL · Genesee
- 2024 margin
- Toss-up / Even · D 51.4% · R 47.2% · Other 1.4%
- 2008→2024 swing
- -28.3pp toward R · 2008: 32.5pp · 2024: 4.2pp
- All cycles
- 2024: D+4.2 2020: D+9.3 2016: D+9.5 2012: D+28.2 2008: D+32.5
Not yet ingested
- Civics
- —
Market trends
- HPI YoY
- ▼ -214.10%
- Current HPI
- 175.93
- Rent YoY
- —
- Metro
- —
- State GDP YoY
- ▲ 1.37%
- F500 in state
- 28
Industry mix (Fortune 500 HQ in MI)
| Industry | F500 HQs | Revenue |
|---|---|---|
| Automotive Parts | 3 | $48B |
|
||
| Automotive | 2 | $372B |
|
||
| Chemicals | 1 | $45B |
|
||
| Automotive Retail | 1 | $29B |
|
||
| Healthcare / Medical Devices | 1 | $23B |
|
||
| Automotive Technology | 1 | $20B |
|
||
Price history
+442.0% since first listed63 events — show timeline
- 2026-06-17 Listed $180,000 MiRealSource-MiMLS
- 2026-06-17 Listed $180,000 REALCOMP
- 2021-01-20 Sold (Public Records) $114,900 Public Records
- 2020-12-31 Sold (MLS) $114,900 MiRealSource-MiMLS
- 2020-12-31 Sold (MLS) $114,900 REALCOMP
- 2020-10-09 Pending — REALCOMP
- 2020-10-09 Pending — MiRealSource-MiMLS
- 2020-10-06 Contingent — MiRealSource-MiMLS
- 2020-10-06 Contingent — REALCOMP
- 2020-10-01 Relisted — REALCOMP
- 2020-10-01 Relisted — MiRealSource-MiMLS
- 2020-10-01 Pending — MiRealSource-MiMLS
- 2020-09-26 Contingent — REALCOMP
- 2020-09-26 Contingent — MiRealSource-MiMLS
- 2020-09-09 Listed $114,900 REALCOMP
- 2020-09-02 Coming Soon $114,900 REALCOMP
- 2020-09-02 Listed $114,900 MiRealSource-MiMLS
- 2019-01-16 Listing Removed — REALCOMP
- 2019-01-16 Listing Removed — MiRealSource-MiMLS
- 2018-12-24 Listing Removed — REALCOMP
- 2018-11-15 Price Changed $89,900 MiRealSource-MiMLS
- 2018-11-14 Price Changed $89,900 REALCOMP
- 2018-11-06 Listed $99,000 MiRealSource-MiMLS
- 2018-11-06 Listed $99,000 REALCOMP
- 2015-12-02 Listing Removed — MiRealSource-MiMLS
- 2015-09-09 Listed $79,900 MiRealSource-MiMLS
- 2015-09-09 Listed $79,900 REALCOMP
- 2013-05-31 Sold (MLS) $29,180 REALCOMP
- 2013-05-31 Sold (MLS) $29,180 MiRealSource-MiMLS
- 2013-05-31 Sold (MLS) $29,180 REALCOMP
- 2013-05-31 Sold (MLS) $29,180 MiRealSource-MiMLS
- 2013-05-28 Sold (MLS) $29,180 MiRealSource-MiMLS
- 2013-05-28 Sold (MLS) $29,180 REALCOMP
- 2013-05-06 Listing Removed — MiRealSource-MiMLS
- 2013-05-06 Listing Removed — MiRealSource-MiMLS
- 2013-05-06 Listing Removed — MiRealSource-MiMLS
- 2013-02-07 Listed $33,210 MiRealSource-MiMLS
- 2013-02-07 Listed $33,210 REALCOMP
- 2013-02-07 Listed $33,210 REALCOMP
- 2013-02-07 Listed $33,210 MiRealSource-MiMLS
- 2012-10-23 Listing Removed — MiRealSource-MiMLS
- 2012-10-23 Listing Removed — REALCOMP
- 2011-12-20 Listed $43,000 MiRealSource-MiMLS
- 2011-12-20 Listed $43,000 REALCOMP
- 2008-05-27 Listing Removed — REALCOMP
- 2008-05-27 Listing Removed — MiRealSource-MiMLS
- 2008-02-08 Listed $120,000 REALCOMP
- 2008-02-08 Listed $120,000 MiRealSource-MiMLS
- 2006-05-05 Sold (Public Records) $104,000 Public Records
- 2006-04-10 Sold (MLS) $104,000 MiRealSource-MiMLS
- 2006-04-10 Sold (MLS) $95,000 REALCOMP
- 2006-04-10 Sold (MLS) $104,000 REALCOMP
- 2006-03-20 Listing Removed — MiRealSource-MiMLS
- 2006-02-28 Listed $99,900 REALCOMP
- 2006-02-27 Listed $99,900 MiRealSource-MiMLS
- 2006-02-27 Listed $99,900 REALCOMP
- 2000-05-15 Sold (MLS) $84,900 MiRealSource-MiMLS
- 2000-05-15 Sold (MLS) $84,900 REALCOMP
- 2000-03-12 Listing Removed — MiRealSource-MiMLS
- 2000-03-06 Listed $89,900 MiRealSource-MiMLS
- 2000-03-06 Listed $89,900 REALCOMP
- 1900-01-01 Listed $33,210 MiRealSource-MiMLS
- 1900-01-01 Listed $33,210 REALCOMP
Property tax history
+5.6%/yrLatest (2025): $3,309 · +2.9% YoY. Source: county tax records.
Cash-flow waterfall
monthlySold comps — $/sqft
last 12 mo · ≤1 miLoading sold comps…