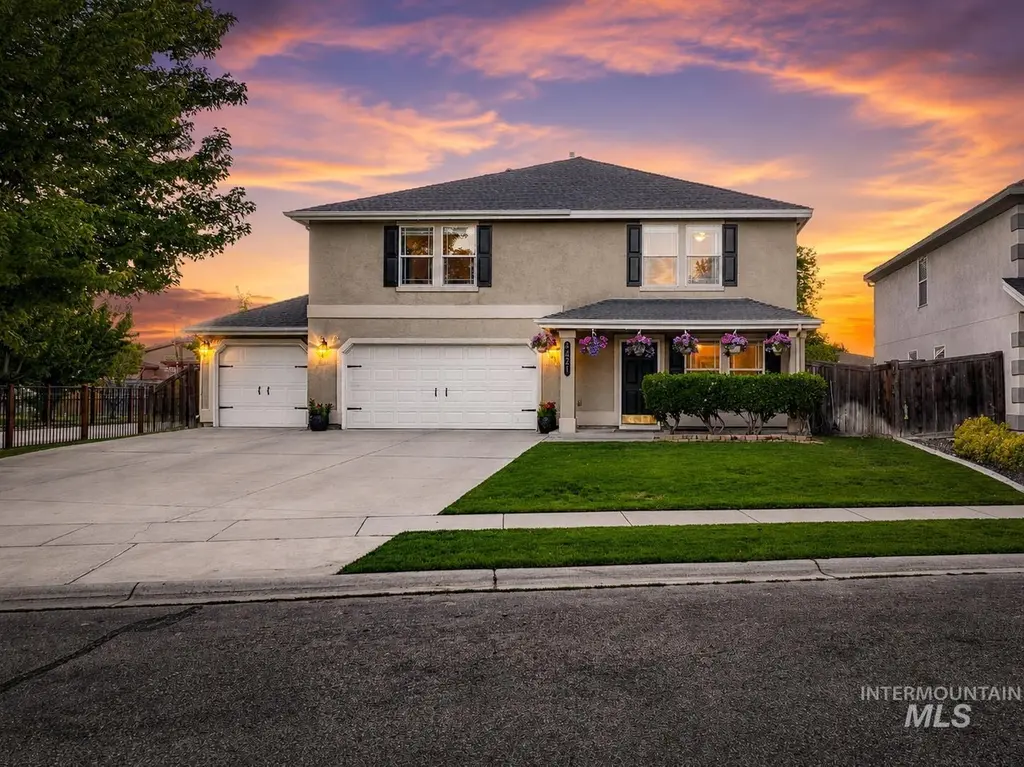
4421 N Tempest Way · Meridian, ID
Flood risk 1/10 · Minimal
- FEMA flood zone
- X (unshaded)
- Chance of flooding over 30 yrs
- 0.0%
- Est. flood insurance / yr
- $507 – $1,088
Fire risk 2/10 · Minimal
- Est. fire insurance / yr
- $584 – $1,086
Heat risk 5/10 · Moderate
- Hot days now (above 96°F)
- 7 days/yr
- Hot days in 30 yrs
- 17 days/yr
Wind risk 1/10 · Minimal
- Chance of severe wind over 30 yrs
- —
Air-quality risk 7/10 · Major
- Unhealthy air days now
- 12 days/yr
- Unhealthy air days in 30 yrs
- 16 days/yr
Risk factors via First Street. Map © Google.
Why this score? — see what drove the D+ grade
The composite is a weighted blend of 9 inputs, each scored 0–100. Each bar is that input's sub-score; the figure is the points it added to the 100-point composite (weight × sub-score).
- ARV discount +14.8/15.0
- Cash flow +11.4/30.0
- Schools +5.2/10.0
- Livability +4.1/5.0
- Rent growth +3.6/5.0
- DSCR +3.3/10.0
- Condition / age +2.5/5.0
- 1% rule +2.1/10.0
- Appreciation +0.0/10.0
$644,900
🖨 Deal sheet (PDF) 📄 Offer letter ✓ Due diligence
Listing remarks
Beautifully maintained & thoughtfully designed, this N Meridian home offers the perfect blend of style, functionality, & everyday comfort. Featuring flexible living spaces throughout, the home is designed to adapt to every stage of life. The heart of the home is the stunning chef's kitchen, complete with quartz countertops, a large center island, custom range hood, gas cooktop, window-lined walk-in pantry, and dedicated desk area. Luxury vinyl plank flooring flows throughout the main living areas, while the inviting great room showcases a beautiful gas fireplace flanked by custom built-ins, creating a warm and welcoming gathering space. A versatile bonus room offers endless possi
Key facts
- Gas cooktop
- Quartz countertops
- Gas fireplace
Tags
Property features AI
Finance
- Other: Paved road access; Located in the Havasu subdivision
- HOA & community: Association with annual fee of $500
Exterior
- Parking: Attached 3-car garage; Covered parking; Finished driveway
- Utilities: City water service; Sewer connected; Cable connected
- Home design: Single Family Residence; Built in 2005
- Construction: Frame and stucco construction; Composition roof; Storage shed
- Exterior features: Full fencing; Storage shed; Sidewalks; Auto sprinkler system / full sprinkler system / pressurized irrigation available
Interior
- Kitchen: Kitchen on main level approximately 16 x 13; Quartz counters; Dishwasher; Disposal; Microwave; Freestanding oven/range; Refrigerator; Breakfast bar; Pantry
- Bedrooms: 4 bedrooms (all upper level); Primary bedroom approximately 20 x 17; Second bedroom approximately 15 x 11; Third bedroom approximately 16 x 11; Fourth bedroom approximately 16 x 13
- Bathrooms: 3 bathrooms
- Interior features: Bath in master bedroom; Family room; Great room; Breakfast bar; Pantry; Quartz counters; One gas fireplace
- Laundry & utility: Washer and dryer included; Tankless water heater; Water softener (owned)
Neighborhood map
What this means for you Summary
Snapshot
- This is a 4-bed/3.0-bath single-family listed at $645k.
Deal economics
- At list price, monthly cash flow is $-228 ($-3k/yr) — negative.
- To cash-flow at today's rent, offer at most $605k (6.2% below list).
- To meet the 1% rule (rent ≥ 1% of price), the offer needs to be $458k (29.0% below list).
- Recommended offer: $458k (29.0% below list) — sets the bar for 1% rule.
- Cap rate 5.9% vs local median 3.1% in Meridian — top-decile yield for the area; either an underpriced asset or a hidden risk that comps aren't pricing in. Stress-test before assuming the spread holds.
Location & tenants
- Location reads 82/100 on livability (#10 in ID, #1,176 nationally) — a professional / high-income tenant draw. Strengths: crime A+, commute A+, employment A+; Watch: cost of living D+.
- Joint School District No. 2 (suburban): math 53% / reading 67% proficiency, ranked #11 of 92 in ID (top 12%) — acceptable for families but not a draw, mixed tenant base, ~2y average lease.
- Zoned schools: Prospect Elementary School (math 63% / reading 60%, grade B, #68 of 357 statewide, top 19%, 532 students, 15% FRL); Rocky Mountain High School (math 47% / reading 76%, grade B-, #18 of 169 statewide, top 10%, 1,917 students, 8% FRL).
- Market conditions: Rents rising fast (+4.2%/yr); 893 active listings in the ZIP; 3 comparable units currently listed for rent nearby; rentals at typical pace (median 15d on market — plan ~3-4 weeks tenant-placement turnaround); solid renter incomes; 5,129 units permitted in Ada County in 2024 (414 in 5+ unit buildings).
- At $4,578/mo this rent would consume 53% of the median local household income ($103k/yr) (locally 1017% of renters already pay >50% of income on rent) — very limited rent-growth headroom before tenants either downsize or default.
Forward outlook
- Local home prices are declining (-3.0%/yr); year-one equity from $4k of loan paydown is wiped out by about $19k of value loss. Plan a longer hold.
- Ada County population projected at +45% by 2050 — long-run rental-demand tailwind backs the buy-and-hold thesis.
Negotiation context
- Only 9 days on market — expect competitive offers; lowballing is unlikely to land.
- 3 sale attempts since 21y ago with the ask held roughly flat each time — persistent listings suggest the price (not the market) is what's stuck; bring a comps-based counter.
Risks & watch-outs
- Climate carrying-cost: extreme-heat days projected 7→17/yr by 2055 (HVAC capex compounding) — expect insurance premiums to compound above CPI over the hold.
Questions for the listing agent
- What do current leases actually rent for vs. the listed asking? Can we see a recent rent roll and the last 12 months of T-12 income?
- What does the HOA fee cover, when was the last increase, and are there any pending special assessments or reserve-fund shortfalls?
- Is there a deadline driving the sale (1031 exchange, divorce, estate, relocation)? That informs how much negotiation room exists.
- Schools are A-rated — typically a magnet for longer-tenancy family renters. What's the average tenant stay here, and is there a school-zone premium baked into asking?
- The area grade is low — what's the realistic commute time and amenity access for the typical tenant pool here? Any planned neighborhood developments (good or bad) we should know about?
- What's the average days-on-market for RENTAL listings here right now (not sales)? A rising rental-DOM trend means longer vacancies and softer asking-rent achievability than the comps imply.
- What's the recent tenant-quality profile in this submarket — average credit score on applications, eviction rate, late-payment / NSF rate, and stable-employment percentage? A property-management company in the area should have these aggregated.
- How much new for-sale + rental construction is in the pipeline within 1–3 miles? Heavy new supply typically softens prices + rents 12–24 months out; constrained supply supports both.
Investment metrics
- 1% rule
- 0.71% ✗
- Cap rate
- 5.87%
- Cash-on-cash
- -1.51%
- DSCR
- 0.93
- GRM
- 11.7
CMA / ARV
- ARV (on-the-fly)
- $770,718
- Comps found
- 12
Show comp detail 12 sales within ~0.75 mi
| Address | Dist | Beds/Ba | Sqft | Sold | Price | $/sf | Match |
|---|---|---|---|---|---|---|---|
| 998 E Kaibab Trail Dr | 0.09mi | 4/3.0 | 3,204 (+0%) | 8mo | $719,900 | $225 | 88 |
| 4674 N Supai Pl | 0.20mi | 4/3.5 | 3,154 (-1%) | 5mo | $969,900 | $308 | 82 |
| 4154 N Tipton Ave | 0.23mi | 5/3.5 (+1) | 3,038 (-5%) | 1mo | $700,000 | $230 | 73 |
| 1145 E Territory St | 0.16mi | 3/2.5 (-1) | 2,979 (-7%) | 2mo | $1,015,000 | $341 | 72 |
| 4512 N Trail Blazer Pl | 0.53mi | 4/2.5 | 3,232 (+1%) | 2mo | $744,900 | $230 | 70 |
| 2104 E Sidewinder | 0.69mi | 4/3.0 | 3,153 (-1%) | 2mo | $799,900 | $254 | 64 |
| 4309 N Heritage Woods Way | 0.11mi | 5/3.5 (+1) | 2,809 (-12%) | 5mo | $665,000 | $237 | 64 |
| 4481 N Diamond Crk | 0.30mi | 4/2.5 | 2,826 (-12%) | 1mo | $635,000 | $225 | 63 |
| 4696 N Legacy Woods Pl | 0.19mi | 4/3.0 | 2,793 (-13%) | 8mo | $819,000 | $293 | 63 |
| 614 E Senita Canyon St | 0.45mi | 4/3.0 | 2,876 (-10%) | 6mo | $679,900 | $236 | 57 |
| 891 E Silver Torch St | 0.43mi | 5/2.5 (+1) | 2,895 (-10%) | 2mo | $699,000 | $241 | 56 |
| 674 E Ocelot | 0.54mi | 5/3.0 (+1) | 3,035 (-5%) | 8mo | $789,900 | $260 | 55 |
Match score weights: distance 35% · size 25% · config 20% · recency 20%. Top-matched comps best support the ARV.
Projected returns pro-forma
-3.0% appreciation · 4.21% rent growth · sell at horizon
- IRR
- -17.7%
- Equity multiple
- 0.37×
- Total profit
- $-113,675
- Equity at exit
- $96,157
- IRR
- -8.0%
- Equity multiple
- 0.47×
- Total profit
- $-95,189
- Equity at exit
- $55,759
Cash invested: $180,572 (down + closing). Projections, not guarantees.
Landlord ↔ Tenant lean methodology
- Overall (STATE)
- 91 Strongly Landlord-Friendly
- State Idaho
- 91 Strongly Landlord-Friendly · R+18
- County
- — inherits STATE
- City
- — inherits STATE
ZIP-level market 83646
- Home prices YoY
- -33.6%
- Rents YoY
- 4.2%
- Active inventory
- 893
- Price-to-rent
- 11.7×
Monthly cashflow live
- Estimated rent
- $4,578 medium interval (Pro) →
- Mortgage (P&I)
- −$3,382
- Tax from tax record
- −$152 /mo · $1,825/yr
- Insurance
- −$269
- HOA
- −$42
- Vacancy / Maint / Mgmt
- −$961
- Net cashflow
- $-228
Break-even live
Sensitivity live
| Price | -10% $137 | -5% $-45 | +0% $-228 | +5% $-410 | +10% $-593 |
|---|---|---|---|---|---|
| Rent | -10% $-589 | -5% $-409 | +0% $-228 | +5% $-47 | +10% $134 |
| Rate | -1.0pp $97 | -0.5pp $-64 | base $-228 | +0.5pp $-395 | +1.0pp $-565 |
UW: 25.0% down · 7.5% · 30yr · 1.5% tax · 5.0% vac · 8.0% maint · 8.0% mgmt
Financing live
Cash to close
- Down payment
- $161,225
- Closing costs
- $19,347
- Reserves months
- —
- Total cash needed
- —
Loan-product check · same deal, 3 products live
Conventional
25% down · 7.5% · 30yr
- Down + closing
- —
- Monthly P&I
- —
- Monthly cashflow
- —
- DSCR
- —
- Eligible?
- —
Personal DTI + credit; lowest rate.
DSCR
20% down · 8.5% · 30yr
- Down + closing
- —
- Monthly P&I
- —
- Monthly cashflow
- —
- DSCR
- —
- Eligible?
- —
No personal income docs; deal must DSCR.
Hard money
10% down · 12.0% · 12mo
- Down + closing
- —
- Monthly P&I
- —
- Monthly cashflow
- —
- DSCR
- —
- Eligible?
- —
Short-term bridge; refi at stabilization.
Rent comps 3 comps
| Address | Beds | Baths | Sqft | Rent | $/sqft | DOM | Units | Dist |
|---|---|---|---|---|---|---|---|---|
| 5327 N Red Hills Pl Unit 1460932P Meridian, ID | 5.0 | 2.5 | 3390 | $7,384 | $2.18 | 14d | 1 | 0.57mi |
| 236 W Wausau St Meridian, ID | 4.0 | 2.5 | 2692 | $2,795 | $1.04 | 12d | 1 | 0.73mi |
| 2946 NW 8th Ave Meridian, ID | 4.0 | 2.5 | 2540 | $2,900 | $1.14 | 15d | 1 | 1.46mi |
HOA detail
- Monthly dues
- $42 · $504/yr
- Likely covers
- gas
Listing history 7 events
-
2026-06-18days on market $644,900 Active 9 DOM
-
2026-06-17days on market $644,900 Active 8 DOM
-
2026-06-16days on market $644,900 Active 7 DOM
-
2026-06-15days on market $644,900 Active 6 DOM
-
2026-06-13days on market $644,900 Active 4 DOM
-
2026-06-10remarks 691-char remark
-
2026-06-10$644,900 Active 1 DOM
ⓘ Source: listings_history table (triggers on properties + properties_extension) + one-shot
backfill from property_details.listing_events for pre-trigger history.
Tax reassessment forecast ID · Resets to sale price
- Current annual tax
- $1,825 · $152/mo
- Projected year-2 tax
- $4,450 · $371/mo
- Expected delta
- +$2,625/yr (+$219/mo · 143.8%)
ⓘ Screening estimate from a state-policy table — verify with the county assessor before closing.
Climate risk First Street
- Flood 1/10 Low FEMA zone X (unshaded) · 0% chance over 30 yrs
- Wildfire 2/10 Low
- Heat 5/10 Major 7 d/yr ≥96°F today · 17 d/yr by 30 yrs out
- Wind 1/10 Low
- Air quality 7/10 Severe 12 unhealthy d/yr today · 16 by 30 yrs out
Nearby sold comps map
Loading sold comps map…
Walkable amenities ~0.75 mi
Loading nearby amenities…
Taxation est. · year 1
- Rental income
- $54,941
- − Mortgage interest
- −$36,124
- − Property taxes
- −$1,825
- − Insurance
- −$3,224
- − Repairs & maintenance
- −$4,395
- − Management
- −$4,395
- − HOA
- −$504
- − Depreciation
- −$18,761
- Taxable loss
- −$14,288
- Est. tax savings @ 24.0%
- +$3,429
- After-tax cash flow
- $696/yr
For passive investors: Depreciation is non-cash, so a rental often shows a tax loss while cash-flowing — sheltering income. Rental losses are passive: they offset passive income freely, and up to $25,000/yr can offset ordinary (W-2) income if you actively participate and your MAGI is under $100k (phasing out to $0 by $150k); unused losses carry forward. On sale, claimed depreciation is recaptured at up to 25%, and gains may owe capital-gains tax (a 1031 exchange can defer both). Figures are a year-1 estimate at your 24.0% rate — not tax advice; consult a CPA.
Schools (NCES district)
- District
- Joint School District No. 2
- NCES district ID
- 1602100
- Math proficiency
- 53% ▼ -6.00%
- Reading proficiency
- 67% ▼ -1.00%
- Median HH income
- $64,573
- Composite
- 52.42/100
- National rank
- #1576
- State rank
- #11 of 92 in ID
Livability — Meridian
- Score
- 82/100
- State rank
- #10
- US rank
- #1176
Category grades
Schools grade is shown separately in the Schools card above.
Census & demographics
- Census place
- Meridian, ID
- County
- Ada County · 522,161 people
- City population
- 138,302
- Metro
- Boise City, ID
- Population (ZIP)
- 76,023
- Household income
- $102,861
- Rent vs Own
- Severe rent burden
- 1017.0
Population outlook (Ada County) Hauer SSP2
- Today (2025)
- 535,818 people
- By 2030
- 585,751 · +9.3%
- By 2040
- 682,435 · +27.4%
- By 2050
- 775,818 · +44.8%
- By 2075
- 994,458 · +85.6%
- By 2100
- 1,148,884 · +114.4%
Race, ethnicity, and origin ACS 2023
- Neighborhood character
- Predominantly White (81%)
- Race & ethnicity
- White 81% Two or more races 10% Hispanic / Latino 9% Black 2% Asian 2%
- Hispanic origin (detail)
- Mexican 7%
- Common ancestry
- Italian 3% Portuguese 3% Slovak 2%
- Foreign-born
- 4% · Canada
- Languages at home
- 93% English-only · Spanish 3% Russian/Polish/Slavic 1%
Political lean MEDSL · Ada
- 2024 margin
- R (+10.3) · D 43.4% · R 53.8% · Other 2.8%
- 2008→2024 swing
- -4.2pp toward R · 2008: -6.2pp · 2024: -10.3pp
- All cycles
- 2024: R+10.3 2020: R+3.9 2016: R+9.2 2012: R+11.3 2008: R+6.2
Not yet ingested
- Civics
- —
Market trends
- HPI YoY
- ▼ -161.13%
- Current HPI
- 318.2697
- Rent YoY
- ▲ 4.21%
- Metro
- Boise City, ID
- State GDP YoY
- ▲ 4.51%
- F500 in state
- 6
Industry mix (Fortune 500 HQ in ID)
| Industry | F500 HQs | Revenue |
|---|---|---|
| Retail | 1 | $79B |
|
||
| Technology | 1 | $25B |
|
||
| Food / Agriculture | 1 | $6B |
|
||
Price history
+196.9% since first listed6 events — show timeline
- 2026-06-09 Listed $644,900 IMLS
- 2018-03-08 Sold (Public Records) — Public Records
- 2009-03-16 Sold (Public Records) — Public Records
- 2008-10-14 Listed $174,900 IMLS
- 2005-11-15 Sold (MLS) — IMLS
- 2005-09-27 Listed $217,181 IMLS
Property tax history
-0.0%/yrLatest (2025): $1,825 · +6.4% YoY. Source: county tax records.
Cash-flow waterfall
monthlySold comps — $/sqft
last 12 mo · ≤1 miLoading sold comps…