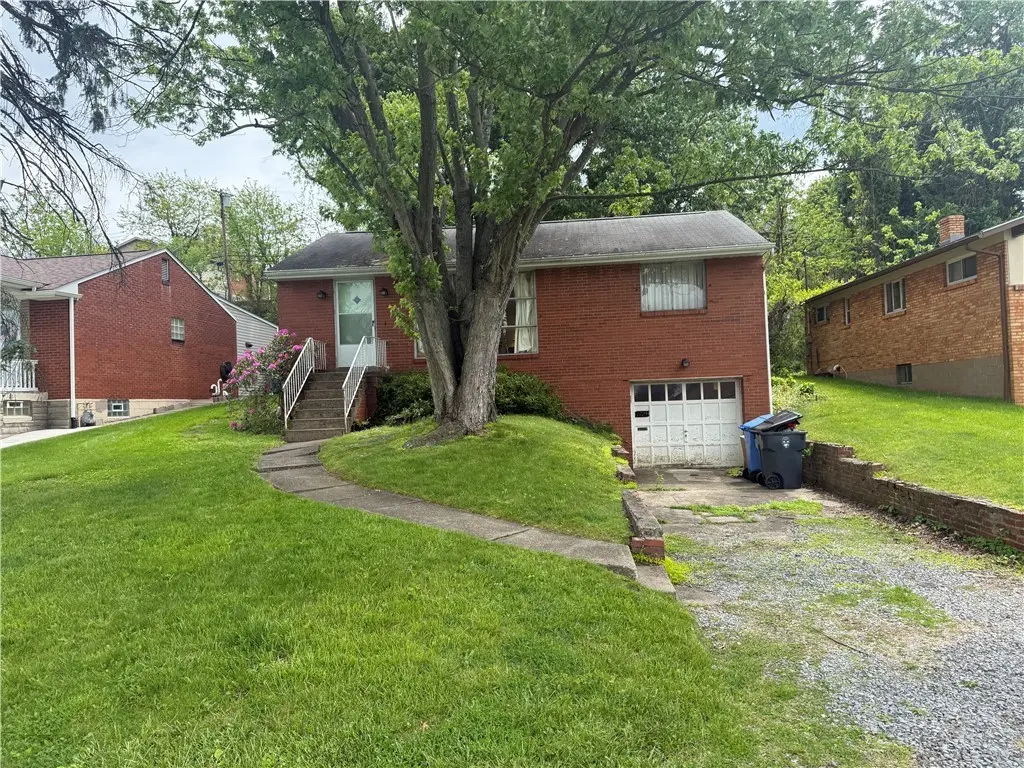
1725 Norsen Dr · Bridgeville, PA
Flood risk 1/10 · Minimal
- FEMA flood zone
- X (unshaded)
- Chance of flooding over 30 yrs
- 0.0%
- Est. flood insurance / yr
- $473 – $860
Fire risk 1/10 · Minimal
- Est. fire insurance / yr
- $511 – $949
Heat risk 3/10 · Minor
- Hot days now (above 96°F)
- 7 days/yr
- Hot days in 30 yrs
- 17 days/yr
Wind risk 2/10 · Minimal
- Chance of severe wind over 30 yrs
- —
Air-quality risk 2/10 · Minimal
- Unhealthy air days now
- 0 days/yr
- Unhealthy air days in 30 yrs
- 3 days/yr
Risk factors via First Street. Map © Google.
Why this score? — see what drove the C+ grade
The composite is a weighted blend of 9 inputs, each scored 0–100. Each bar is that input's sub-score; the figure is the points it added to the 100-point composite (weight × sub-score).
- Cash flow +20.6/30.0
- ARV discount +15.0/15.0
- DSCR +6.5/10.0
- 1% rule +5.9/10.0
- Schools +4.1/10.0
- Livability +4.0/5.0
- Rent growth +2.5/5.0
- Condition / age +2.5/5.0
- Appreciation +0.0/10.0
$150,000
🖨 Deal sheet 📄 Offer letter ✓ Due diligence
Listing remarks
A brick ranch fixer-upper with 3-bedrooms and 1 full bath with great potential. Situated on a level yard ideal for outdoor living, gardening, or future expansion, this home offers a practical layout and is ready for your updates. A single detached garage provides extra storage or workshop space. Located in Scott Township and Chartiers Valley School District.
Key facts
- Level yard
- Future expansion
- Extra storage
Tags
Property features AI
Exterior
- Parking: Built-in attached garage (1 parking space)
- Utilities: Public water; Public sewer
- Home design: Single-story home; Resale property
- Construction: Brick construction; Asphalt roof
- Exterior features: Lot dimensions approximately 54 x 124 x 47 x 123
Interior
- Kitchen: Kitchen on main level (11 x 8); Stove; Some gas appliances
- Bedrooms: Bedroom on main level (9 x 11)
- Flooring: Ceramic tile; Hardwood; Vinyl
- Bathrooms: 1 full bathroom
- Heating & cooling: Forced air heating (gas); Central air conditioning
- Interior features: Basement present; Family room in basement
- Laundry & utility: Laundry room in basement (22 x 11)
Neighborhood map
What this means for you Summary
Snapshot
- This is a 2-bed/1.0-bath single-family listed at $150k.
Deal economics
- At list price, monthly cash flow is $199 ($2k/yr) — positive.
- The deal already cash-flows at list — no discount required.
- Meets the 1% rule at list price ($2k rent vs $150k).
- Cap rate 7.9% vs local median 4.5% in Bridgeville — top-decile yield for the area; either an underpriced asset or a hidden risk that comps aren't pricing in. Stress-test before assuming the spread holds.
Location & tenants
- Location reads 80/100 on livability (#199 in PA, #1,745 nationally) — a professional / high-income tenant draw. Strengths: cost of living A+, housing A+, amenities A; Watch: employment C-, commute F.
- Chartiers Valley SD (suburban): math 37% / reading 57% proficiency, ranked #221 of 539 in PA (top 41%) — families likely to look elsewhere, expect single-tenant / working-renter base with shorter leases.
- Market conditions: 15 active listings in the ZIP; 2 comparable units currently listed for rent nearby; 2,996 units permitted in Allegheny County in 2024 (1,588 in 5+ unit buildings).
Forward outlook
- Local home prices are declining (-3.0%/yr); year-one equity from $1k of loan paydown is wiped out by about $4k of value loss. Plan a longer hold.
Negotiation context
- Only 6 days on market — expect competitive offers; lowballing is unlikely to land.
Risks & watch-outs
- Watch-outs: built in 1957 — expect roof / HVAC / electrical / plumbing capex.
Questions for the listing agent
- Built in 1957 — when were the roof, HVAC, electrical panel, plumbing, and water heater last replaced?
- Is there a deadline driving the sale (1031 exchange, divorce, estate, relocation)? That informs how much negotiation room exists.
- Schools are B-rated — typically a magnet for longer-tenancy family renters. What's the average tenant stay here, and is there a school-zone premium baked into asking?
- What's the average days-on-market for RENTAL listings here right now (not sales)? A rising rental-DOM trend means longer vacancies and softer asking-rent achievability than the comps imply.
- What's the recent tenant-quality profile in this submarket — average credit score on applications, eviction rate, late-payment / NSF rate, and stable-employment percentage? A property-management company in the area should have these aggregated.
- How much new for-sale + rental construction is in the pipeline within 1–3 miles? Heavy new supply typically softens prices + rents 12–24 months out; constrained supply supports both.
Investment metrics
- 1% rule
- 1.09% ✓
- Cap rate
- 7.89%
- Cash-on-cash
- 5.70%
- DSCR
- 1.25
- GRM
- 7.7
CMA / ARV
- ARV (on-the-fly)
- $233,100
- Comps found
- 12
Show comp detail 12 sales within ~0.75 mi
| Address | Dist | Beds/Ba | Sqft | Sold | Price | $/sf | Match |
|---|---|---|---|---|---|---|---|
| 675 Somerville | 0.25mi | 3/1.0 (+1) | 900 (0%) | 4mo | $250,900 | $279 | 80 |
| 1943 Worcester Dr | 0.22mi | 2/2.0 | 936 (+4%) | 12mo | $242,500 | $259 | 69 |
| 1644 Moynelle Dr | 0.11mi | 2/2.0 | 945 (+5%) | 21mo | $235,500 | $249 | 66 |
| 1649 Pembroke Dr | 0.14mi | 3/2.0 (+1) | 1,001 (+11%) | 2mo | $250,000 | $250 | 64 |
| 2075 Borland | 0.28mi | 2/2.0 | 1,000 (+11%) | 1mo | $170,000 | $170 | 63 |
| 569 Somerville Dr | 0.27mi | 2/2.0 | 962 (+7%) | 22mo | $250,000 | $260 | 54 |
| 1612 Worcester Dr | 0.37mi | 2/2.0 | 1,011 (+12%) | 7mo | $248,000 | $245 | 53 |
| 1945 Berkwood Dr | 0.15mi | 2/2.0 | 1,034 (+15%) | 14mo | $267,900 | $259 | 52 |
| 1520 Worcester Dr | 0.41mi | 3/1.5 (+1) | 1,003 (+11%) | 9mo | $242,000 | $241 | 47 |
| 310 Elmbrook Ln | 0.59mi | 2/2.0 | 973 (+8%) | 13mo | $251,000 | $258 | 44 |
| 408 Pierina Dr | 0.68mi | 3/3.0 (+1) | 909 (+1%) | 12mo | $265,000 | $292 | 43 |
| 415 Salvini Dr | 0.64mi | 3/2.0 (+1) | 950 (+6%) | 14mo | $268,000 | $282 | 41 |
Match score weights: distance 35% · size 25% · config 20% · recency 20%. Top-matched comps best support the ARV.
Projected returns pro-forma
-3.0% appreciation · 3.0% rent growth · sell at horizon
- IRR
- -7.4%
- Equity multiple
- 0.73×
- Total profit
- $-11,543
- Equity at exit
- $22,365
- IRR
- 2.2%
- Equity multiple
- 1.16×
- Total profit
- $6,542
- Equity at exit
- $12,969
Cash invested: $42,000 (down + closing). Projections, not guarantees.
Landlord ↔ Tenant lean methodology
- Overall (STATE)
- 62 Landlord-Friendly
- State Pennsylvania
- 62 Landlord-Friendly · EVEN
- County
- — inherits STATE
- City
- — inherits STATE
ZIP-level market 15243
- Home prices YoY
- -34.2%
- Active inventory
- 15
- Price-to-rent
- 7.7×
Monthly cashflow live
- Estimated rent
- $1,632 medium interval (Pro) →
- Mortgage (P&I)
- −$787
- Tax from tax record
- −$240 /mo · $2,885/yr
- Insurance
- −$62
- HOA
- −$0
- Vacancy / Maint / Mgmt
- −$343
- Net cashflow
- $199
Break-even live
UW: 25.0% down · 7.5% · 30yr · 1.5% tax · 5.0% vac · 8.0% maint · 8.0% mgmt
Financing live
Cash to close
- Down payment
- $37,500
- Closing costs
- $4,500
- Reserves months
- —
- Total cash needed
- —
Loan-product check · same deal, 3 products live
Conventional
25% down · 7.5% · 30yr
- Down + closing
- —
- Monthly P&I
- —
- Monthly cashflow
- —
- DSCR
- —
- Eligible?
- —
Personal DTI + credit; lowest rate.
DSCR
20% down · 8.5% · 30yr
- Down + closing
- —
- Monthly P&I
- —
- Monthly cashflow
- —
- DSCR
- —
- Eligible?
- —
No personal income docs; deal must DSCR.
Hard money
10% down · 12.0% · 12mo
- Down + closing
- —
- Monthly P&I
- —
- Monthly cashflow
- —
- DSCR
- —
- Eligible?
- —
Short-term bridge; refi at stabilization.
Rent comps 2 comps
| Address | Beds | Baths | Sqft | Rent | $/sqft | DOM | Units | Dist |
|---|---|---|---|---|---|---|---|---|
| 1735 Norsen Dr Pittsburgh, PA | 2.0 | 1.5 | 900 | $1,650 | $1.83 | 12d | 1 | 0.02mi |
| 1170 Bower Hill Rd Pittsburgh, PA | 1.0–3.0 | 1.0–2.0 | 1012 | $1,450 | $1.43 | 2d | 1 | 0.88mi |
Listing history 2 events
-
2026-05-14status Pending
-
2026-05-08$150,000 Active
ⓘ Source: listings_history table (triggers on properties + properties_extension) + one-shot
backfill from property_details.listing_events for pre-trigger history.
Tax reassessment forecast PA · Partial reset (capped growth)
- Current annual tax
- $2,885 · $240/mo
- Projected year-2 tax
- $2,885 · $240/mo
- Expected delta
- $0/yr ($0/mo · 0.0%)
ⓘ Screening estimate from a state-policy table — verify with the county assessor before closing.
Climate risk First Street
- Flood 1/10 Low FEMA zone X (unshaded) · 0% chance over 30 yrs
- Wildfire 1/10 Low
- Heat 3/10 Moderate 7 d/yr ≥96°F today · 17 d/yr by 30 yrs out
- Wind 2/10 Low
- Air quality 2/10 Low 0 unhealthy d/yr today · 3 by 30 yrs out
Nearby sold comps map
Loading sold comps map…
Walkable amenities ~0.75 mi
Loading nearby amenities…
Taxation est. · year 1
- Rental income
- $19,581
- − Mortgage interest
- −$8,402
- − Property taxes
- −$2,885
- − Insurance
- −$750
- − Repairs & maintenance
- −$1,566
- − Management
- −$1,566
- − Depreciation
- −$4,364
- Taxable income
- $46
- Est. tax owed @ 24.0%
- −$11
- After-tax cash flow
- $2,383/yr
For passive investors: Depreciation is non-cash, so a rental often shows a tax loss while cash-flowing — sheltering income. Rental losses are passive: they offset passive income freely, and up to $25,000/yr can offset ordinary (W-2) income if you actively participate and your MAGI is under $100k (phasing out to $0 by $150k); unused losses carry forward. On sale, claimed depreciation is recaptured at up to 25%, and gains may owe capital-gains tax (a 1031 exchange can defer both). Figures are a year-1 estimate at your 24.0% rate — not tax advice; consult a CPA.
Schools (NCES district)
- District
- Chartiers Valley SD
- NCES district ID
- 4205700
- Math proficiency
- 37% ▼ -16.00%
- Reading proficiency
- 57% ▼ -17.00%
- Median HH income
- $57,191
- Composite
- 40.91/100
- National rank
- #3614
- State rank
- #221 of 539 in PA
Livability — Bridgeville
- Score
- 80/100
- State rank
- #199
- US rank
- #1745
Category grades
Schools grade is shown separately in the Schools card above.
Census & demographics
- City population
- 17,782
- Population (ZIP)
- 13,682
Population outlook (Allegheny County) Hauer SSP2
- Today (2025)
- 1,250,282 people
- By 2030
- 1,256,482 · +0.5%
- By 2040
- 1,256,318 · +0.5%
- By 2050
- 1,244,169 · -0.5%
- By 2075
- 1,197,693 · -4.2%
- By 2100
- 1,093,187 · -12.6%
Race, ethnicity, and origin ACS 2023
- Neighborhood character
- Predominantly White (85%)
- Race & ethnicity
- White 85% Two or more races 8% Asian 6% Hispanic / Latino 3% Black 1%
- Common ancestry
- Romanian 6% Slovak 4% Scotch-Irish 2%
- Foreign-born
- 7% · Vietnam, China, Canada
- Languages at home
- 89% English-only · Spanish 3% Vietnamese 2% Chinese 2%
Political lean MEDSL · Allegheny
- 2024 margin
- Strong D (+20.3) · D 59.7% · R 39.4%
- 2008→2024 swing
- +4.8pp toward D · 2008: 15.5pp · 2024: 20.3pp
- All cycles
- 2024: D+20.3 2020: D+20.4 2016: D+16.4 2012: D+14.4 2008: D+15.5
Not yet ingested
- Civics
- —
Market trends
- HPI YoY
- ▼ -134.65%
- Current HPI
- 259.0873
- Rent YoY
- —
- Metro
- —
- State GDP YoY
- ▲ 1.68%
- F500 in state
- 34
Industry mix (Fortune 500 HQ in PA)
| Industry | F500 HQs | Revenue |
|---|---|---|
| Healthcare | 2 | $309B |
|
||
| Insurance | 2 | $27B |
|
||
| Telecommunications / Media | 1 | $124B |
|
||
| Industrial Distribution | 1 | $22B |
|
||
| Financial Services | 1 | $20B |
|
||
| Chemicals / Materials | 1 | $18B |
|
||
Price history
2 events — show timeline
- 2026-05-14 Pending — West Penn MLS
- 2026-05-08 Listed $150,000 West Penn MLS
Property tax history
+2.3%/yrLatest (2026): $2,885 · +0.0% YoY. Source: county tax records.
Cash-flow waterfall
monthlySold comps — $/sqft
last 12 mo · ≤1 miLoading sold comps…