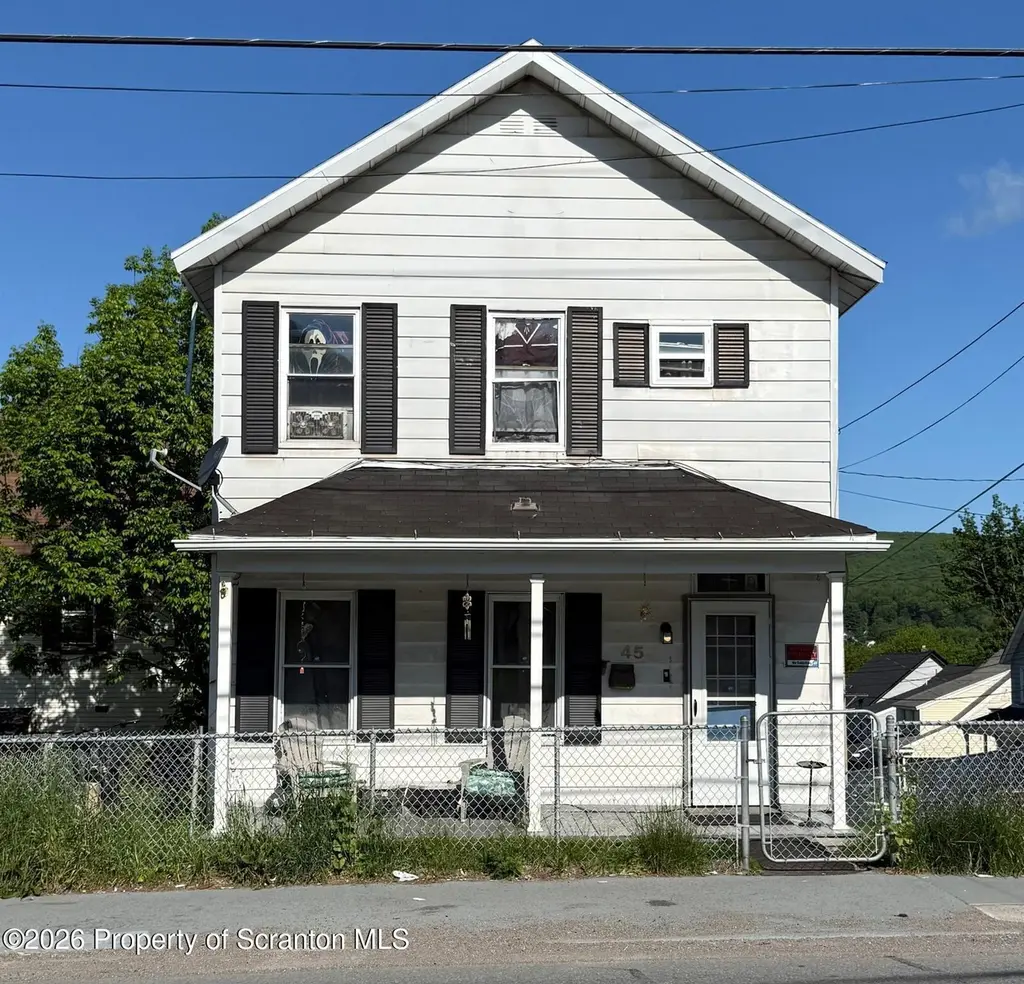
45 Belmont St · Carbondale, PA
Flood risk 1/10 · Minimal
- FEMA flood zone
- X (unshaded)
- Chance of flooding over 30 yrs
- 0.0%
- Est. flood insurance / yr
- $473 – $860
Fire risk 3/10 · Minor
- Est. fire insurance / yr
- $511 – $949
Heat risk 3/10 · Minor
- Hot days now (above 90°F)
- 8 days/yr
- Hot days in 30 yrs
- 18 days/yr
Wind risk 2/10 · Minimal
- Chance of severe wind over 30 yrs
- 4.0%
Air-quality risk 2/10 · Minimal
- Unhealthy air days now
- 1 days/yr
- Unhealthy air days in 30 yrs
- 1 days/yr
Risk factors via First Street. Map © Google.
Why this score? — see what drove the C grade
The composite is a weighted blend of 9 inputs, each scored 0–100. Each bar is that input's sub-score; the figure is the points it added to the 100-point composite (weight × sub-score).
- Cash flow +25.1/30.0
- DSCR +8.2/10.0
- ARV discount +7.5/15.0
- 1% rule +6.5/10.0
- Livability +3.6/5.0
- Rent growth +2.5/5.0
- Condition / age +2.5/5.0
- Schools +2.0/10.0
- Appreciation +0.0/10.0
$156,000
🖨 Deal sheet (PDF) 📄 Offer letter ✓ Due diligence
Listing remarks
First Time Home Buyers or Investors!!! LOW TAXES and only $156,000. 4 Bedrooms, 2 Baths. Granite counter tops, Basement is partially finished with 3/4 bath. House is solid and roof appears to be newer.
Key facts
- 3,920 sq ft lot
- Parking
- Built 1948
Property features AI
Finance
- HOA & community: Sidewalks in the community
Exterior
- Parking: On-street parking; Off-street parking with asphalt surface; 1 parking space (1 open space)
- Utilities: Public water; Public sewer; Natural gas available and connected; Electricity connected (circuit breakers); Cable available; Water connected; Sewer connected
- Home design: Single-family residence; Two levels; Built in 1948; Residential property
- Construction: Aluminum siding; Block and stone foundation
- Exterior features: Deck; Porch; Chain link front-yard fencing; Asphalt roof
Interior
- Kitchen: Electric oven; Electric range; Refrigerator
- Bedrooms: 7 bedrooms (including five labeled bedrooms and additional sleeping areas)
- Flooring: Carpet; Tile; Slate; Laminate
- Bathrooms: 2 full bathrooms
- Heating & cooling: Electric heating; Radiant heating; Steam heating; Natural gas heating; No central cooling
- Interior features: Drywall; Granite counters; Eat-in kitchen; Walk-up attic; Partially finished walk-out basement with bath stubbed
- Laundry & utility: Laundry in basement
Neighborhood map
What this means for you Summary
Snapshot
- This is a 7-bed/2.0-bath single-family listed at $156k.
Deal economics
- At list price, monthly cash flow is $345 ($4k/yr) — positive.
- The deal already cash-flows at list — no discount required.
- Meets the 1% rule at list price ($2k rent vs $156k).
- Cap rate 8.9% vs local median 4.8% in Carbondale — top-decile yield for the area; either an underpriced asset or a hidden risk that comps aren't pricing in. Stress-test before assuming the spread holds.
Location & tenants
- Location reads 72/100 on livability (#648 in PA) — a middle-class / working-renter tenant base. Strengths: crime A+, cost of living A+, housing A+; Watch: amenities D+, schools D, employment D.
- Carbondale Area SD (suburban): math 15% / reading 33% proficiency, ranked #480 of 539 in PA (top 89%) — low school quality limits family demand, transient renter base, plan for 1-2y turnover.
- Market conditions: 110 active listings in the ZIP; 251 units permitted in Lackawanna County in 2024 (0 in 5+ unit buildings).
- This rent runs 36% of the median local income ($60k/yr) — at the standard rent-burdened threshold; future hikes will face affordability resistance.
Forward outlook
- Local home prices are declining (-3.0%/yr); year-one equity from $1k of loan paydown is wiped out by about $5k of value loss. Plan a longer hold.
- Lackawanna County population projected to shrink 4% by 2050 — rents likely to lag national; underwrite the cash flow, not the appreciation.
Negotiation context
- Only 13 days on market — expect competitive offers; lowballing is unlikely to land.
- 2 sale attempts since 3y ago with the ask held roughly flat each time — persistent listings suggest the price (not the market) is what's stuck; bring a comps-based counter.
- Current owner paid $17k; list at $156k implies a 818% gain — meaningful room to come down on a strong offer.
Risks & watch-outs
- Watch-outs: built in 1948 — expect roof / HVAC / electrical / plumbing capex.
Questions for the listing agent
- Built in 1948 — when were the roof, HVAC, electrical panel, plumbing, and water heater last replaced?
- Is there a deadline driving the sale (1031 exchange, divorce, estate, relocation)? That informs how much negotiation room exists.
- Schools are D-rated, which usually means shorter tenancies and higher turnover. Who's the typical renter profile here, and what's been the actual vacancy rate?
- What's the average days-on-market for RENTAL listings here right now (not sales)? A rising rental-DOM trend means longer vacancies and softer asking-rent achievability than the comps imply.
- What's the recent tenant-quality profile in this submarket — average credit score on applications, eviction rate, late-payment / NSF rate, and stable-employment percentage? A property-management company in the area should have these aggregated.
- How much new for-sale + rental construction is in the pipeline within 1–3 miles? Heavy new supply typically softens prices + rents 12–24 months out; constrained supply supports both.
Investment metrics
- 1% rule
- 1.15% ✓
- Cap rate
- 8.94%
- Cash-on-cash
- 9.47%
- DSCR
- 1.42
- GRM
- 7.2
CMA / ARV
No comps found within radius.
Projected returns pro-forma
-3.0% appreciation · 3.0% rent growth · sell at horizon
- IRR
- -2.0%
- Equity multiple
- 0.92×
- Total profit
- $-3,308
- Equity at exit
- $23,260
- IRR
- 7.7%
- Equity multiple
- 1.58×
- Total profit
- $25,485
- Equity at exit
- $13,488
Cash invested: $43,680 (down + closing). Projections, not guarantees.
Landlord ↔ Tenant lean methodology
- Overall (STATE)
- 62 Landlord-Friendly
- State Pennsylvania
- 62 Landlord-Friendly · EVEN
- County
- — inherits STATE
- City
- — inherits STATE
ZIP-level market 18407
- Home prices YoY
- -29.8%
- Active inventory
- 110
- Price-to-rent
- 7.2×
Monthly cashflow live
- Estimated rent
- $1,801 medium interval (Pro) →
- Mortgage (P&I)
- −$818
- Tax est. 1.5%
- −$195 /mo · $2,340/yr
- Insurance
- −$65
- HOA
- −$0
- Vacancy / Maint / Mgmt
- −$378
- Net cashflow
- $345
Break-even live
Sensitivity live
| Price | -10% $452 | -5% $398 | +0% $345 | +5% $291 | +10% $237 |
|---|---|---|---|---|---|
| Rent | -10% $202 | -5% $273 | +0% $345 | +5% $416 | +10% $487 |
| Rate | -1.0pp $423 | -0.5pp $384 | base $345 | +0.5pp $304 | +1.0pp $263 |
UW: 25.0% down · 7.5% · 30yr · 1.5% tax · 5.0% vac · 8.0% maint · 8.0% mgmt
Financing live
Cash to close
- Down payment
- $39,000
- Closing costs
- $4,680
- Reserves months
- —
- Total cash needed
- —
Loan-product check · same deal, 3 products live
Conventional
25% down · 7.5% · 30yr
- Down + closing
- —
- Monthly P&I
- —
- Monthly cashflow
- —
- DSCR
- —
- Eligible?
- —
Personal DTI + credit; lowest rate.
DSCR
20% down · 8.5% · 30yr
- Down + closing
- —
- Monthly P&I
- —
- Monthly cashflow
- —
- DSCR
- —
- Eligible?
- —
No personal income docs; deal must DSCR.
Hard money
10% down · 12.0% · 12mo
- Down + closing
- —
- Monthly P&I
- —
- Monthly cashflow
- —
- DSCR
- —
- Eligible?
- —
Short-term bridge; refi at stabilization.
Listing history 11 events
-
2026-06-18days on market $156,000 Active 13 DOM
-
2026-06-17days on market $156,000 Active 12 DOM
-
2026-06-16days on market $156,000 Active 11 DOM
-
2026-06-15days on market $156,000 Active 10 DOM
-
2026-06-14days on market $156,000 Active 8 DOM
-
2026-06-13days on market $156,000 Active 7 DOM
-
2026-06-10days on market $156,000 Active 5 DOM
-
2026-06-09days on market $156,000 Active 4 DOM
-
2026-06-08days on market $156,000 Active 3 DOM
-
2026-06-07remarks 201-char remark
-
2026-06-07$156,000 Active 2 DOM
ⓘ Source: listings_history table (triggers on properties + properties_extension) + one-shot
backfill from property_details.listing_events for pre-trigger history.
Climate risk First Street
- Flood 1/10 Low FEMA zone X (unshaded) · 0% chance over 30 yrs
- Wildfire 3/10 Moderate
- Heat 3/10 Moderate 8 d/yr ≥90°F today · 18 d/yr by 30 yrs out
- Wind 2/10 Low 4% chance of damaging wind over 30 yrs
- Air quality 2/10 Low 1 unhealthy d/yr today · 1 by 30 yrs out
Nearby sold comps map
Loading sold comps map…
Walkable amenities ~0.75 mi
Loading nearby amenities…
Taxation est. · year 1
- Rental income
- $21,609
- − Mortgage interest
- −$8,738
- − Property taxes
- −$2,340
- − Insurance
- −$780
- − Repairs & maintenance
- −$1,729
- − Management
- −$1,729
- − Depreciation
- −$4,538
- Taxable income
- $1,755
- Est. tax owed @ 24.0%
- −$421
- After-tax cash flow
- $3,713/yr
For passive investors: Depreciation is non-cash, so a rental often shows a tax loss while cash-flowing — sheltering income. Rental losses are passive: they offset passive income freely, and up to $25,000/yr can offset ordinary (W-2) income if you actively participate and your MAGI is under $100k (phasing out to $0 by $150k); unused losses carry forward. On sale, claimed depreciation is recaptured at up to 25%, and gains may owe capital-gains tax (a 1031 exchange can defer both). Figures are a year-1 estimate at your 24.0% rate — not tax advice; consult a CPA.
Schools (NCES district)
- District
- Carbondale Area SD
- NCES district ID
- 4204980
- Math proficiency
- 15% ▼ -14.00%
- Reading proficiency
- 33% ▼ -23.00%
- Median HH income
- $35,070
- Composite
- 19.73/100
- National rank
- #8714
- State rank
- #480 of 539 in PA
Livability — Carbondale
- Score
- 72/100
- State rank
- #648
- US rank
- #6298
Category grades
Schools grade is shown separately in the Schools card above.
Census & demographics
- Census place
- Carbondale, PA
- County
- Lackawanna County · 134,448 people
- City population
- 14,445
- Metro
- Scranton--Wilkes-Barre, PA
- Population (ZIP)
- 14,445
- Household income
- $59,652
- Rent vs Own
- Severe rent burden
- 430.0
Population outlook (Lackawanna County) Hauer SSP2
- Today (2025)
- 210,652 people
- By 2030
- 208,623 · -1.0%
- By 2040
- 203,980 · -3.2%
- By 2050
- 201,069 · -4.5%
- By 2075
- 205,026 · -2.7%
- By 2100
- 210,851 · +0.1%
Race, ethnicity, and origin ACS 2023
- Neighborhood character
- Predominantly White (85%)
- Race & ethnicity
- White 85% Hispanic / Latino 9% Two or more races 6% Black 1% Asian 1%
- Hispanic origin (detail)
- Mexican 2% Puerto Rican 5%
- Common ancestry
- Romanian 11% Scotch-Irish 3% Subsaharan African 1%
- Foreign-born
- 2% · Canada, Vietnam
- Languages at home
- 95% English-only · Spanish 3% Other Indo-European 1% Russian/Polish/Slavic 1%
Political lean MEDSL · Lackawanna
- 2024 margin
- Toss-up / Even · D 51.0% · R 48.3%
- 2008→2024 swing
- -23.2pp toward R · 2008: 26.0pp · 2024: 2.8pp
- All cycles
- 2024: D+2.8 2020: D+8.4 2016: D+3.4 2012: D+27.4 2008: D+26.0
Not yet ingested
- Civics
- —
Market trends
- HPI YoY
- ▼ -59.46%
- Current HPI
- 140.1227
- Rent YoY
- —
- Metro
- Scranton--Wilkes-Barre, PA
- State GDP YoY
- ▲ 1.68%
- F500 in state
- 34
Industry mix (Fortune 500 HQ in PA)
| Industry | F500 HQs | Revenue |
|---|---|---|
| Healthcare | 2 | $309B |
|
||
| Insurance | 2 | $27B |
|
||
| Telecommunications / Media | 1 | $124B |
|
||
| Industrial Distribution | 1 | $22B |
|
||
| Financial Services | 1 | $20B |
|
||
| Chemicals / Materials | 1 | $18B |
|
||
Price history
+817.6% since first listed4 events — show timeline
- 2026-05-19 Listed $156,000 GSBR as distributed by MLS GRID
- 2023-04-14 Delisted — GSBR as distributed by MLS GRID
- 2023-04-13 Listed $159,000 GSBR as distributed by MLS GRID
- 2001-12-06 Sold (Public Records) $17,000 Public Records
Property tax history
+33.0%/yrLatest (2026): $26,291 · +1837.8% YoY. Source: county tax records.
Cash-flow waterfall
monthlySold comps — $/sqft
last 12 mo · ≤1 miLoading sold comps…