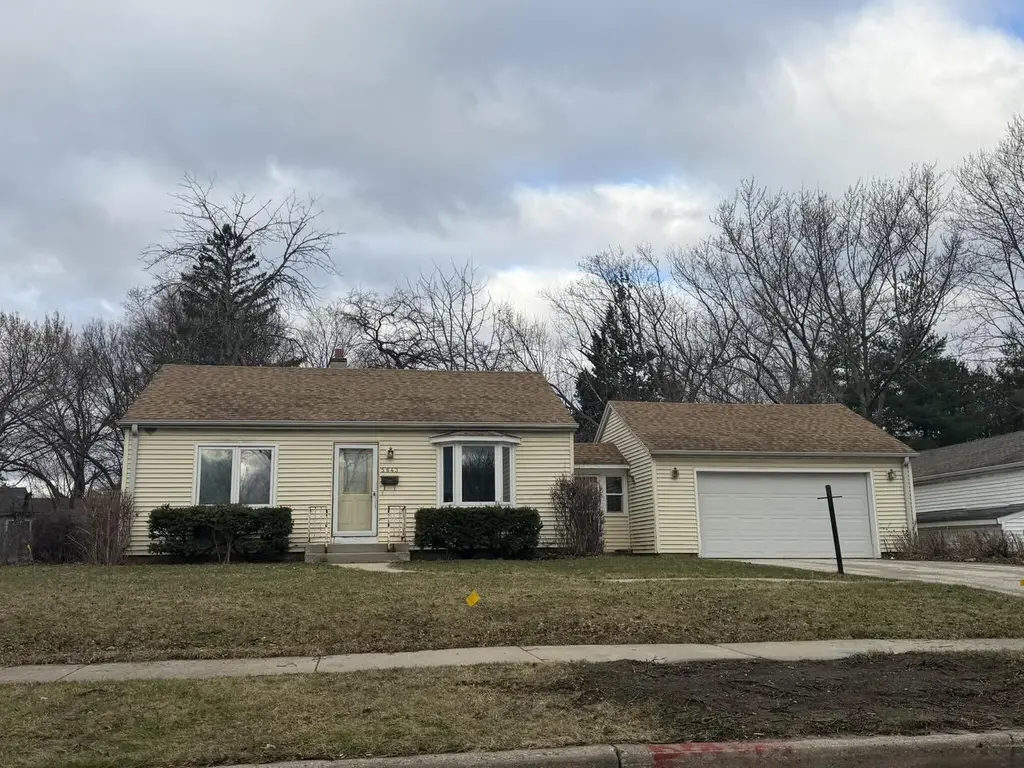
5643 N 66th St · Milwaukee, WI
Flood risk 1/10 · Minimal
- FEMA flood zone
- X (unshaded)
- Chance of flooding over 30 yrs
- 0.0%
- Est. flood insurance / yr
- $473 – $860
Fire risk 1/10 · Minimal
- Est. fire insurance / yr
- $636 – $1,182
Heat risk 2/10 · Minimal
- Hot days now (above 100°F)
- 7 days/yr
- Hot days in 30 yrs
- 13 days/yr
Wind risk 2/10 · Minimal
- Chance of severe wind over 30 yrs
- —
Air-quality risk 2/10 · Minimal
- Unhealthy air days now
- 2 days/yr
- Unhealthy air days in 30 yrs
- 2 days/yr
Risk factors via First Street. Map © Google.
Why this score? — see what drove the C- grade
The composite is a weighted blend of 9 inputs, each scored 0–100. Each bar is that input's sub-score; the figure is the points it added to the 100-point composite (weight × sub-score).
- Cash flow +18.9/30.0
- ARV discount +10.3/15.0
- DSCR +6.0/10.0
- 1% rule +5.5/10.0
- Livability +4.0/5.0
- Rent growth +3.8/5.0
- Condition / age +2.5/5.0
- Schools +1.2/10.0
- Appreciation +0.0/10.0
$119,900
🖨 Deal sheet (PDF) 📄 Offer letter ✓ Due diligence
Listing remarks MLS
2BR Ranch home with attached garage and full basement. Long time rental home has newer roof siding and windows. Long time rental home is occupied by long time tenant.
Key facts
- Newer roof
- Newer siding
- Full basement
Tags
Neighborhood map
What this means for you Summary
Snapshot
- This is a 2-bed/1.0-bath single-family listed at $120k.
Deal economics
- At list price, monthly cash flow is $124 ($1k/yr) — positive.
- The deal already cash-flows at list — no discount required.
- Meets the 1% rule at list price ($1k rent vs $120k).
- Recommended offer: $113k (6.0% below list) — sets the bar for market timing.
- Cap rate 7.5% vs local median 5.1% in Milwaukee — top-decile yield for the area; either an underpriced asset or a hidden risk that comps aren't pricing in. Stress-test before assuming the spread holds.
Location & tenants
- Location reads 81/100 on livability (#55 in WI, #1,534 nationally) — a professional / high-income tenant draw. Strengths: amenities A+, commute A+, cost of living A+; Watch: employment D+, schools F, crime F.
- Milwaukee School District (urban): math 10% / reading 18% proficiency, ranked #337 of 342 in WI (top 98%) — low school quality limits family demand, transient renter base, plan for 1-2y turnover; 77% free/reduced lunch — lower-income household profile, screen leases tightly.
- Market conditions: Rents rising fast (+5.3%/yr); 153 active listings in the ZIP; 27 comparable units currently listed for rent nearby; rentals lingering (median 45d on market — plan ~5-8 weeks vacancy on turnover, expect pricing pressure); 56% of comp listings sitting > 30 days — soft ceiling on asking rent; 1,017 units permitted in Milwaukee County in 2024 (803 in 5+ unit buildings).
- This rent runs 33% of the median local income ($46k/yr) — at the standard rent-burdened threshold; future hikes will face affordability resistance.
Forward outlook
- Local home prices are declining (-3.0%/yr); year-one equity from $829 of loan paydown is wiped out by about $4k of value loss. Plan a longer hold.
- Milwaukee County population projected at +4% by 2050 — modest demand growth; plan on rents tracking national, not racing it.
Negotiation context
- It's been on market 66 days — a 6% lower offer ($113k) is reasonable based on typical stale-listing flexibility.
- 4 sale attempts since 13y ago with the ask held roughly flat each time — persistent listings suggest the price (not the market) is what's stuck; bring a comps-based counter.
- Current owner paid $35k; list at $120k implies a 243% gain — meaningful room to come down on a strong offer.
Risks & watch-outs
- Watch-outs: built in 1948 — expect roof / HVAC / electrical / plumbing capex.
Questions for the listing agent
- It's been on market 66 days. Have you received any prior offers? Is the seller open to a 6% concession, seller financing, or rate buy-down credit?
- Built in 1948 — when were the roof, HVAC, electrical panel, plumbing, and water heater last replaced?
- Why hasn't it sold? Are there any deal-killer items the seller is aware of (foundation, flood, title, zoning, code violations)?
- Is there a deadline driving the sale (1031 exchange, divorce, estate, relocation)? That informs how much negotiation room exists.
- Schools are F-rated, which usually means shorter tenancies and higher turnover. Who's the typical renter profile here, and what's been the actual vacancy rate?
- Crime grade is F in this area — have there been break-ins, vandalism, or insurance claims at this property in the last 3 years? What carrier currently insures it and at what premium?
- What's the average days-on-market for RENTAL listings here right now (not sales)? A rising rental-DOM trend means longer vacancies and softer asking-rent achievability than the comps imply.
- What's the recent tenant-quality profile in this submarket — average credit score on applications, eviction rate, late-payment / NSF rate, and stable-employment percentage? A property-management company in the area should have these aggregated.
- How much new for-sale + rental construction is in the pipeline within 1–3 miles? Heavy new supply typically softens prices + rents 12–24 months out; constrained supply supports both.
Investment metrics
- 1% rule
- 1.05% ✓
- Cap rate
- 7.53%
- Cash-on-cash
- 4.42%
- DSCR
- 1.20
- GRM
- 7.9
CMA / ARV
- ARV (median comp)
- $127,760
- List price
- $119,900
- Delta
- -6.15%
- Verdict
- FAIR
- Comps
- 20 within 1.0 mi
Show comp detail 12 sales within ~0.75 mi
| Address | Dist | Beds/Ba | Sqft | Sold | Price | $/sf | Match |
|---|---|---|---|---|---|---|---|
| 5658 N 66th St | 0.04mi | 2/1.5 | 768 (-11%) | 2mo | $170,000 | $221 | 76 |
| 5324 N 68th St | 0.42mi | 2/2.0 | 879 (+2%) | 3mo | $108,000 | $123 | 71 |
| 7314 W Tallmadge Pl | 0.49mi | 3/1.0 (+1) | 864 (0%) | 2mo | $190,000 | $220 | 70 |
| 5863 N 62nd St | 0.38mi | 3/1.0 (+1) | 905 (+5%) | 0mo | $180,000 | $199 | 69 |
| 5272 N 65th St | 0.48mi | 3/1.0 (+1) | 912 (+6%) | 1mo | $127,000 | $139 | 63 |
| 5720 W Thurston Ave | 0.47mi | 2/1.0 | 792 (-8%) | 2mo | $164,900 | $208 | 62 |
| 5320 N 69th St | 0.45mi | 2/1.0 | 766 (-11%) | 2mo | $58,000 | $76 | 58 |
| 5359 N 62nd St | 0.45mi | 3/1.0 (+1) | 936 (+8%) | 3mo | $111,375 | $119 | 58 |
| 5919 N 67th St | 0.34mi | 3/1.0 (+1) | 988 (+14%) | 1mo | $155,000 | $157 | 54 |
| 5351 N 55th St | 0.73mi | 3/1.0 (+1) | 845 (-2%) | 3mo | $128,000 | $151 | 54 |
| 5353 N 56th St | 0.68mi | 3/3.0 (+1) | 832 (-4%) | 0mo | $125,000 | $150 | 49 |
| 5482 N 58th St | 0.51mi | 3/1.0 (+1) | 734 (-15%) | 2mo | $120,000 | $163 | 45 |
Match score weights: distance 35% · size 25% · config 20% · recency 20%. Top-matched comps best support the ARV.
Projected returns pro-forma
-3.0% appreciation · 5.29% rent growth · sell at horizon
- IRR
- -6.7%
- Equity multiple
- 0.75×
- Total profit
- $-8,545
- Equity at exit
- $17,877
- IRR
- 5.7%
- Equity multiple
- 1.47×
- Total profit
- $15,647
- Equity at exit
- $10,367
Cash invested: $33,572 (down + closing). Projections, not guarantees.
Landlord ↔ Tenant lean methodology
- Overall (STATE)
- 73 Landlord-Friendly
- State Wisconsin
- 73 Landlord-Friendly · R+2
- County
- — inherits STATE
- City
- — inherits STATE
ZIP-level market 53218
- Home prices YoY
- -19.0%
- Rents YoY
- 5.3%
- Active inventory
- 153
- Price-to-rent
- 7.9×
Monthly cashflow live
- Estimated rent
- $1,260 high interval (Pro) →
- Mortgage (P&I)
- −$629
- Tax from tax record
- −$193 /mo · $2,317/yr
- Insurance
- −$50
- HOA
- −$0
- Vacancy / Maint / Mgmt
- −$265
- Net cashflow
- $124
Break-even live
Sensitivity live
| Price | -10% $191 | -5% $157 | +0% $124 | +5% $90 | +10% $56 |
|---|---|---|---|---|---|
| Rent | -10% $24 | -5% $74 | +0% $124 | +5% $173 | +10% $223 |
| Rate | -1.0pp $184 | -0.5pp $154 | base $124 | +0.5pp $92 | +1.0pp $61 |
UW: 25.0% down · 7.5% · 30yr · 1.5% tax · 5.0% vac · 8.0% maint · 8.0% mgmt
Financing live
Cash to close
- Down payment
- $29,975
- Closing costs
- $3,597
- Reserves months
- —
- Total cash needed
- —
Loan-product check · same deal, 3 products live
Conventional
25% down · 7.5% · 30yr
- Down + closing
- —
- Monthly P&I
- —
- Monthly cashflow
- —
- DSCR
- —
- Eligible?
- —
Personal DTI + credit; lowest rate.
DSCR
20% down · 8.5% · 30yr
- Down + closing
- —
- Monthly P&I
- —
- Monthly cashflow
- —
- DSCR
- —
- Eligible?
- —
No personal income docs; deal must DSCR.
Hard money
10% down · 12.0% · 12mo
- Down + closing
- —
- Monthly P&I
- —
- Monthly cashflow
- —
- DSCR
- —
- Eligible?
- —
Short-term bridge; refi at stabilization.
Rent comps 27 comps
| Address | Beds | Baths | Sqft | Rent | $/sqft | DOM | Units | Dist |
|---|---|---|---|---|---|---|---|---|
| 5659 N 64th St Unit 5659A Milwaukee, WI | 2.0 | 1.0 | 1091 | $1,300 | $1.19 | 45d | 1 | 0.13mi |
| 5823 N 65th St Unit Upper Milwaukee, WI | 2.0 | 1.0 | 768 | $1,295 | $1.69 | 45d | 1 | 0.20mi |
| 5820 N 65th St #5822 Milwaukee, WI | 2.0 | 1.0 | 700 | $1,245 | $1.78 | 45d | 1 | 0.21mi |
| 5831 N 65th St Unit 5831 Milwaukee, WI | 3.0 | 1.0 | 900 | $1,195 | $1.33 | 45d | 1 | 0.21mi |
| 6221 W Thurston Ave #6223 Milwaukee, WI | 3.0 | 1.0 | 800 | $1,100 | $1.38 | 21d | 1 | 0.25mi |
| 5905 N 66th St Unit 66th Lower Milwaukee, WI | 3.0 | 1.0 | 1000 | $1,600 | $1.60 | 17d | 1 | 0.28mi |
| 5956 N 67th St Milwaukee, WI | 2.0 | 1.0 | 925 | $1,250 | $1.35 | 45d | 1 | 0.36mi |
| 5958 N 67th St Milwaukee, WI | 2.0 | 1.0 | 925 | $1,250 | $1.35 | 5d | 1 | 0.36mi |
| 6026 W Carmen Ave Milwaukee, WI | 2.0 | 1.0 | 672 | $1,195 | $1.78 | 25d | 1 | 0.38mi |
| 5657 N 60th St #5659 Milwaukee, WI | 3.0 | 1.0 | 878 | $995 | $1.13 | 18d | 1 | 0.38mi |
| 5950 N 69th St Unit 1 Milwaukee, WI | 2.0 | 1.0 | 1100 | $1,100 | $1.00 | 45d | 1 | 0.38mi |
| 5830 N 61st St Milwaukee, WI | 3.0 | 1.0 | 1024 | $1,450 | $1.42 | 45d | 1 | 0.40mi |
| 5688 N 56th St Milwaukee, WI | 3.0 | 1.0 | 850 | $1,445 | $1.70 | 13d | 1 | 0.58mi |
| 5530 N 76th St Apt 8 Milwaukee, WI | 1.0 | 1.0 | 900 | $995 | $1.11 | 45d | 1 | 0.62mi |
| 7632 W Leon Ter Unit C Milwaukee, WI | 2.0 | 1.5 | 1000 | $1,200 | $1.20 | 25d | 1 | 0.72mi |
| 7348 W Medford Ave Unit 7348A Milwaukee, WI | 2.0 | 1.0 | 1095 | $950 | $0.87 | 25d | 1 | 0.88mi |
| 5955 N 79th St Unit 1 Milwaukee, WI | 3.0 | 1.0 | 1100 | $1,650 | $1.50 | 45d | 1 | 0.88mi |
| 5908 N 80th St Milwaukee, WI | 3.0 | 1.0 | 1056 | $1,550 | $1.47 | 25d | 1 | 0.89mi |
| 8023 W Thurston Ave Unit 2 Milwaukee, WI | 2.0 | 1.0 | 850 | $850 | $1.00 | 45d | 1 | 0.90mi |
| 8037 W Thurston Ave Milwaukee, WI | 3.0 | 1.0 | 1040 | $1,600 | $1.54 | 45d | 1 | 0.92mi |
| 6518 W Hampton Ave Unit 2 Milwaukee, WI | 2.0 | 1.0 | 1100 | $1,200 | $1.09 | 45d | 1 | 1.10mi |
| 4843 N 72nd St Milwaukee, WI | 3.0 | 1.0 | 1014 | $1,485 | $1.46 | 45d | 1 | 1.12mi |
| 6535 N 58th St Milwaukee, WI | 2.0 | 1.0 | 962 | $1,195 | $1.24 | 18d | 1 | 1.18mi |
| 7701 W Hampton Ave Unit 6 Milwaukee, WI | 2.0 | 1.0 | 816 | $1,250 | $1.53 | 45d | 1 | 1.34mi |
| 4610 W Eggert Pl #4612 Milwaukee, WI | 3.0 | 1.0 | 852 | $1,095 | $1.29 | 25d | 1 | 1.36mi |
| 5050 N 47th St Milwaukee, WI | 2.0 | 1.0 | 1092 | $1,700 | $1.56 | 45d | 1 | 1.41mi |
| 5165-5167 N 45th St Unit 5165 Milwaukee, WI | 3.0 | 1.0 | 1020 | $1,200 | $1.18 | 18d | 1 | 1.42mi |
Listing history 26 events
-
2026-06-21days on market $119,900 Active 66 DOM
-
2026-06-18days on market $119,900 Active 63 DOM
-
2026-06-17days on market $119,900 Active 62 DOM
-
2026-06-16days on market $119,900 Active 61 DOM
-
2026-06-15days on market $119,900 Active 60 DOM
-
2026-06-13days on market $119,900 Active 58 DOM
-
2026-06-13days on market $119,900 Active 57 DOM
-
2026-06-09days on market $119,900 Active 54 DOM
-
2026-06-08days on market $119,900 Active 53 DOM
-
2026-06-07days on market $119,900 Active 52 DOM
-
2026-06-05days on market $119,900 Active 49 DOM
-
2026-06-03days on market $119,900 Active 48 DOM
-
2026-06-02days on market $119,900 Active 47 DOM
-
2026-06-01days on market $119,900 Active 46 DOM
-
2026-05-31days on market $119,900 Active 45 DOM
-
2026-04-16$119,900 Active 166-char remark
Show marketing remark (166 chars)
2BR Ranch home with attached garage and full basement. Long time rental home has newer roof siding and windows. Long time rental home is occupied by long time tenant.
-
2017-11-10soldstatus $35,000 Sold 149-char remark
Show marketing remark (149 chars)
Nice two bedroom ranch in a quiet Milwaukee neighborhood. This is a great opportunity for owner occupant or investor. Currently rented at $850/month.
-
2017-10-05historical Contingent 149-char remark
Show marketing remark (149 chars)
Nice two bedroom ranch in a quiet Milwaukee neighborhood. This is a great opportunity for owner occupant or investor. Currently rented at $850/month.
-
2017-09-28$65,900 Active 149-char remark
Show marketing remark (149 chars)
Nice two bedroom ranch in a quiet Milwaukee neighborhood. This is a great opportunity for owner occupant or investor. Currently rented at $850/month.
-
2013-08-05soldstatus $1,023,700
-
2013-06-06soldstatus $78,200
-
2013-02-10$56,857
-
2013-02-10historical
-
2013-02-09historical
-
2013-02-09$69,777
-
1997-06-03soldstatus $46,900
ⓘ Source: listings_history table (triggers on properties + properties_extension) + one-shot
backfill from property_details.listing_events for pre-trigger history.
Tax reassessment forecast WI · Partial reset (capped growth)
- Current annual tax
- $2,317 · $193/mo
- Projected year-2 tax
- $2,317 · $193/mo
- Expected delta
- $0/yr ($0/mo · 0.0%)
ⓘ Screening estimate from a state-policy table — verify with the county assessor before closing.
Climate risk First Street
- Flood 1/10 Low FEMA zone X (unshaded) · 0% chance over 30 yrs
- Wildfire 1/10 Low
- Heat 2/10 Low 7 d/yr ≥100°F today · 13 d/yr by 30 yrs out
- Wind 2/10 Low
- Air quality 2/10 Low 2 unhealthy d/yr today · 2 by 30 yrs out
Nearby sold comps map
Loading sold comps map…
Walkable amenities ~0.75 mi
Loading nearby amenities…
Taxation est. · year 1
- Rental income
- $15,120
- − Mortgage interest
- −$6,716
- − Property taxes
- −$2,317
- − Insurance
- −$600
- − Repairs & maintenance
- −$1,210
- − Management
- −$1,210
- − Depreciation
- −$3,488
- Taxable loss
- −$420
- Est. tax savings @ 24.0%
- +$101
- After-tax cash flow
- $1,584/yr
For passive investors: Depreciation is non-cash, so a rental often shows a tax loss while cash-flowing — sheltering income. Rental losses are passive: they offset passive income freely, and up to $25,000/yr can offset ordinary (W-2) income if you actively participate and your MAGI is under $100k (phasing out to $0 by $150k); unused losses carry forward. On sale, claimed depreciation is recaptured at up to 25%, and gains may owe capital-gains tax (a 1031 exchange can defer both). Figures are a year-1 estimate at your 24.0% rate — not tax advice; consult a CPA.
Schools (NCES district)
- District
- Milwaukee School District
- NCES district ID
- 5509600
- Math proficiency
- 10% ▼ -5.00%
- Reading proficiency
- 18% ▬ 0.00%
- Median HH income
- $36,339
- Composite
- 11.61/100
- National rank
- #9696
- State rank
- #337 of 342 in WI
Livability — Milwaukee
- Score
- 81/100
- State rank
- #55
- US rank
- #1534
Category grades
Schools grade is shown separately in the Schools card above.
Census & demographics
- Census place
- Milwaukee, WI
- County
- Milwaukee County · 926,379 people
- City population
- 573,768
- Metro
- Milwaukee-Waukesha, WI
- Population (ZIP)
- 41,196
- Household income
- $45,642
- Rent vs Own
- Severe rent burden
- 2421.0
Population outlook (Milwaukee County) Hauer SSP2
- Today (2025)
- 995,758 people
- By 2030
- 1,009,124 · +1.3%
- By 2040
- 1,028,128 · +3.3%
- By 2050
- 1,040,066 · +4.4%
- By 2075
- 1,057,849 · +6.2%
- By 2100
- 1,039,774 · +4.4%
Race, ethnicity, and origin ACS 2023
- Neighborhood character
- Predominantly Black (72%)
- Race & ethnicity
- Black 72% Asian 10% White 10% Hispanic / Latino 5% Two or more races 3%
- Common ancestry
- Romanian 1% Lithuanian 1%
- Foreign-born
- 6% · Philippines, Canada
- Languages at home
- 89% English-only · Other Asian/Pacific 7% Spanish 3%
Political lean MEDSL · Milwaukee
- 2024 margin
- Solid D (+38.5) · D 68.3% · R 29.8% · Other 1.8%
- 2008→2024 swing
- +2.7pp toward D · 2008: 35.9pp · 2024: 38.5pp
- All cycles
- 2024: D+38.5 2020: D+39.9 2016: D+37.5 2012: D+34.6 2008: D+35.9
Not yet ingested
- Civics
- —
Market trends
- HPI YoY
- ▼ -76.44%
- Current HPI
- 325.1975
- Rent YoY
- ▲ 5.29%
- Metro
- Milwaukee-Waukesha, WI
- State GDP YoY
- ▲ 2.10%
- F500 in state
- 20
Industry mix (Fortune 500 HQ in WI)
| Industry | F500 HQs | Revenue |
|---|---|---|
| Industrial Machinery | 4 | $23B |
|
||
| Industrial Technology | 2 | $36B |
|
||
| Insurance | 1 | $36B |
|
||
| Professional Services | 1 | $19B |
|
||
| Utilities | 1 | $9B |
|
||
| Consumer Goods | 1 | $3B |
|
||
Price history
+155.7% since first listed11 events — show timeline
- 2026-04-16 Listed $119,900 METROMLS
- 2017-11-10 Sold (MLS) $35,000 METROMLS
- 2017-10-05 Contingent — METROMLS
- 2017-09-28 Listed $65,900 METROMLS
- 2013-08-05 Sold (Public Records) $1,023,700 Public Records
- 2013-06-06 Sold (Public Records) $78,200 Public Records
- 2013-02-10 Listing Removed — METROMLS
- 2013-02-10 Listed $56,857 METROMLS
- 2013-02-09 Listed $69,777 METROMLS
- 2013-02-09 Listing Removed — METROMLS
- 1997-06-03 Sold (Public Records) $46,900 Public Records
Property tax history
-3.0%/yrLatest (2024): $2,317 · +20.1% YoY. Source: county tax records.
Cash-flow waterfall
monthlySold comps — $/sqft
last 12 mo · ≤1 miLoading sold comps…