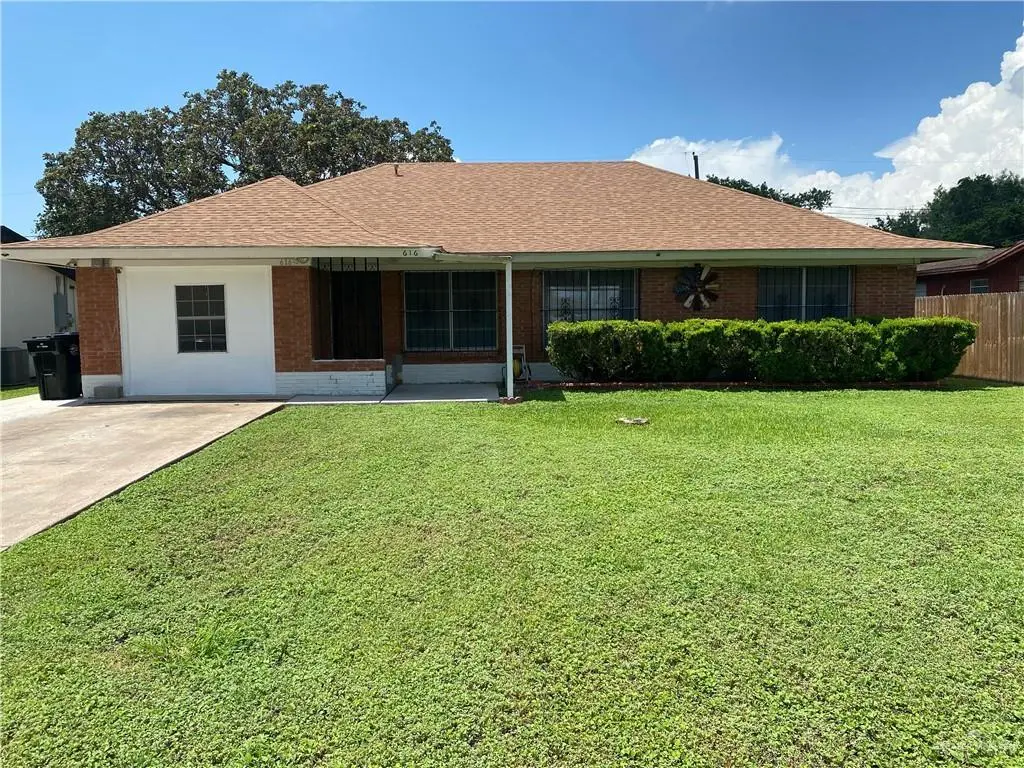
616 W 5th St · Weslaco, TX
Flood risk 6/10 · Moderate
- FEMA flood zone
- X (shaded)
- Chance of flooding over 30 yrs
- 0.74%
- Est. flood insurance / yr
- $507 – $1,088
Fire risk 1/10 · Minimal
- Est. fire insurance / yr
- $1,222 – $2,270
Heat risk 9/10 · Severe
- Hot days now (above 111°F)
- 7 days/yr
- Hot days in 30 yrs
- 23 days/yr
Wind risk 8/10 · Major
- Chance of severe wind over 30 yrs
- 99.0%
Air-quality risk 1/10 · Minimal
- Unhealthy air days now
- 0 days/yr
- Unhealthy air days in 30 yrs
- 0 days/yr
Risk factors via First Street. Map © Google.
Why this score? — see what drove the C grade
The composite is a weighted blend of 9 inputs, each scored 0–100. Each bar is that input's sub-score; the figure is the points it added to the 100-point composite (weight × sub-score).
- Cash flow +15.4/30.0
- ARV discount +15.0/15.0
- DSCR +4.7/10.0
- Appreciation +4.7/10.0
- 1% rule +4.4/10.0
- Livability +3.6/5.0
- Rent growth +2.5/5.0
- Condition / age +2.5/5.0
- Schools +2.2/10.0
$189,000
🖨 Deal sheet 📄 Offer letter ✓ Due diligence
Listing remarks
Spacious 5-bedroom, 2-living areas, 2-bath, home in the heart of Weslaco offering excellent flexibility for large families, multi-generational living, or investment potential! Conveniently located at 616 W 5th Street in an established neighborhood, this property features 2 living areas ideal for entertaining, a functional layout, and a 10x20 storage building perfect for tools, hobbies, or extra storage needs. Home also includes generator-ready connections and RV plug-in access at driveway. Recent improvements include new interior paint throughout, a roof approximately 8 years old, A/C approximately 5 years old, and a newer water heater for added peace of mind. Enjoy being minutes from Knapp
Key facts
- 2 living areas
- New interior paint
- Rv plug in access
Tags
Property features AI
Finance
- HOA & community: No homeowners association; Community sidewalks
Exterior
- Parking: No carport
- Utilities: Public water; City sewer; Electric service
- Home design: Brick construction
- Construction: Brick exterior; Shingle roof; Slab foundation
- Exterior features: Covered patio; Wood fencing; Curbs and gutters; Paved road access
Interior
- Kitchen: Refrigerator; Electric stove/range with coil elements; Electric water heater
- Flooring: Tile
- Bathrooms: 2 full bathrooms
- Heating & cooling: Central heating; Central air conditioning
- Interior features: Tile flooring; Mini blinds on windows; Countertops (other material)
- Laundry & utility: Washer and dryer included; Laundry room with washer/dryer connection
Neighborhood map
What this means for you Summary
Snapshot
- This is a 3-bed/1.0-bath single-family listed at $189k.
Deal economics
- At list price, monthly cash flow is $73 ($881/yr) — positive.
- The deal already cash-flows at list — no discount required.
- To meet the 1% rule (rent ≥ 1% of price), the offer needs to be $178k (5.9% below list).
- Recommended offer: $178k (5.9% below list) — sets the bar for 1% rule.
- Cap rate 6.8% vs local median 4.1% in Weslaco — top-decile yield for the area; either an underpriced asset or a hidden risk that comps aren't pricing in. Stress-test before assuming the spread holds.
Location & tenants
- Location reads 72/100 on livability (#277 in TX) — a middle-class / working-renter tenant base. Strengths: cost of living A+, housing A+, health & safety A+; Watch: employment D+, crime F, amenities F.
- Weslaco ISD (suburban): math 23% / reading 31% proficiency, ranked #705 of 826 in TX (top 85%) — low school quality limits family demand, transient renter base, plan for 1-2y turnover.
- Zoned schools: Memorial El (math 40% / reading 50%, grade D-, #1,133 of 4,322 statewide, top 27%, 1,075 students, 67% FRL); Central Middle (math 33% / reading 40%, grade F, #786 of 1,662 statewide, top 48%, 974 students, 70% FRL); Weslaco H S (math 25% / reading 33%, grade F, #1,147 of 1,632 statewide, top 71%, 2,553 students, 73% FRL).
- Market conditions: 708 active listings in the ZIP; 2 comparable units currently listed for rent nearby; 7,378 units permitted in Hidalgo County in 2024 (641 in 5+ unit buildings).
Forward outlook
- In year one you build about $203 of equity ($1k loan paydown + $-1k appreciation (-0.6% local appreciation)).
- Hidalgo County population projected at +28% by 2050 — long-run rental-demand tailwind backs the buy-and-hold thesis.
Negotiation context
- It's been on market 23 days — a 2% lower offer ($186k) is reasonable based on typical stale-listing flexibility.
Risks & watch-outs
- Climate carrying-cost: major flood risk; severe wind risk, 99% chance of damaging wind over 30y; extreme-heat days projected 7→23/yr by 2055 (HVAC capex compounding) — expect insurance premiums to compound above CPI over the hold.
Questions for the listing agent
- Is there a deadline driving the sale (1031 exchange, divorce, estate, relocation)? That informs how much negotiation room exists.
- Crime grade is F in this area — have there been break-ins, vandalism, or insurance claims at this property in the last 3 years? What carrier currently insures it and at what premium?
- What's the average days-on-market for RENTAL listings here right now (not sales)? A rising rental-DOM trend means longer vacancies and softer asking-rent achievability than the comps imply.
- What's the recent tenant-quality profile in this submarket — average credit score on applications, eviction rate, late-payment / NSF rate, and stable-employment percentage? A property-management company in the area should have these aggregated.
- How much new for-sale + rental construction is in the pipeline within 1–3 miles? Heavy new supply typically softens prices + rents 12–24 months out; constrained supply supports both.
Investment metrics
- 1% rule
- 0.94% ✗
- Cap rate
- 6.76%
- Cash-on-cash
- 1.67%
- DSCR
- 1.07
- GRM
- 8.9
CMA / ARV
- ARV (on-the-fly)
- $232,132
- Comps found
- 12
Show comp detail 12 sales within ~0.75 mi
| Address | Dist | Beds/Ba | Sqft | Sold | Price | $/sf | Match |
|---|---|---|---|---|---|---|---|
| 506 S Clifford Dr | 0.47mi | 3/2.0 | 1,738 (-2%) | 0mo | $249,000 | $143 | 70 |
| 703 S Border Ave | 0.30mi | 3/2.0 | 1,632 (-8%) | 2mo | $248,000 | $152 | 67 |
| 307 W 8th St | 0.47mi | 3/2.0 | 1,826 (+3%) | 2mo | $99,000 | $54 | 67 |
| 616 S Indiana Ave | 0.31mi | 4/1.5 (+1) | 1,764 (-0%) | 21mo | $169,000 | $96 | 60 |
| 904 W 8th St | 0.39mi | 3/2.0 | 1,654 (-7%) | 9mo | $179,900 | $109 | 60 |
| 505 S Clifford Dr S | 0.45mi | 4/3.0 (+1) | 1,885 (+6%) | 5mo | $215,000 | $114 | 51 |
| 711 S Kansas Ave | 0.59mi | 3/2.0 | 1,720 (-3%) | 19mo | $209,900 | $122 | 47 |
| 722 S Missouri Ave | 0.51mi | 2/2.0 (-1) | 1,659 (-6%) | 12mo | $175,000 | $105 | 47 |
| 600 W 11th St | 0.56mi | 3/2.0 | 1,665 (-6%) | 16mo | $239,500 | $144 | 47 |
| 1103 Ash Dr | 0.46mi | 3/2.0 | 1,986 (+12%) | 12mo | $260,000 | $131 | 44 |
| 1516 Agate Dr | 0.65mi | 3/2.0 | 1,988 (+12%) | 12mo | $315,000 | $158 | 35 |
| 907 Amethyst Dr | 0.68mi | 3/2.0 | 2,023 (+14%) | 8mo | $270,000 | $133 | 34 |
Match score weights: distance 35% · size 25% · config 20% · recency 20%. Top-matched comps best support the ARV.
Projected returns pro-forma
-0.58% appreciation · 3.0% rent growth · sell at horizon
- IRR
- -2.5%
- Equity multiple
- 0.89×
- Total profit
- $-5,938
- Equity at exit
- $49,423
- IRR
- 3.8%
- Equity multiple
- 1.38×
- Total profit
- $20,176
- Equity at exit
- $55,213
Cash invested: $52,920 (down + closing). Projections, not guarantees.
Landlord ↔ Tenant lean methodology
- Overall (STATE)
- 87 Strongly Landlord-Friendly
- State Texas
- 87 Strongly Landlord-Friendly · R+5
- County
- — inherits STATE
- City
- — inherits STATE
ZIP-level market 78596
- Home prices YoY
- -0.2%
- Active inventory
- 708
- Price-to-rent
- 8.9×
Monthly cashflow live
- Estimated rent
- $1,779 medium interval (Pro) →
- Mortgage (P&I)
- −$991
- Tax from tax record
- −$262 /mo · $3,143/yr
- Insurance
- −$79
- HOA
- −$0
- Vacancy / Maint / Mgmt
- −$374
- Net cashflow
- $73
Break-even live
UW: 25.0% down · 7.5% · 30yr · 1.5% tax · 5.0% vac · 8.0% maint · 8.0% mgmt
Financing live
Cash to close
- Down payment
- $47,250
- Closing costs
- $5,670
- Reserves months
- —
- Total cash needed
- —
Loan-product check · same deal, 3 products live
Conventional
25% down · 7.5% · 30yr
- Down + closing
- —
- Monthly P&I
- —
- Monthly cashflow
- —
- DSCR
- —
- Eligible?
- —
Personal DTI + credit; lowest rate.
DSCR
20% down · 8.5% · 30yr
- Down + closing
- —
- Monthly P&I
- —
- Monthly cashflow
- —
- DSCR
- —
- Eligible?
- —
No personal income docs; deal must DSCR.
Hard money
10% down · 12.0% · 12mo
- Down + closing
- —
- Monthly P&I
- —
- Monthly cashflow
- —
- DSCR
- —
- Eligible?
- —
Short-term bridge; refi at stabilization.
Rent comps 2 comps
| Address | Beds | Baths | Sqft | Rent | $/sqft | DOM | Units | Dist |
|---|---|---|---|---|---|---|---|---|
| 2211 Tomatillo Dr Weslaco, TX | 3.0 | 2.0 | 1361 | $2,200 | $1.62 | 23d | 1 | 1.13mi |
| 1501 E 1st St Weslaco, TX | 3.0 | 2.0 | 1781 | $1,400 | $0.79 | 43d | 1 | 1.32mi |
Listing history 17 events
-
2026-06-18days on market $189,000 Active 23 DOM
-
2026-06-17days on market $189,000 Active 22 DOM
-
2026-06-16days on market $189,000 Active 21 DOM
-
2026-06-15days on market $189,000 Active 20 DOM
-
2026-06-15days on market $189,000 Active 19 DOM
-
2026-06-13days on market $189,000 Active 18 DOM
-
2026-06-12days on market $189,000 Active 17 DOM
-
2026-06-09days on market $189,000 Active 14 DOM
-
2026-06-08days on market $189,000 Active 13 DOM
-
2026-06-08days on market $189,000 Active 12 DOM
-
2026-06-07days on market $189,000 Active 11 DOM
-
2026-06-03days on market $189,000 Active 8 DOM
-
2026-06-02days on market $189,000 Active 7 DOM
-
2026-06-01days on market $189,000 Active 6 DOM
-
2026-05-31days on market $189,000 Active 5 DOM
-
2026-05-26$189,000 Active
-
2007-09-28soldstatus
ⓘ Source: listings_history table (triggers on properties + properties_extension) + one-shot
backfill from property_details.listing_events for pre-trigger history.
Tax reassessment forecast TX · Resets to sale price
- Current annual tax
- $3,143 · $262/mo
- Projected year-2 tax
- $3,459 · $288/mo
- Expected delta
- +$315/yr (+$26/mo · 10.0%)
ⓘ Screening estimate from a state-policy table — verify with the county assessor before closing.
Climate risk First Street
- Flood 6/10 Major FEMA zone X (shaded) · 74% chance over 30 yrs
- Wildfire 1/10 Low
- Heat 9/10 Extreme 7 d/yr ≥111°F today · 23 d/yr by 30 yrs out
- Wind 8/10 Severe 99% chance of damaging wind over 30 yrs
- Air quality 1/10 Low 0 unhealthy d/yr today · 0 by 30 yrs out
Nearby sold comps map
Loading sold comps map…
Walkable amenities ~0.75 mi
Loading nearby amenities…
Taxation est. · year 1
- Rental income
- $21,346
- − Mortgage interest
- −$10,587
- − Property taxes
- −$3,143
- − Insurance
- −$945
- − Repairs & maintenance
- −$1,708
- − Management
- −$1,708
- − Depreciation
- −$5,498
- Taxable loss
- −$2,243
- Est. tax savings @ 24.0%
- +$538
- After-tax cash flow
- $1,420/yr
For passive investors: Depreciation is non-cash, so a rental often shows a tax loss while cash-flowing — sheltering income. Rental losses are passive: they offset passive income freely, and up to $25,000/yr can offset ordinary (W-2) income if you actively participate and your MAGI is under $100k (phasing out to $0 by $150k); unused losses carry forward. On sale, claimed depreciation is recaptured at up to 25%, and gains may owe capital-gains tax (a 1031 exchange can defer both). Figures are a year-1 estimate at your 24.0% rate — not tax advice; consult a CPA.
Schools (NCES district)
- District
- Weslaco ISD
- NCES district ID
- 4844960
- Math proficiency
- 23% ▼ -29.00%
- Reading proficiency
- 31% ▼ -9.00%
- Median HH income
- $32,867
- Composite
- 22.05/100
- National rank
- #8196
- State rank
- #705 of 826 in TX
Livability — Weslaco
- Score
- 72/100
- State rank
- #277
- US rank
- #6469
Category grades
Schools grade is shown separately in the Schools card above.
Census & demographics
- Census place
- Weslaco, TX
- Population (ZIP)
- 38,942
Population outlook (Hidalgo County) Hauer SSP2
- Today (2025)
- 955,232 people
- By 2030
- 1,009,774 · +5.7%
- By 2040
- 1,120,332 · +17.3%
- By 2050
- 1,225,036 · +28.2%
- By 2075
- 1,439,189 · +50.7%
- By 2100
- 1,533,429 · +60.5%
Race, ethnicity, and origin ACS 2023
- Neighborhood character
- Predominantly Hispanic (86%)
- Race & ethnicity
- Hispanic / Latino 86% Two or more races 38% White 13%
- Hispanic origin (detail)
- Mexican 82%
- Common ancestry
- Slovak 1%
- Foreign-born
- 17% · Canada
- Languages at home
- 27% English-only · Spanish 72%
Political lean MEDSL · Hidalgo
- 2024 margin
- Toss-up / Even · D 48.1% · R 51.0%
- 2008→2024 swing
- -41.6pp toward R · 2008: 38.7pp · 2024: -2.9pp
- All cycles
- 2024: R+2.9 2020: D+17.1 2016: D+40.5 2012: D+41.8 2008: D+38.7
Not yet ingested
- Civics
- —
Market trends
- HPI YoY
- ▼ -0.58%
- Current HPI
- 261.5117
- Rent YoY
- —
- Metro
- —
- State GDP YoY
- ▲ 3.95%
- F500 in state
- 110
Industry mix (Fortune 500 HQ in TX)
| Industry | F500 HQs | Revenue |
|---|---|---|
| Energy | 16 | $1,198B |
|
||
| Technology | 5 | $198B |
|
||
| Engineering / Construction | 4 | $72B |
|
||
| Energy Services | 3 | $60B |
|
||
| Utilities | 3 | $41B |
|
||
| Healthcare | 2 | $330B |
|
||
Price history
2 events — show timeline
- 2026-05-26 Listed $189,000 MCALLENMLS
- 2007-09-28 Sold (Public Records) — Public Records
Property tax history
+3.1%/yrLatest (2025): $3,143 · +9.8% YoY. Source: county tax records.
Cash-flow waterfall
monthlySold comps — $/sqft
last 12 mo · ≤1 miLoading sold comps…