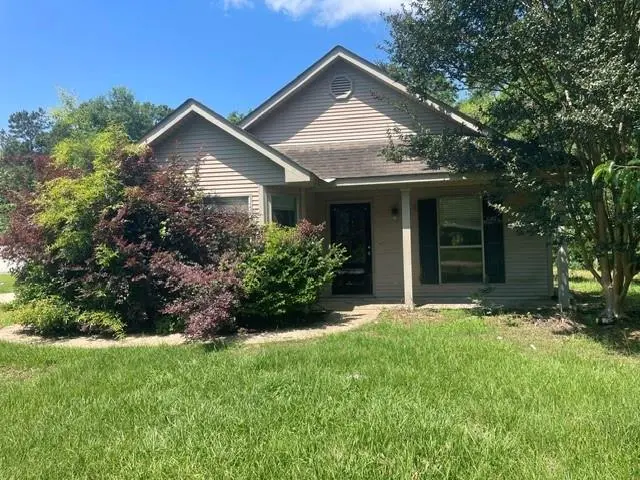
53515 Elizabeth St · Hammond, LA
Flood risk 9/10 · Severe
- FEMA flood zone
- A
- Chance of flooding over 30 yrs
- 0.99%
- Est. flood insurance / yr
- $1,009 – $1,996
Fire risk 6/10 · Moderate
- Est. fire insurance / yr
- $1,269 – $2,357
Heat risk 8/10 · Major
- Hot days now (above 109°F)
- 7 days/yr
- Hot days in 30 yrs
- 20 days/yr
Wind risk 9/10 · Severe
- Chance of severe wind over 30 yrs
- 99.0%
Air-quality risk 2/10 · Minimal
- Unhealthy air days now
- 0 days/yr
- Unhealthy air days in 30 yrs
- 1 days/yr
Risk factors via First Street. Map © Google.
Why this score? — see what drove the B+ grade
The composite is a weighted blend of 9 inputs, each scored 0–100. Each bar is that input's sub-score; the figure is the points it added to the 100-point composite (weight × sub-score).
- Cash flow +30.0/30.0
- ARV discount +15.0/15.0
- 1% rule +10.0/10.0
- DSCR +10.0/10.0
- Livability +3.5/5.0
- Rent growth +2.5/5.0
- Condition / age +2.5/5.0
- Schools +2.0/10.0
- Appreciation +0.0/10.0
$99,900
🖨 Deal sheet (PDF) 📄 Offer letter ✓ Due diligence
Listing remarks MLS
Vinyl Siding 3bd 2ba home on a 0.83 corner lot. Enjoy country living in Loranger, LA. This home is just around the corner to schools and grocery. 15 MINUTES FROM HAMMOND. Featuring an open floor plan, spacious yard in A CUL-DE-SAC neighborhood. With some TLC this home can be amazing starter home or investment rental Property.
Key facts
- Spacious yard
- Corner lot
- 0.83 acre lot
Tags
Property features AI
Finance
- Other: Property is human-modified
Exterior
- Utilities: Well water; Sewer connected to treatment plant
- Home design: Single-story home
- Construction: Vinyl siding; Shingle roof; Slab foundation; Built/maintained in average condition
- Exterior features: Corner lot; Outside city limits; Rectangular lot; Lot dimensions approximately 158 x 227
Interior
- Bedrooms: Total of 7 rooms (bedrooms and other rooms included)
- Bathrooms: 2 full bathrooms
- Heating & cooling: Central heating; Central air conditioning
- Interior features: Cable TV
- Laundry & utility: Washer hookup; Dryer hookup
Neighborhood map
What this means for you Summary
Snapshot
- This is a 3-bed/2.0-bath single-family listed at $100k.
Deal economics
- At list price, monthly cash flow is $545 ($7k/yr) — positive.
- The deal already cash-flows at list — no discount required.
- Meets the 1% rule at list price ($2k rent vs $100k).
- Cap rate 14.3% vs local median 5.0% in Hammond — top-decile yield for the area; either an underpriced asset or a hidden risk that comps aren't pricing in. Stress-test before assuming the spread holds.
Location & tenants
- Location reads 69/100 on livability (#77 in LA) — a middle-class / working-renter tenant base. Strengths: cost of living A+, health & safety A+; Watch: amenities C-, commute D+, crime F.
- Tangipahoa Parish (rural): math 18% / reading 29% proficiency, ranked #63 of 98 in LA (top 64%) — low school quality limits family demand, transient renter base, plan for 1-2y turnover; 73% free/reduced lunch — lower-income household profile, screen leases tightly.
- Zoned schools: Loranger Elementary School (math 13% / reading 24%, grade F, #467 of 646 statewide, top 73%, 834 students, 66% FRL); Loranger Middle School (math 15% / reading 31%, grade F, #145 of 218 statewide, top 69%, 610 students, 62% FRL); Loranger High School (math 22% / reading 37%, grade F, #127 of 265 statewide, top 49%, 666 students, 58% FRL).
- Market conditions: 60 active listings in the ZIP; 1,085 units permitted in Tangipahoa Parish in 2024 (378 in 5+ unit buildings).
Forward outlook
- Local home prices are declining (-3.0%/yr); year-one equity from $691 of loan paydown is wiped out by about $3k of value loss. Plan a longer hold.
- Tangipahoa County population projected at +22% by 2050 — long-run rental-demand tailwind backs the buy-and-hold thesis.
- At projected returns (-3.0% appreciation + 3.0% rent growth), your $28k cash investment doubles in ~6 years — after that, you're playing with house money.
Negotiation context
- Only 6 days on market — expect competitive offers; lowballing is unlikely to land.
- 2 sale attempts with the ask held roughly flat each time — persistent listings suggest the price (not the market) is what's stuck; bring a comps-based counter.
Risks & watch-outs
- Watch-outs: flood insurance adds $125/mo.
- Climate carrying-cost: in FEMA flood zone A (mandatory federal flood insurance); severe wind risk, 99% chance of damaging wind over 30y; major wildfire risk; extreme-heat days projected 7→20/yr by 2055 (HVAC capex compounding) — expect insurance premiums to compound above CPI over the hold.
Questions for the listing agent
- What's the actual annual flood-insurance premium (NFIP or private), and is the property in a SFHA with mandatory coverage?
- Is there a deadline driving the sale (1031 exchange, divorce, estate, relocation)? That informs how much negotiation room exists.
- Schools are D-rated, which usually means shorter tenancies and higher turnover. Who's the typical renter profile here, and what's been the actual vacancy rate?
- Crime grade is F in this area — have there been break-ins, vandalism, or insurance claims at this property in the last 3 years? What carrier currently insures it and at what premium?
- What's the average days-on-market for RENTAL listings here right now (not sales)? A rising rental-DOM trend means longer vacancies and softer asking-rent achievability than the comps imply.
- What's the recent tenant-quality profile in this submarket — average credit score on applications, eviction rate, late-payment / NSF rate, and stable-employment percentage? A property-management company in the area should have these aggregated.
- How much new for-sale + rental construction is in the pipeline within 1–3 miles? Heavy new supply typically softens prices + rents 12–24 months out; constrained supply supports both.
Investment metrics
- 1% rule
- 1.62% ✓
- Cap rate
- 14.34%
- Cash-on-cash
- 28.73%
- DSCR
- 2.28
- GRM
- 5.1
CMA / ARV
- ARV (median comp)
- $198,172
- List price
- $99,900
- Delta
- -49.59%
- Verdict
- UNDERPRICED
- Comps
- 5 within 1.0 mi
Show comp detail 3 sales within ~0.75 mi
| Address | Dist | Beds/Ba | Sqft | Sold | Price | $/sf | Match |
|---|---|---|---|---|---|---|---|
| 53515 Elizabeth St | 0.00mi | 3/2.0 | 1,200 (-2%) | 1mo | $100,000 | $83 | 97 |
| 54085 Allman St | 0.35mi | 3/2.0 | 1,244 (+2%) | 10mo | $178,000 | $143 | 72 |
| 54150 Passman Rd | 0.58mi | 3/2.0 | 1,300 (+7%) | 13mo | $220,000 | $169 | 51 |
Match score weights: distance 35% · size 25% · config 20% · recency 20%. Top-matched comps best support the ARV.
Projected returns pro-forma
-3.0% appreciation · 3.0% rent growth · sell at horizon
- IRR
- 16.5%
- Equity multiple
- 1.66×
- Total profit
- $18,548
- Equity at exit
- $14,895
- IRR
- 25.0%
- Equity multiple
- 3.18×
- Total profit
- $61,022
- Equity at exit
- $8,638
Cash invested: $27,972 (down + closing). Projections, not guarantees.
Landlord ↔ Tenant lean methodology
- Overall (STATE)
- 90 Strongly Landlord-Friendly
- State Louisiana
- 90 Strongly Landlord-Friendly · R+12
- County
- — inherits STATE
- City
- — inherits STATE
ZIP-level market 70446
- Home prices YoY
- -33.1%
- Active inventory
- 60
- Price-to-rent
- 5.1×
Monthly cashflow live
- Estimated rent
- $1,618 medium interval (Pro) →
- Mortgage (P&I)
- −$524
- Tax from tax record
- −$43 /mo · $517/yr
- Insurance
- −$42
- Flood insurance flood zone
- −$125 /mo · $1,502/yr
- HOA
- −$0
- Vacancy / Maint / Mgmt
- −$340
- Net cashflow
- $545
Break-even live
Sensitivity live
| Price | -10% $601 | -5% $573 | +0% $545 | +5% $516 | +10% $488 |
|---|---|---|---|---|---|
| Rent | -10% $417 | -5% $481 | +0% $545 | +5% $609 | +10% $672 |
| Rate | -1.0pp $595 | -0.5pp $570 | base $545 | +0.5pp $519 | +1.0pp $492 |
UW: 25.0% down · 7.5% · 30yr · 1.5% tax · 5.0% vac · 8.0% maint · 8.0% mgmt
Financing live
Cash to close
- Down payment
- $24,975
- Closing costs
- $2,997
- Reserves months
- —
- Total cash needed
- —
Loan-product check · same deal, 3 products live
Conventional
25% down · 7.5% · 30yr
- Down + closing
- —
- Monthly P&I
- —
- Monthly cashflow
- —
- DSCR
- —
- Eligible?
- —
Personal DTI + credit; lowest rate.
DSCR
20% down · 8.5% · 30yr
- Down + closing
- —
- Monthly P&I
- —
- Monthly cashflow
- —
- DSCR
- —
- Eligible?
- —
No personal income docs; deal must DSCR.
Hard money
10% down · 12.0% · 12mo
- Down + closing
- —
- Monthly P&I
- —
- Monthly cashflow
- —
- DSCR
- —
- Eligible?
- —
Short-term bridge; refi at stabilization.
Listing history 4 events
-
2026-05-13$99,900 Active 327-char remark
Show marketing remark (327 chars)
Vinyl Siding 3bd 2ba home on a 0.83 corner lot. Enjoy country living in Loranger, LA. This home is just around the corner to schools and grocery. 15 MINUTES FROM HAMMOND. Featuring an open floor plan, spacious yard in A CUL-DE-SAC neighborhood. With some TLC this home can be amazing starter home or investment rental Property.
-
2018-08-08soldstatus $130,000
-
2009-11-30soldstatus $133,000
ⓘ Source: listings_history table (triggers on properties + properties_extension) + one-shot
backfill from property_details.listing_events for pre-trigger history.
Tax reassessment forecast LA · Resets to sale price
- Current annual tax
- $517 · $43/mo
- Projected year-2 tax
- $549 · $46/mo
- Expected delta
- +$33/yr (+$3/mo · 6.3%)
ⓘ Screening estimate from a state-policy table — verify with the county assessor before closing.
Climate risk First Street
- Flood 9/10 Extreme FEMA zone A · 99% chance over 30 yrs
- Wildfire 6/10 Major
- Heat 8/10 Severe 7 d/yr ≥109°F today · 20 d/yr by 30 yrs out
- Wind 9/10 Extreme 99% chance of damaging wind over 30 yrs
- Air quality 2/10 Low 0 unhealthy d/yr today · 1 by 30 yrs out
Nearby sold comps map
Loading sold comps map…
Walkable amenities ~0.75 mi
Loading nearby amenities…
Taxation est. · year 1
- Rental income
- $19,418
- − Mortgage interest
- −$5,596
- − Property taxes
- −$517
- − Insurance
- −$2,002
- − Repairs & maintenance
- −$1,553
- − Management
- −$1,553
- − Depreciation
- −$2,906
- Taxable income
- $5,291
- Est. tax owed @ 24.0%
- −$1,270
- After-tax cash flow
- $5,265/yr
For passive investors: Depreciation is non-cash, so a rental often shows a tax loss while cash-flowing — sheltering income. Rental losses are passive: they offset passive income freely, and up to $25,000/yr can offset ordinary (W-2) income if you actively participate and your MAGI is under $100k (phasing out to $0 by $150k); unused losses carry forward. On sale, claimed depreciation is recaptured at up to 25%, and gains may owe capital-gains tax (a 1031 exchange can defer both). Figures are a year-1 estimate at your 24.0% rate — not tax advice; consult a CPA.
Schools (NCES district)
- District
- Tangipahoa Parish
- NCES district ID
- 2201680
- Math proficiency
- 18% ▼ -32.00%
- Reading proficiency
- 29% ▼ -31.00%
- Median HH income
- $41,283
- Composite
- 19.94/100
- National rank
- #8676
- State rank
- #63 of 98 in LA
Livability — Hammond
- Score
- 69/100
- State rank
- #77
- US rank
- #8868
Category grades
Schools grade is shown separately in the Schools card above.
Census & demographics
- City population
- 51,394
- Population (ZIP)
- 6,871
Population outlook (Tangipahoa County) Hauer SSP2
- Today (2025)
- 144,204 people
- By 2030
- 151,413 · +5.0%
- By 2040
- 164,374 · +14.0%
- By 2050
- 175,427 · +21.7%
- By 2075
- 195,165 · +35.3%
- By 2100
- 201,641 · +39.8%
Race, ethnicity, and origin ACS 2023
- Neighborhood character
- Predominantly White (81%)
- Race & ethnicity
- White 81% Black 9% Hispanic / Latino 5% Two or more races 5%
- Hispanic origin (detail)
- Common ancestry
- Lithuanian 13%
- Foreign-born
- 1% · Canada
- Languages at home
- 95% English-only · Spanish 4% French/Haitian/Cajun 1%
Political lean MEDSL · Tangipahoa
- 2024 margin
- Solid R (+37.4) · D 30.6% · R 68.0% · Other 1.3%
- 2008→2024 swing
- -6.5pp toward R · 2008: -30.9pp · 2024: -37.4pp
- All cycles
- 2024: R+37.4 2020: R+32.8 2016: R+32.6 2012: R+27.7 2008: R+30.9
Not yet ingested
- Civics
- —
Market trends
- HPI YoY
- ▼ -66.41%
- Current HPI
- 133.9227
- Rent YoY
- —
- Metro
- —
- State GDP YoY
- ▲ 3.29%
- F500 in state
- 10
Industry mix (Fortune 500 HQ in LA)
| Industry | F500 HQs | Revenue |
|---|---|---|
| Telecommunications | 2 | $23B |
|
||
| Utilities | 1 | $12B |
|
||
| Wholesale / Distribution | 1 | $5B |
|
||
| Advertising | 1 | $2B |
|
||
Price history
-24.8% since first listed8 events — show timeline
- 2026-05-29 Sold (MLS) $100,000 AcadianaMLS
- 2026-05-29 Sold (MLS) $100,000 GSREIN
- 2026-05-20 Pending — AcadianaMLS
- 2026-05-20 Pending — GSREIN
- 2026-05-13 Listed $99,900 AcadianaMLS
- 2026-05-13 Listed $99,900 GSREIN
- 2018-08-08 Sold (Public Records) $130,000 Public Records
- 2009-11-30 Sold (Public Records) $133,000 Public Records
Property tax history
-0.1%/yrLatest (2025): $517 · +0.6% YoY. Source: county tax records.
Cash-flow waterfall
monthlySold comps — $/sqft
last 12 mo · ≤1 miLoading sold comps…