 🏷️ Likely Rental
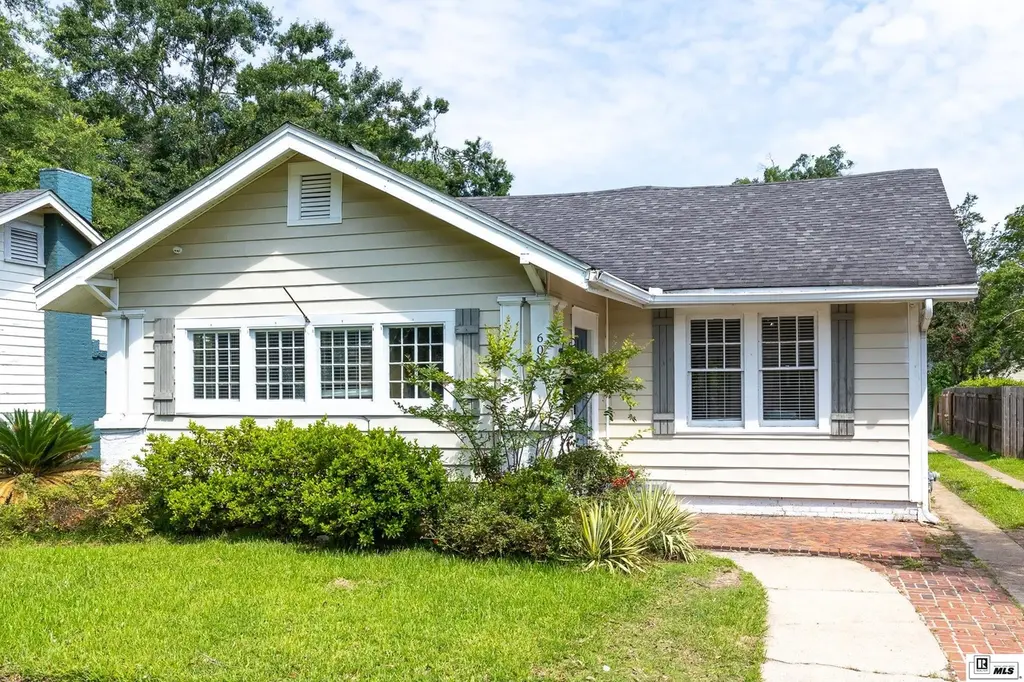
607 Roselawn Ave · Monroe, LA
Flood risk 4/10 · Minor
- FEMA flood zone
- X (shaded)
- Chance of flooding over 30 yrs
- 0.21%
- Est. flood insurance / yr
- $507 – $1,088
Fire risk 1/10 · Minimal
- Est. fire insurance / yr
- $1,269 – $2,357
Heat risk 8/10 · Major
- Hot days now (above 112°F)
- 7 days/yr
- Hot days in 30 yrs
- 20 days/yr
Wind risk 7/10 · Major
- Chance of severe wind over 30 yrs
- 76.0%
Air-quality risk 1/10 · Minimal
- Unhealthy air days now
- 0 days/yr
- Unhealthy air days in 30 yrs
- 0 days/yr
Risk factors via First Street. Map © Google.
Why this score? — see what drove the D grade
The composite is a weighted blend of 9 inputs, each scored 0–100. Each bar is that input's sub-score; the figure is the points it added to the 100-point composite (weight × sub-score).
- Cash flow +15.0/30.0
- ARV discount +7.5/15.0
- 1% rule +5.0/10.0
- DSCR +5.0/10.0
- Livability +3.3/5.0
- Rent growth +2.5/5.0
- Condition / age +2.5/5.0
- Schools +2.1/10.0
- Appreciation +0.0/10.0
$2,200
🖨 Deal sheet (PDF) 📄 Offer letter ✓ Due diligence
Listing remarks MLS
Cottage charm blooms in this 2 bedroom/ 2 bath home located in Monroe's Garden District! The home features a great floor plan, hardwood & ceramic tile flooring, custom kitchen w/ granite counter tops & stainless appliances, and an extra room that could be used for an office/sunroom. The primary suite features an additional room that could be used for a nursery or a LARGE walk-in closet. Close to shopping and restaurants. Call your real estate professional today for your showing!
Key facts
- Oversized kitchen
- Move-in ready rental
- Built-in desk
Tags
Property features AI
Finance
- Other: Subdivision: D A BREARD JR A
- HOA & community: No association amenities
Exterior
- Parking: One garage space; Carport; Open parking
- Security: Smoke detectors
- Utilities: Public water; Public sewer; Natural gas available and connected
- Home design: Single-family residence; One story; Entry level: 1; Site-built construction
- Construction: Vinyl siding; Brick veneer; Pillar/post/pier foundation
- Exterior features: Rain gutters; Wood fencing; Cleared lot; Paved road access
Interior
- Kitchen: Dishwasher; Microwave; Double oven; Electric range
- Bedrooms: Two bedrooms on the main level
- Bathrooms: Two full bathrooms (both on the main level)
- Heating & cooling: Central heating (natural gas); Central air conditioning; Ceiling fans; Electric cooling components
- Interior features: Ceiling fans; Walk-in closets; Double-pane windows; Fireplace (1)
- Laundry & utility: Gas water heater
Neighborhood map
What this means for you Summary
Snapshot
- This is a 3-bed/2.0-bath single-family listed at $2k.
Deal economics
- At list price, monthly cash flow is $2k ($19k/yr) — positive.
- The deal already cash-flows at list — no discount required.
- Meets the 1% rule at list price ($2k rent vs $2k).
- Cap rate 858.9% vs local median 5.7% in Monroe — top-decile yield for the area; either an underpriced asset or a hidden risk that comps aren't pricing in. Stress-test before assuming the spread holds.
Location & tenants
- Location reads 66/100 on livability (#128 in LA) — a middle-class / working-renter tenant base. Strengths: cost of living A+, health & safety A+; Watch: crime F, amenities F, commute F.
- City Of Monroe School District (urban): math 21% / reading 31% proficiency, ranked #60 of 98 in LA (top 61%) — low school quality limits family demand, transient renter base, plan for 1-2y turnover; 82% free/reduced lunch — lower-income household profile, screen leases tightly.
- Zoned schools: Lexington Elementary School (604 students, 48% FRL); Neville Junior High School (math 29% / reading 53%, grade F, #61 of 218 statewide, top 28%, 480 students, 58% FRL); Neville High School (math 35% / reading 52%, grade F, #64 of 265 statewide, top 24%, 1,121 students, 49% FRL) — zoned schools average 52% FRL vs 82% district-wide (30 pts lower); this property's tenant base skews higher-income than the district average.
- Zoned-school proficiency averages 42% at this address vs 26% district-wide (+16 pts) — the actual schools serving this property are materially stronger than the City Of Monroe School District average implies; a family-tenant draw the district grade alone would hide.
- Market conditions: 142 active listings in the ZIP; 2 comparable units currently listed for rent nearby; 345 units permitted in Ouachita Parish in 2024 (0 in 5+ unit buildings).
- This rent runs 37% of the median local income ($65k/yr) — at the standard rent-burdened threshold; future hikes will face affordability resistance.
Forward outlook
- Local home prices are declining (-3.0%/yr); year-one equity from $15 of loan paydown is wiped out by about $66 of value loss. Plan a longer hold.
- At projected returns (-3.0% appreciation + 3.0% rent growth), your $616 cash investment doubles in ~1 year — after that, you're playing with house money.
Negotiation context
- Only 6 days on market — expect competitive offers; lowballing is unlikely to land.
- 3 sale attempts since 14y ago with the ask held roughly flat each time — persistent listings suggest the price (not the market) is what's stuck; bring a comps-based counter.
Risks & watch-outs
- Watch-outs: built in 1937 — expect roof / HVAC / electrical / plumbing capex.
- Climate carrying-cost: major wind risk, 76% chance of damaging wind over 30y; extreme-heat days projected 7→20/yr by 2055 (HVAC capex compounding) — expect insurance premiums to compound above CPI over the hold.
Questions for the listing agent
- Built in 1937 — when were the roof, HVAC, electrical panel, plumbing, and water heater last replaced?
- Is there a deadline driving the sale (1031 exchange, divorce, estate, relocation)? That informs how much negotiation room exists.
- Crime grade is F in this area — have there been break-ins, vandalism, or insurance claims at this property in the last 3 years? What carrier currently insures it and at what premium?
- The area grade is low — what's the realistic commute time and amenity access for the typical tenant pool here? Any planned neighborhood developments (good or bad) we should know about?
- What's the average days-on-market for RENTAL listings here right now (not sales)? A rising rental-DOM trend means longer vacancies and softer asking-rent achievability than the comps imply.
- What's the recent tenant-quality profile in this submarket — average credit score on applications, eviction rate, late-payment / NSF rate, and stable-employment percentage? A property-management company in the area should have these aggregated.
- How much new for-sale + rental construction is in the pipeline within 1–3 miles? Heavy new supply typically softens prices + rents 12–24 months out; constrained supply supports both.
Investment metrics
- 1% rule
- 90.81% ✓
- Cap rate
- 858.89%
- Cash-on-cash
- 3045.00%
- DSCR
- 136.49
- GRM
- 0.1
CMA / ARV
- ARV (on-the-fly)
- $206,040
- Comps found
- 12
Show comp detail 12 sales within ~0.75 mi
| Address | Dist | Beds/Ba | Sqft | Sold | Price | $/sf | Match |
|---|---|---|---|---|---|---|---|
| 309 Erin Ave | 0.29mi | 3/2.0 | 1,713 (-0%) | 7mo | $230,000 | $134 | 80 |
| 700 K St | 0.42mi | 3/2.0 | 1,644 (-4%) | 2mo | $207,000 | $126 | 72 |
| 1704 N 2nd St | 0.49mi | 3/1.0 | 1,710 (-0%) | 2mo | $206,000 | $120 | 70 |
| 1304 Glenmar Ave | 0.46mi | 3/2.0 | 1,762 (+3%) | 7mo | $150,000 | $85 | 69 |
| 506 Rochelle Ave | 0.26mi | 2/1.0 (-1) | 1,622 (-6%) | 5mo | $87,000 | $54 | 65 |
| 500 Rochelle Ave | 0.27mi | 3/2.0 | 1,501 (-13%) | 2mo | $245,000 | $163 | 65 |
| 1004 Auburn Ave | 0.23mi | 3/2.0 | 1,550 (-10%) | 10mo | $175,000 | $113 | 65 |
| 710 Hilton St | 0.50mi | 3/2.0 | 1,656 (-4%) | 8mo | $171,000 | $103 | 64 |
| 1302 N 2nd St | 0.32mi | 3/2.0 | 1,869 (+9%) | 8mo | $149,000 | $80 | 64 |
| 1000 N 7th St | 0.23mi | 3/2.0 | 1,966 (+14%) | 6mo | $125,000 | $64 | 60 |
| 1701 N 5th St | 0.39mi | 3/2.0 | 1,924 (+12%) | 2mo | $247,000 | $128 | 60 |
| 1110 Hilton St | 0.67mi | 3/2.0 | 1,856 (+8%) | 4mo | $230,000 | $124 | 52 |
Match score weights: distance 35% · size 25% · config 20% · recency 20%. Top-matched comps best support the ARV.
Projected returns pro-forma
-3.0% appreciation · 3.0% rent growth · sell at horizon
- IRR
- —
- Equity multiple
- 162.08×
- Total profit
- $99,228
- Equity at exit
- $328
- IRR
- —
- Equity multiple
- 349.57×
- Total profit
- $214,721
- Equity at exit
- $190
Cash invested: $616 (down + closing). Projections, not guarantees.
Landlord ↔ Tenant lean methodology
- Overall (STATE)
- 90 Strongly Landlord-Friendly
- State Louisiana
- 90 Strongly Landlord-Friendly · R+12
- County
- — inherits STATE
- City
- — inherits STATE
ZIP-level market 71201
- Home prices YoY
- -31.9%
- Active inventory
- 142
- Price-to-rent
- 0.1×
Monthly cashflow live
- Estimated rent
- $1,998 medium interval (Pro) →
- Mortgage (P&I)
- −$12
- Tax est. 1.5%
- −$3 /mo · $33/yr
- Insurance
- −$1
- HOA
- −$0
- Vacancy / Maint / Mgmt
- −$420
- Net cashflow
- $1,563
Break-even live
Sensitivity live
| Price | -10% $1,565 | -5% $1,564 | +0% $1,563 | +5% $1,562 | +10% $1,562 |
|---|---|---|---|---|---|
| Rent | -10% $1,405 | -5% $1,484 | +0% $1,563 | +5% $1,642 | +10% $1,721 |
| Rate | -1.0pp $1,564 | -0.5pp $1,564 | base $1,563 | +0.5pp $1,563 | +1.0pp $1,562 |
UW: 25.0% down · 7.5% · 30yr · 1.5% tax · 5.0% vac · 8.0% maint · 8.0% mgmt
Financing live
Cash to close
- Down payment
- $550
- Closing costs
- $66
- Reserves months
- —
- Total cash needed
- —
Loan-product check · same deal, 3 products live
Conventional
25% down · 7.5% · 30yr
- Down + closing
- —
- Monthly P&I
- —
- Monthly cashflow
- —
- DSCR
- —
- Eligible?
- —
Personal DTI + credit; lowest rate.
DSCR
20% down · 8.5% · 30yr
- Down + closing
- —
- Monthly P&I
- —
- Monthly cashflow
- —
- DSCR
- —
- Eligible?
- —
No personal income docs; deal must DSCR.
Hard money
10% down · 12.0% · 12mo
- Down + closing
- —
- Monthly P&I
- —
- Monthly cashflow
- —
- DSCR
- —
- Eligible?
- —
Short-term bridge; refi at stabilization.
Rent comps 2 comps
| Address | Beds | Baths | Sqft | Rent | $/sqft | DOM | Units | Dist |
|---|---|---|---|---|---|---|---|---|
| 1707 N 5th St Monroe, LA | 3.0 | 2.0 | 1694 | $3,500 | $2.07 | 23d | 1 | 0.41mi |
| 403 K St Monroe, LA | 3.0 | 2.0 | 1561 | $1,100 | $0.70 | 23d | 1 | 0.46mi |
Listing history 6 events
-
2026-06-10days on market $2,200 Active 6 DOM
-
2026-06-09days on market $2,200 Active 5 DOM
-
2026-06-08days on market $2,200 Active 4 DOM
-
2026-06-07days on market $2,200 Active 3 DOM
-
2026-06-05remarks 699-char remark
-
2026-06-05$2,200 Active 1 DOM
ⓘ Source: listings_history table (triggers on properties + properties_extension) + one-shot
backfill from property_details.listing_events for pre-trigger history.
Climate risk First Street
- Flood 4/10 Moderate FEMA zone X (shaded) · 21% chance over 30 yrs
- Wildfire 1/10 Low
- Heat 8/10 Severe 7 d/yr ≥112°F today · 20 d/yr by 30 yrs out
- Wind 7/10 Severe 76% chance of damaging wind over 30 yrs
- Air quality 1/10 Low 0 unhealthy d/yr today · 0 by 30 yrs out
Nearby sold comps map
Loading sold comps map…
Walkable amenities ~0.75 mi
Loading nearby amenities…
Taxation est. · year 1
- Rental income
- $23,974
- − Mortgage interest
- −$123
- − Property taxes
- −$33
- − Insurance
- −$11
- − Repairs & maintenance
- −$1,918
- − Management
- −$1,918
- − Depreciation
- −$64
- Taxable income
- $19,907
- Est. tax owed @ 24.0%
- −$4,778
- After-tax cash flow
- $13,979/yr
For passive investors: Depreciation is non-cash, so a rental often shows a tax loss while cash-flowing — sheltering income. Rental losses are passive: they offset passive income freely, and up to $25,000/yr can offset ordinary (W-2) income if you actively participate and your MAGI is under $100k (phasing out to $0 by $150k); unused losses carry forward. On sale, claimed depreciation is recaptured at up to 25%, and gains may owe capital-gains tax (a 1031 exchange can defer both). Figures are a year-1 estimate at your 24.0% rate — not tax advice; consult a CPA.
Schools (NCES district)
- District
- City Of Monroe School District
- NCES district ID
- 2201080
- Math proficiency
- 21% ▼ -36.00%
- Reading proficiency
- 31% ▼ -34.00%
- Median HH income
- $28,751
- Composite
- 20.82/100
- National rank
- #8505
- State rank
- #60 of 98 in LA
Livability — Monroe
- Score
- 66/100
- State rank
- #128
- US rank
- #11948
Category grades
Schools grade is shown separately in the Schools card above.
Census & demographics
- Census place
- Monroe, LA
- County
- Ouachita Parish · 118,340 people
- City population
- 60,136
- Metro
- Monroe, LA
- Population (ZIP)
- 21,782
- Household income
- $65,446
- Rent vs Own
- Severe rent burden
- 1466.0
Population outlook (Ouachita County) Hauer SSP2
- Today (2025)
- 163,370 people
- By 2030
- 165,520 · +1.3%
- By 2040
- 167,652 · +2.6%
- By 2050
- 166,699 · +2.0%
- By 2075
- 156,348 · -4.3%
- By 2100
- 134,102 · -17.9%
Race, ethnicity, and origin ACS 2023
- Neighborhood character
- Diverse neighborhood (Simpson 0.55)
- Race & ethnicity
- White 57% Black 35% Two or more races 3% Hispanic / Latino 3% Asian 2%
- Common ancestry
- Lithuanian 3% Slovak 2% Italian 1%
- Foreign-born
- 3% · Vietnam
- Languages at home
- 95% English-only · Spanish 3% Other Indo-European 1% Arabic 1%
Political lean MEDSL · Ouachita
- 2024 margin
- Strong R (+27.9) · D 35.5% · R 63.3% · Other 1.2%
- 2008→2024 swing
- -2.7pp toward R · 2008: -25.2pp · 2024: -27.9pp
- All cycles
- 2024: R+27.9 2020: R+23.6 2016: R+25.4 2012: R+20.9 2008: R+25.2
Not yet ingested
- Civics
- —
Market trends
- HPI YoY
- ▼ -92.35%
- Current HPI
- 196.7468
- Rent YoY
- —
- Metro
- Monroe, LA
- State GDP YoY
- ▲ 3.29%
- F500 in state
- 10
Industry mix (Fortune 500 HQ in LA)
| Industry | F500 HQs | Revenue |
|---|---|---|
| Telecommunications | 2 | $23B |
|
||
| Utilities | 1 | $12B |
|
||
| Wholesale / Distribution | 1 | $5B |
|
||
| Advertising | 1 | $2B |
|
||
Price history
-98.6% since first listed10 events — show timeline
- 2026-06-04 Listed $2,200 NELABOR
- 2024-12-30 Sold (Public Records) $390,000 Public Records
- 2024-12-27 Sold (MLS) — NELABOR
- 2024-12-02 Pending — NELABOR
- 2024-11-22 Listed $199,500 NELABOR
- 2014-12-15 Sold (Public Records) $164,000 Public Records
- 2012-03-16 Listed $153,900 NELABOR
- 2009-06-02 Sold (Public Records) — Public Records
- 2008-12-16 Sold (Public Records) — Public Records
- 1985-02-01 Sold (Public Records) — Public Records
Property tax history
+0.1%/yrLatest (2025): $1,513 · -0.1% YoY. Source: county tax records.
Cash-flow waterfall
monthlySold comps — $/sqft
last 12 mo · ≤1 miLoading sold comps…