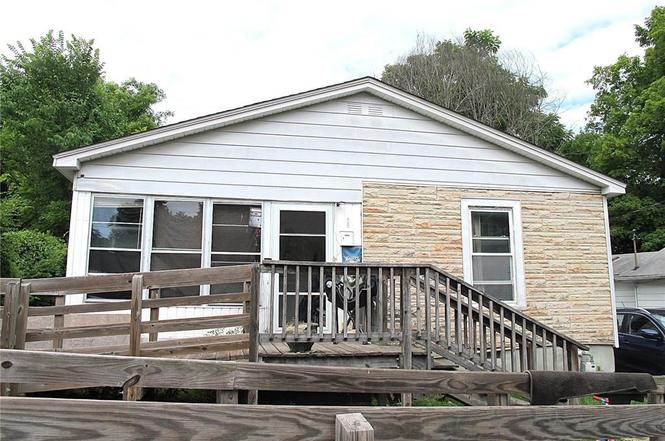
300 Winston St · Thomasville, NC
Flood risk 1/10 · Minimal
- FEMA flood zone
- X (unshaded)
- Chance of flooding over 30 yrs
- 0.0%
- Est. flood insurance / yr
- $507 – $1,088
Fire risk 1/10 · Minimal
- Est. fire insurance / yr
- $906 – $1,684
Heat risk 5/10 · Moderate
- Hot days now (above 103°F)
- 7 days/yr
- Hot days in 30 yrs
- 17 days/yr
Wind risk 4/10 · Minor
- Chance of severe wind over 30 yrs
- 14.0%
Air-quality risk 2/10 · Minimal
- Unhealthy air days now
- 1 days/yr
- Unhealthy air days in 30 yrs
- 1 days/yr
Risk factors via First Street. Map © Google.
Why this score? — see what drove the B- grade
The composite is a weighted blend of 9 inputs, each scored 0–100. Each bar is that input's sub-score; the figure is the points it added to the 100-point composite (weight × sub-score).
- Cash flow +30.0/30.0
- 1% rule +10.0/10.0
- DSCR +10.0/10.0
- ARV discount +7.5/15.0
- Livability +4.0/5.0
- Rent growth +3.6/5.0
- Condition / age +2.5/5.0
- Schools +2.0/10.0
- Appreciation +0.0/10.0
$72,000
🖨 Deal sheet (PDF) 📄 Offer letter ✓ Due diligence
Listing remarks
We have an Opportunity property that awaits you at 300 Winston. With a new roof and HVAC system installed in November 2024, some major improvements are already complete. This property is ready for an investor, flipper, or buyer with vision to bring it back to life and make it something truly special. Priced to reflect the home's current condition. Whether you're looking for your next renovation project, investment opportunity, or ideal property for a buyer to add value, don't miss your chance to unlock this property's potential. Buyer to verify sq ft.
Key facts
- 7,405 sq ft lot
- Built 1922
Property features AI
Finance
- HOA & community: No homeowners association
Exterior
- Parking: Driveway
- Utilities: Public sewer; Electric water heater
- Home design: Residential stick/site-built house; One story; Built in 1922
- Construction: Aluminum siding, stone, and vinyl siding exterior materials
- Exterior features: Public water service; Publicly maintained road access; Lot roughly 0.17 acre with approximate dimensions 50 x 148 x 50 x 148; No pool
Interior
- Kitchen: Electric water heater (kitchen/home appliance listed)
- Bedrooms: Primary bedroom on the main level
- Bathrooms: One full bathroom
- Heating & cooling: Heat pump; Natural gas heating; Central air conditioning
- Interior features: Primary bedroom on the main level; Six total rooms
Neighborhood map
What this means for you Summary
Snapshot
- This is a 2-bed/1.0-bath single-family listed at $72k.
Deal economics
- At list price, monthly cash flow is $543 ($7k/yr) — positive.
- The deal already cash-flows at list — no discount required.
- Meets the 1% rule at list price ($1k rent vs $72k).
- Cap rate 15.3% vs local median 3.1% in Thomasville — top-decile yield for the area; either an underpriced asset or a hidden risk that comps aren't pricing in. Stress-test before assuming the spread holds.
Location & tenants
- Location reads 81/100 on livability (#16 in NC, #1,454 nationally) — a professional / high-income tenant draw. Strengths: commute A+, cost of living A+, housing A+; Watch: crime D+, schools F, employment F.
- Thomasville City Schools (suburban): math 24% / reading 25% proficiency, ranked #164 of 178 in NC (top 92%) — low school quality limits family demand, transient renter base, plan for 1-2y turnover; 82% free/reduced lunch — lower-income household profile, screen leases tightly.
- Market conditions: Rents rising fast (+4.3%/yr); 307 active listings in the ZIP; 7 comparable units currently listed for rent nearby; rentals at typical pace (median 15d on market — plan ~3-4 weeks tenant-placement turnaround); 990 units permitted in Davidson County in 2024 (54 in 5+ unit buildings).
Forward outlook
- Local home prices are declining (-3.0%/yr); year-one equity from $498 of loan paydown is wiped out by about $2k of value loss. Plan a longer hold.
- Davidson County population projected to shrink 6% by 2050 — rents likely to lag national; underwrite the cash flow, not the appreciation.
- At projected returns (-3.0% appreciation + 4.3% rent growth), your $20k cash investment doubles in ~4 years — after that, you're playing with house money.
Negotiation context
- Only 1 days on market — expect competitive offers; lowballing is unlikely to land.
- 2 sale attempts with the ask held roughly flat each time — persistent listings suggest the price (not the market) is what's stuck; bring a comps-based counter.
Risks & watch-outs
- Watch-outs: built in 1922 — expect roof / HVAC / electrical / plumbing capex.
- Climate carrying-cost: extreme-heat days projected 7→17/yr by 2055 (HVAC capex compounding) — expect insurance premiums to compound above CPI over the hold.
Questions for the listing agent
- Built in 1922 — when were the roof, HVAC, electrical panel, plumbing, and water heater last replaced?
- Is there a deadline driving the sale (1031 exchange, divorce, estate, relocation)? That informs how much negotiation room exists.
- Schools are F-rated, which usually means shorter tenancies and higher turnover. Who's the typical renter profile here, and what's been the actual vacancy rate?
- Crime grade is D in this area — have there been break-ins, vandalism, or insurance claims at this property in the last 3 years? What carrier currently insures it and at what premium?
- What's the average days-on-market for RENTAL listings here right now (not sales)? A rising rental-DOM trend means longer vacancies and softer asking-rent achievability than the comps imply.
- What's the recent tenant-quality profile in this submarket — average credit score on applications, eviction rate, late-payment / NSF rate, and stable-employment percentage? A property-management company in the area should have these aggregated.
- How much new for-sale + rental construction is in the pipeline within 1–3 miles? Heavy new supply typically softens prices + rents 12–24 months out; constrained supply supports both.
Investment metrics
- 1% rule
- 1.76% ✓
- Cap rate
- 15.35%
- Cash-on-cash
- 32.34%
- DSCR
- 2.44
- GRM
- 4.7
CMA / ARV
- ARV (on-the-fly)
- $252,056
- Comps found
- 12
Show comp detail 12 sales within ~0.75 mi
| Address | Dist | Beds/Ba | Sqft | Sold | Price | $/sf | Match |
|---|---|---|---|---|---|---|---|
| 17 Fisher Ferry St | 0.47mi | 3/2.0 (+1) | 1,316 (+2%) | 7mo | $102,500 | $78 | 59 |
| 16 W Colonial Dr | 0.53mi | 3/2.0 (+1) | 1,220 (-5%) | 2mo | $250,000 | $205 | 56 |
| 30 Culbreth Ave | 0.56mi | 3/2.5 (+1) | 1,336 (+4%) | 4mo | $300,000 | $225 | 53 |
| 413 W Main St | 0.63mi | 2/2.0 | 1,330 (+3%) | 10mo | $227,500 | $171 | 52 |
| 18 W Colonial Dr | 0.53mi | 3/2.0 (+1) | 1,214 (-6%) | 10mo | $259,900 | $214 | 49 |
| 513 Memorial Park Dr | 0.51mi | 3/1.0 (+1) | 1,126 (-12%) | 6mo | $100,000 | $89 | 46 |
| 111 Miller St | 0.59mi | 2/1.5 | 1,097 (-15%) | 1mo | $150,000 | $137 | 45 |
| 622 Cable St | 0.70mi | 3/2.0 (+1) | 1,331 (+4%) | 9mo | $252,000 | $189 | 45 |
| 614 Huger St | 0.74mi | 3/2.0 (+1) | 1,251 (-3%) | 10mo | $230,000 | $184 | 44 |
| 107 College St | 0.54mi | 3/2.0 (+1) | 1,120 (-13%) | 2mo | $220,000 | $196 | 43 |
| 109 College St | 0.53mi | 3/2.0 (+1) | 1,120 (-13%) | 10mo | $226,000 | $202 | 37 |
| 307 Fisher Ferry St | 0.74mi | 3/2.0 (+1) | 1,118 (-13%) | 6mo | $224,900 | $201 | 29 |
Match score weights: distance 35% · size 25% · config 20% · recency 20%. Top-matched comps best support the ARV.
Projected returns pro-forma
-3.0% appreciation · 4.34% rent growth · sell at horizon
- IRR
- 28.8%
- Equity multiple
- 2.22×
- Total profit
- $24,673
- Equity at exit
- $10,735
- IRR
- 37.0%
- Equity multiple
- 4.64×
- Total profit
- $73,351
- Equity at exit
- $6,225
Cash invested: $20,160 (down + closing). Projections, not guarantees.
Landlord ↔ Tenant lean methodology
- Overall (STATE)
- 85 Strongly Landlord-Friendly
- State North Carolina
- 85 Strongly Landlord-Friendly · R+3
- County
- — inherits STATE
- City
- — inherits STATE
ZIP-level market 27360
- Rents YoY
- 4.3%
- Active inventory
- 307
- Price-to-rent
- 4.7×
Monthly cashflow live
- Estimated rent
- $1,270 high interval (Pro) →
- Mortgage (P&I)
- −$378
- Tax from tax record
- −$52 /mo · $630/yr
- Insurance
- −$30
- HOA
- −$0
- Vacancy / Maint / Mgmt
- −$267
- Net cashflow
- $543
Break-even live
Sensitivity live
| Price | -10% $584 | -5% $564 | +0% $543 | +5% $523 | +10% $503 |
|---|---|---|---|---|---|
| Rent | -10% $443 | -5% $493 | +0% $543 | +5% $594 | +10% $644 |
| Rate | -1.0pp $580 | -0.5pp $562 | base $543 | +0.5pp $525 | +1.0pp $506 |
UW: 25.0% down · 7.5% · 30yr · 1.5% tax · 5.0% vac · 8.0% maint · 8.0% mgmt
Financing live
Cash to close
- Down payment
- $18,000
- Closing costs
- $2,160
- Reserves months
- —
- Total cash needed
- —
Loan-product check · same deal, 3 products live
Conventional
25% down · 7.5% · 30yr
- Down + closing
- —
- Monthly P&I
- —
- Monthly cashflow
- —
- DSCR
- —
- Eligible?
- —
Personal DTI + credit; lowest rate.
DSCR
20% down · 8.5% · 30yr
- Down + closing
- —
- Monthly P&I
- —
- Monthly cashflow
- —
- DSCR
- —
- Eligible?
- —
No personal income docs; deal must DSCR.
Hard money
10% down · 12.0% · 12mo
- Down + closing
- —
- Monthly P&I
- —
- Monthly cashflow
- —
- DSCR
- —
- Eligible?
- —
Short-term bridge; refi at stabilization.
Rent comps 7 comps
| Address | Beds | Baths | Sqft | Rent | $/sqft | DOM | Units | Dist |
|---|---|---|---|---|---|---|---|---|
| 722 Salem St Thomasville, NC | 2.0–3.0 | 2.0 | 1037 | $900 | $0.87 | 15d | 1 | 0.58mi |
| 106 Spruce St Thomasville, NC | 3.0 | 2.0 | 1131 | $1,450 | $1.28 | 24d | 1 | 0.79mi |
| 14 W Sunrise Ave Apt 14 Thomasville, NC | 2.0 | 1.5 | 915 | $925 | $1.01 | 24d | 1 | 0.83mi |
| 406 Fisher Ferry St Thomasville, NC | 2.0 | 2.0 | 1144 | $1,450 | $1.27 | 24d | 1 | 0.87mi |
| 309 Woodlawn St Thomasville, NC | 3.0 | 2.0 | 1340 | $1,650 | $1.23 | 15d | 1 | 0.92mi |
| 200 Charles St Thomasville, NC | 3.0 | 2.0 | 1040 | $1,600 | $1.54 | 15d | 1 | 1.02mi |
| 202 Charles St Thomasville, NC | 3.0 | 2.0 | 990 | $1,500 | $1.52 | 15d | 1 | 1.02mi |
Listing history 3 events
-
2026-06-18status $72,000 Pending 1 DOM
-
2026-06-17remarks 557-char remark
-
2026-06-17$72,000 Due Diligence Period 1 DOM
ⓘ Source: listings_history table (triggers on properties + properties_extension) + one-shot
backfill from property_details.listing_events for pre-trigger history.
Tax reassessment forecast NC · Resets to sale price
- Current annual tax
- $630 · $52/mo
- Projected year-2 tax
- $630 · $52/mo
- Expected delta
- $0/yr ($0/mo · 0.0%)
ⓘ Screening estimate from a state-policy table — verify with the county assessor before closing.
Climate risk First Street
- Flood 1/10 Low FEMA zone X (unshaded) · 0% chance over 30 yrs
- Wildfire 1/10 Low
- Heat 5/10 Major 7 d/yr ≥103°F today · 17 d/yr by 30 yrs out
- Wind 4/10 Moderate 14% chance of damaging wind over 30 yrs
- Air quality 2/10 Low 1 unhealthy d/yr today · 1 by 30 yrs out
Nearby sold comps map
Loading sold comps map…
Walkable amenities ~0.75 mi
Loading nearby amenities…
Taxation est. · year 1
- Rental income
- $15,242
- − Mortgage interest
- −$4,033
- − Property taxes
- −$630
- − Insurance
- −$360
- − Repairs & maintenance
- −$1,219
- − Management
- −$1,219
- − Depreciation
- −$2,095
- Taxable income
- $5,686
- Est. tax owed @ 24.0%
- −$1,365
- After-tax cash flow
- $5,156/yr
For passive investors: Depreciation is non-cash, so a rental often shows a tax loss while cash-flowing — sheltering income. Rental losses are passive: they offset passive income freely, and up to $25,000/yr can offset ordinary (W-2) income if you actively participate and your MAGI is under $100k (phasing out to $0 by $150k); unused losses carry forward. On sale, claimed depreciation is recaptured at up to 25%, and gains may owe capital-gains tax (a 1031 exchange can defer both). Figures are a year-1 estimate at your 24.0% rate — not tax advice; consult a CPA.
Schools (NCES district)
- District
- Thomasville City Schools
- NCES district ID
- 3704500
- Math proficiency
- 24% ▲ 1.00%
- Reading proficiency
- 25% ▲ 2.00%
- Median HH income
- $29,831
- Composite
- 19.72/100
- National rank
- #8717
- State rank
- #164 of 178 in NC
Livability — Thomasville
- Score
- 81/100
- State rank
- #16
- US rank
- #1454
Category grades
Schools grade is shown separately in the Schools card above.
Census & demographics
- Census place
- Thomasville, NC
- County
- Davidson County · 129,088 people
- City population
- 49,510
- Metro
- Winston-Salem, NC
- Population (ZIP)
- 49,510
- Household income
- $61,983
- Rent vs Own
- Severe rent burden
- 1052.0
Population outlook (Davidson County) Hauer SSP2
- Today (2025)
- 167,156 people
- By 2030
- 167,216 · +0.0%
- By 2040
- 164,524 · -1.6%
- By 2050
- 157,229 · -5.9%
- By 2075
- 138,084 · -17.4%
- By 2100
- 112,729 · -32.6%
Race, ethnicity, and origin ACS 2023
- Neighborhood character
- Predominantly White (71%)
- Race & ethnicity
- White 71% Hispanic / Latino 11% Black 11% Two or more races 11%
- Hispanic origin (detail)
- Mexican 7%
- Common ancestry
- Slovak 2% Serbian 1% Italian 1%
- Foreign-born
- 7% · Canada
- Languages at home
- 88% English-only · Spanish 10% Other Indo-European 1%
Political lean MEDSL · Davidson
- 2024 margin
- Solid R (+47.1) · D 25.9% · R 73.0% · Other 1.1%
- 2008→2024 swing
- -13.5pp toward R · 2008: -33.5pp · 2024: -47.1pp
- All cycles
- 2024: R+47.1 2020: R+47.5 2016: R+49.4 2012: R+40.9 2008: R+33.5
Not yet ingested
- Civics
- —
Market trends
- HPI YoY
- ▼ -146.33%
- Current HPI
- 243.0953
- Rent YoY
- ▲ 4.34%
- Metro
- Winston-Salem, NC
- State GDP YoY
- ▲ 3.28%
- F500 in state
- 26
Industry mix (Fortune 500 HQ in NC)
| Industry | F500 HQs | Revenue |
|---|---|---|
| Financial Services | 2 | $213B |
|
||
| Retail | 2 | $95B |
|
||
| Industrial Conglomerate | 1 | $38B |
|
||
| Metals / Steel | 1 | $35B |
|
||
| Utilities | 1 | $30B |
|
||
| Industrial Machinery | 1 | $19B |
|
||
Price history
2 events — show timeline
- 2026-06-17 Listed — Triad MLS
- 2026-06-17 Listed $72,000 Triad MLS
Property tax history
+17.4%/yrLatest (2025): $630 · +0.0% YoY. Source: county tax records.
Cash-flow waterfall
monthlySold comps — $/sqft
last 12 mo · ≤1 miLoading sold comps…