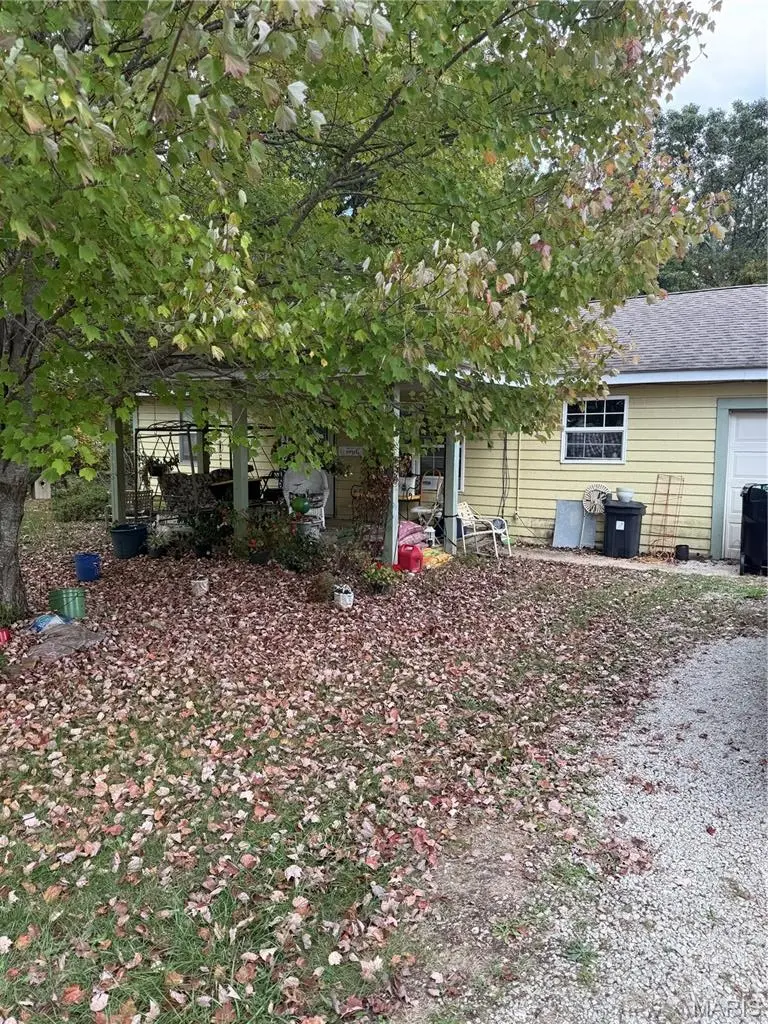
34 Jana Ln · St. James, MO
Flood risk 1/10 · Minimal
- FEMA flood zone
- X (unshaded)
- Chance of flooding over 30 yrs
- 0.0%
- Est. flood insurance / yr
- $507 – $1,088
Fire risk 5/10 · Moderate
- Est. fire insurance / yr
- $1,054 – $1,958
Heat risk 4/10 · Minor
- Hot days now (above 105°F)
- 7 days/yr
- Hot days in 30 yrs
- 19 days/yr
Wind risk 2/10 · Minimal
- Chance of severe wind over 30 yrs
- —
Air-quality risk 2/10 · Minimal
- Unhealthy air days now
- 0 days/yr
- Unhealthy air days in 30 yrs
- 1 days/yr
Risk factors via First Street. Map © Google.
Why this score? — see what drove the B grade
The composite is a weighted blend of 9 inputs, each scored 0–100. Each bar is that input's sub-score; the figure is the points it added to the 100-point composite (weight × sub-score).
- Cash flow +28.1/30.0
- ARV discount +15.0/15.0
- DSCR +10.0/10.0
- 1% rule +7.0/10.0
- Schools +4.0/10.0
- Rent growth +2.5/5.0
- Livability +2.5/5.0
- Condition / age +2.5/5.0
- Appreciation +0.0/10.0
$109,900
🖨 Deal sheet 📄 Offer letter ✓ Due diligence
Listing remarks MLS
This 3 bedroom, 2 bath home sits on 1.5 acres offering the best of both worlds--a spacious, country setting right in town. This home needs significant updates and repairs, but with a little work, it could be a fantastic home or investment. If you're looking for a project with great bones and big potential, this one's for you.
Key facts
- 1.48 acre lot
- Garage
- Built 1985
Neighborhood map
What this means for you Summary
Snapshot
- This is a 3-bed/2.0-bath single-family listed at $110k.
Deal economics
- At list price, monthly cash flow is $344 ($4k/yr) — positive.
- The deal already cash-flows at list — no discount required.
- Meets the 1% rule at list price ($1k rent vs $110k).
- Recommended offer: $97k (12.0% below list) — sets the bar for market timing.
- Cap rate 10.1% vs local median 4.1% in St. James — top-decile yield for the area; either an underpriced asset or a hidden risk that comps aren't pricing in. Stress-test before assuming the spread holds.
Location & tenants
- Location reads: area grade B — affects rentability + tenant quality, not the cash-flow math above.
- St. James R-I (town): math 44% / reading 50% proficiency, ranked #72 of 324 in MO (top 22%) — families likely to look elsewhere, expect single-tenant / working-renter base with shorter leases.
- Market conditions: 54 active listings in the ZIP; 162 units permitted in Phelps County in 2024 (83 in 5+ unit buildings).
Forward outlook
- Local home prices are declining (-3.0%/yr); year-one equity from $760 of loan paydown is wiped out by about $3k of value loss. Plan a longer hold.
- Phelps County population projected at -12% by 2050 — secular population decline; favor cash flow + early exit over multi-decade hold.
- At projected returns (-3.0% appreciation + 3.0% rent growth), your $31k cash investment doubles in ~9 years — after that, you're playing with house money.
Negotiation context
- It's been on market 256 days — a 12% lower offer ($97k) is reasonable based on typical stale-listing flexibility.
Risks & watch-outs
- Climate carrying-cost: moderate wildfire risk — expect insurance premiums to compound above CPI over the hold.
Questions for the listing agent
- It's been on market 256 days. Have you received any prior offers? Is the seller open to a 12% concession, seller financing, or rate buy-down credit?
- Why hasn't it sold? Are there any deal-killer items the seller is aware of (foundation, flood, title, zoning, code violations)?
- Is there a deadline driving the sale (1031 exchange, divorce, estate, relocation)? That informs how much negotiation room exists.
- What's the average days-on-market for RENTAL listings here right now (not sales)? A rising rental-DOM trend means longer vacancies and softer asking-rent achievability than the comps imply.
- What's the recent tenant-quality profile in this submarket — average credit score on applications, eviction rate, late-payment / NSF rate, and stable-employment percentage? A property-management company in the area should have these aggregated.
- How much new for-sale + rental construction is in the pipeline within 1–3 miles? Heavy new supply typically softens prices + rents 12–24 months out; constrained supply supports both.
Investment metrics
- 1% rule
- 1.20% ✓
- Cap rate
- 10.05%
- Cash-on-cash
- 13.43%
- DSCR
- 1.60
- GRM
- 7.0
CMA / ARV
- ARV (median comp)
- $150,688
- List price
- $109,900
- Delta
- -27.07%
- Verdict
- UNDERPRICED
- Comps
- 20 within 1.0 mi
Show comp detail 4 sales within ~0.75 mi
| Address | Dist | Beds/Ba | Sqft | Sold | Price | $/sf | Match |
|---|---|---|---|---|---|---|---|
| 1509 W Springfield St | 0.14mi | 3/2.0 | 1,386 (-0%) | 20mo | $247,000 | $178 | 76 |
| 1 Marion Dr | 0.35mi | 3/2.0 | 1,328 (-5%) | 11mo | $155,000 | $117 | 66 |
| 106 Cornick Dr | 0.22mi | 3/2.0 | 1,512 (+9%) | 17mo | $124,900 | $83 | 61 |
| 802 W Washington St | 0.61mi | 3/2.0 | 1,400 (+1%) | 17mo | $199,900 | $143 | 57 |
Match score weights: distance 35% · size 25% · config 20% · recency 20%. Top-matched comps best support the ARV.
Projected returns pro-forma
-3.0% appreciation · 3.0% rent growth · sell at horizon
- IRR
- 3.5%
- Equity multiple
- 1.13×
- Total profit
- $4,106
- Equity at exit
- $16,386
- IRR
- 13.0%
- Equity multiple
- 2.03×
- Total profit
- $31,738
- Equity at exit
- $9,502
Cash invested: $30,772 (down + closing). Projections, not guarantees.
Landlord ↔ Tenant lean methodology
- Overall (STATE)
- 81 Strongly Landlord-Friendly
- State Missouri
- 81 Strongly Landlord-Friendly · R+10
- County
- — inherits STATE
- City
- — inherits STATE
ZIP-level market 65559
- Home prices YoY
- -20.7%
- Active inventory
- 54
- Price-to-rent
- 7.0×
Monthly cashflow live
- Estimated rent
- $1,315 medium interval (Pro) →
- Mortgage (P&I)
- −$576
- Tax from tax record
- −$72 /mo · $866/yr
- Insurance
- −$46
- HOA
- −$0
- Vacancy / Maint / Mgmt
- −$276
- Net cashflow
- $344
Break-even live
UW: 25.0% down · 7.5% · 30yr · 1.5% tax · 5.0% vac · 8.0% maint · 8.0% mgmt
Financing live
Cash to close
- Down payment
- $27,475
- Closing costs
- $3,297
- Reserves months
- —
- Total cash needed
- —
Loan-product check · same deal, 3 products live
Conventional
25% down · 7.5% · 30yr
- Down + closing
- —
- Monthly P&I
- —
- Monthly cashflow
- —
- DSCR
- —
- Eligible?
- —
Personal DTI + credit; lowest rate.
DSCR
20% down · 8.5% · 30yr
- Down + closing
- —
- Monthly P&I
- —
- Monthly cashflow
- —
- DSCR
- —
- Eligible?
- —
No personal income docs; deal must DSCR.
Hard money
10% down · 12.0% · 12mo
- Down + closing
- —
- Monthly P&I
- —
- Monthly cashflow
- —
- DSCR
- —
- Eligible?
- —
Short-term bridge; refi at stabilization.
Listing history 18 events
-
2026-06-19days on market $109,900 Active 256 DOM
-
2026-06-18days on market $109,900 Active 255 DOM
-
2026-06-17days on market $109,900 Active 254 DOM
-
2026-06-16days on market $109,900 Active 253 DOM
-
2026-06-15days on market $109,900 Active 252 DOM
-
2026-06-14days on market $109,900 Active 250 DOM
-
2026-06-12remarks 352-char remark
-
2026-06-12pricedays on market $109,900 Active 249 DOM
-
2026-06-09days on market $149,900 Active 246 DOM
-
2026-06-08days on market $149,900 Active 245 DOM
-
2026-06-07days on market $149,900 Active 244 DOM
-
2026-06-03days on market $149,900 Active 240 DOM
-
2026-06-02days on market $149,900 Active 239 DOM
-
2026-06-01days on market $149,900 Active 238 DOM
-
2026-05-31days on market $149,900 Active 237 DOM
-
2025-10-06$149,900 Active 327-char remark
Show marketing remark (327 chars)
This 3 bedroom, 2 bath home sits on 1.5 acres offering the best of both worlds--a spacious, country setting right in town. This home needs significant updates and repairs, but with a little work, it could be a fantastic home or investment. If you're looking for a project with great bones and big potential, this one's for you.
-
2025-10-06historical $149,900 327-char remark
Show marketing remark (327 chars)
This 3 bedroom, 2 bath home sits on 1.5 acres offering the best of both worlds--a spacious, country setting right in town. This home needs significant updates and repairs, but with a little work, it could be a fantastic home or investment. If you're looking for a project with great bones and big potential, this one's for you.
-
2002-12-18soldstatus
ⓘ Source: listings_history table (triggers on properties + properties_extension) + one-shot
backfill from property_details.listing_events for pre-trigger history.
Tax reassessment forecast MO · Resets to sale price
- Current annual tax
- $866 · $72/mo
- Projected year-2 tax
- $1,066 · $89/mo
- Expected delta
- +$200/yr (+$17/mo · 23.1%)
ⓘ Screening estimate from a state-policy table — verify with the county assessor before closing.
Climate risk First Street
- Flood 1/10 Low FEMA zone X (unshaded) · 0% chance over 30 yrs
- Wildfire 5/10 Major
- Heat 4/10 Moderate 7 d/yr ≥105°F today · 19 d/yr by 30 yrs out
- Wind 2/10 Low
- Air quality 2/10 Low 0 unhealthy d/yr today · 1 by 30 yrs out
Nearby sold comps map
Loading sold comps map…
Walkable amenities ~0.75 mi
Loading nearby amenities…
Taxation est. · year 1
- Rental income
- $15,777
- − Mortgage interest
- −$6,156
- − Property taxes
- −$866
- − Insurance
- −$550
- − Repairs & maintenance
- −$1,262
- − Management
- −$1,262
- − Depreciation
- −$3,197
- Taxable income
- $2,484
- Est. tax owed @ 24.0%
- −$596
- After-tax cash flow
- $3,537/yr
For passive investors: Depreciation is non-cash, so a rental often shows a tax loss while cash-flowing — sheltering income. Rental losses are passive: they offset passive income freely, and up to $25,000/yr can offset ordinary (W-2) income if you actively participate and your MAGI is under $100k (phasing out to $0 by $150k); unused losses carry forward. On sale, claimed depreciation is recaptured at up to 25%, and gains may owe capital-gains tax (a 1031 exchange can defer both). Figures are a year-1 estimate at your 24.0% rate — not tax advice; consult a CPA.
Schools (NCES district)
- District
- St. James R-I
- NCES district ID
- 2929250
- Math proficiency
- 44% ▲ 7.00%
- Reading proficiency
- 50% ▲ 3.00%
- Median HH income
- $44,308
- Composite
- 39.74/100
- National rank
- #3894
- State rank
- #72 of 324 in MO
Livability — St. James
No livability data for this city. (Only ~50 U.S. cities are tracked.)
Census & demographics
- County
- Phelps County · 42,017 people
- Metro
- Rolla, MO
- Population (ZIP)
- 9,303
- Household income
- $61,750
- Rent vs Own
- Severe rent burden
- 70.0
Population outlook (Phelps County) Hauer SSP2
- Today (2025)
- 44,188 people
- By 2030
- 43,524 · -1.5%
- By 2040
- 41,211 · -6.7%
- By 2050
- 38,977 · -11.8%
- By 2075
- 33,846 · -23.4%
- By 2100
- 27,828 · -37.0%
Race, ethnicity, and origin ACS 2023
- Neighborhood character
- Predominantly White (92%)
- Race & ethnicity
- White 92% Two or more races 5% Hispanic / Latino 3%
- Common ancestry
- Lithuanian 3% Italian 2% Iranian 1%
- Foreign-born
- 2% · Canada, China
- Languages at home
- 97% English-only · Spanish 1% Chinese 1%
Political lean MEDSL · Phelps
- 2024 margin
- Solid R (+42.9) · D 27.9% · R 70.8% · Other 1.3%
- 2008→2024 swing
- -20.7pp toward R · 2008: -22.2pp · 2024: -42.9pp
- All cycles
- 2024: R+42.9 2020: R+40.1 2016: R+42.9 2012: R+33.5 2008: R+22.2
Not yet ingested
- Civics
- —
Market trends
- HPI YoY
- ▼ -46.56%
- Current HPI
- 177.961
- Rent YoY
- —
- Metro
- Rolla, MO
- State GDP YoY
- ▲ 1.84%
- F500 in state
- 20
Industry mix (Fortune 500 HQ in MO)
| Industry | F500 HQs | Revenue |
|---|---|---|
| Healthcare | 1 | $163B |
|
||
| Insurance | 1 | $21B |
|
||
| Industrial Technology | 1 | $17B |
|
||
| Retail | 1 | $16B |
|
||
| Industrial Distribution | 1 | $10B |
|
||
| Utilities | 1 | $9B |
|
||
Price history
+0.0% since first listed3 events — show timeline
- 2025-10-06 Listed $149,900 MARIS as Distributed by MLS Grid
- 2025-10-06 Coming Soon $149,900 MARIS as Distributed by MLS Grid
- 2002-12-18 Sold (Public Records) — Public Records
Property tax history
+2.4%/yrLatest (2025): $866 · +14.3% YoY. Source: county tax records.
Cash-flow waterfall
monthlySold comps — $/sqft
last 12 mo · ≤1 miLoading sold comps…