 🏷️ Likely Rental
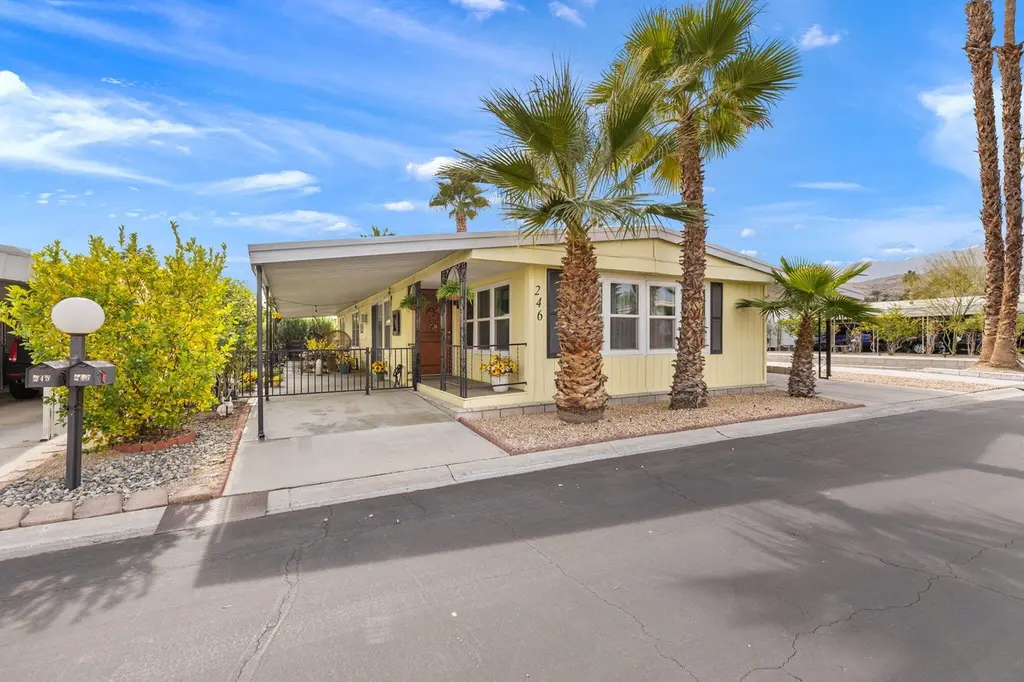
246 Laredo Dr · Palm Springs, CA
Flood risk 1/10 · Minimal
- FEMA flood zone
- X
- Chance of flooding over 30 yrs
- 0.0%
- Est. flood insurance / yr
- $507 – $1,088
Fire risk 4/10 · Minor
- Est. fire insurance / yr
- $659 – $1,223
Heat risk 9/10 · Severe
- Hot days now (above 112°F)
- 7 days/yr
- Hot days in 30 yrs
- 21 days/yr
Wind risk 1/10 · Minimal
- Chance of severe wind over 30 yrs
- —
Air-quality risk 5/10 · Moderate
- Unhealthy air days now
- 6 days/yr
- Unhealthy air days in 30 yrs
- 8 days/yr
Risk factors via First Street. Map © Google.
Why this score? — see what drove the C+ grade
The composite is a weighted blend of 9 inputs, each scored 0–100. Each bar is that input's sub-score; the figure is the points it added to the 100-point composite (weight × sub-score).
- Cash flow +24.0/30.0
- ARV discount +15.0/15.0
- DSCR +7.7/10.0
- 1% rule +6.0/10.0
- Livability +3.3/5.0
- Schools +2.7/10.0
- Condition / age +2.5/5.0
- Rent growth +2.4/5.0
- Appreciation +0.0/10.0
$239,000
🖨 Deal sheet 📄 Offer letter ✓ Due diligence
Listing remarks MLS
INVESTORS, you OWN THE LAND, LOCATION IS PALM SPRINGS CA. HEART OF CITY, NEAR AIRPORT, SHOPPING AND DINING, CASINOS. 55 + no age restriction to own as an investor, TENANT IN PLACE. HOA is affordable, $355. per month. Tenant pays utilities. CLUBHOUSE, 2 pools, spas and tennis courts, RV parking area separated from homes inside the community. Location near Trader Joes, is mere minutes from downtown, Not windy, highly desirable area. Home is owned by Realtor, and has 20K in updates since purchased for $250,000 in 2024. For details * see private remarks. or Call Listing agent. Home is clean and always maintained and easy to show. Photos are current.
Key facts
- 4,356 sq ft lot
- Garage
- Pool
Neighborhood map
What this means for you Summary
Snapshot
- This is a 2-bed/2.0-bath manufactured listed at $239k.
Deal economics
- At list price, monthly cash flow is $466 ($6k/yr) — positive.
- The deal already cash-flows at list — no discount required.
- Meets the 1% rule at list price ($3k rent vs $239k).
- Recommended offer: $225k (6.0% below list) — sets the bar for market timing.
- Cap rate 8.6% vs local median 2.7% in Palm Springs — top-decile yield for the area; either an underpriced asset or a hidden risk that comps aren't pricing in. Stress-test before assuming the spread holds.
Location & tenants
- Location reads 66/100 on livability (#348 in CA) — a middle-class / working-renter tenant base. Strengths: amenities A+, commute A+; Watch: schools C-, crime F, cost of living F.
- Palm Springs Unified (suburban): math 21% / reading 42% proficiency, ranked #328 of 517 in CA (top 63%) — families likely to look elsewhere, expect single-tenant / working-renter base with shorter leases; 73% free/reduced lunch — lower-income household profile, screen leases tightly.
- Market conditions: Rents soft (-0.4%/yr); 492 active listings in the ZIP; 40 comparable units currently listed for rent nearby; rentals lingering (median 44d on market — plan ~5-8 weeks vacancy on turnover, expect pricing pressure); 50% of comp listings sitting > 30 days — soft ceiling on asking rent; solid renter incomes; 9,195 units permitted in Riverside County in 2024 (1,512 in 5+ unit buildings).
- This rent runs 41% of the median local income ($78k/yr) — at the standard rent-burdened threshold; future hikes will face affordability resistance.
Forward outlook
- Local home prices are declining (-3.0%/yr); year-one equity from $2k of loan paydown is wiped out by about $7k of value loss. Plan a longer hold.
- Riverside County population projected at +22% by 2050 — long-run rental-demand tailwind backs the buy-and-hold thesis.
Negotiation context
- It's been on market 80 days — a 6% lower offer ($225k) is reasonable based on typical stale-listing flexibility.
- 12 sale attempts since 17y ago with the ask held roughly flat each time — persistent listings suggest the price (not the market) is what's stuck; bring a comps-based counter.
Risks & watch-outs
- Climate carrying-cost: extreme-heat days projected 7→21/yr by 2055 (HVAC capex compounding) — expect insurance premiums to compound above CPI over the hold.
Questions for the listing agent
- It's been on market 80 days. Have you received any prior offers? Is the seller open to a 6% concession, seller financing, or rate buy-down credit?
- Built in 1976 — when were the roof, HVAC, electrical panel, plumbing, and water heater last replaced?
- Why hasn't it sold? Are there any deal-killer items the seller is aware of (foundation, flood, title, zoning, code violations)?
- Is there a deadline driving the sale (1031 exchange, divorce, estate, relocation)? That informs how much negotiation room exists.
- Crime grade is F in this area — have there been break-ins, vandalism, or insurance claims at this property in the last 3 years? What carrier currently insures it and at what premium?
- What's the average days-on-market for RENTAL listings here right now (not sales)? A rising rental-DOM trend means longer vacancies and softer asking-rent achievability than the comps imply.
- What's the recent tenant-quality profile in this submarket — average credit score on applications, eviction rate, late-payment / NSF rate, and stable-employment percentage? A property-management company in the area should have these aggregated.
- How much new for-sale + rental construction is in the pipeline within 1–3 miles? Heavy new supply typically softens prices + rents 12–24 months out; constrained supply supports both.
Investment metrics
- 1% rule
- 1.10% ✓
- Cap rate
- 8.63%
- Cash-on-cash
- 8.36%
- DSCR
- 1.37
- GRM
- 7.6
CMA / ARV
- ARV (median comp)
- $432,208
- List price
- $239,000
- Delta
- -44.70%
- Verdict
- UNDERPRICED
- Comps
- 15 within 2.0 mi
Show comp detail 12 sales within ~0.75 mi
| Address | Dist | Beds/Ba | Sqft | Sold | Price | $/sf | Match |
|---|---|---|---|---|---|---|---|
| 2 Calle Abajo | 0.09mi | 2/2.0 | 1,440 (0%) | 3mo | $190,000 | $132 | 94 |
| 291 Juniper Dr | 0.07mi | 2/2.0 | 1,440 (0%) | 4mo | $250,000 | $174 | 93 |
| 191 Figuaro Dr | 0.11mi | 2/2.0 | 1,440 (0%) | 4mo | $289,000 | $201 | 92 |
| 183 Figuaro Dr | 0.10mi | 2/2.0 | 1,440 (0%) | 6mo | $387,000 | $269 | 90 |
| 284 Saguaro Dr | 0.08mi | 2/2.0 | 1,488 (+3%) | 2mo | $267,240 | $180 | 89 |
| 110 Aliso Dr | 0.24mi | 2/2.0 | 1,440 (0%) | 3mo | $239,000 | $166 | 86 |
| 274 Encino Dr | 0.05mi | 2/2.0 | 1,392 (-3%) | 9mo | $275,000 | $198 | 85 |
| 210 Coyote Dr | 0.08mi | 2/2.0 | 1,488 (+3%) | 7mo | $239,000 | $161 | 85 |
| 356 Saguaro Dr | 0.09mi | 2/2.0 | 1,539 (+7%) | 0mo | $330,000 | $214 | 84 |
| 81 Calle Del Espacio | 0.11mi | 2/2.0 | 1,536 (+7%) | 3mo | $80,000 | $52 | 81 |
| 175 Vista De Oeste | 0.34mi | 2/2.0 | 1,456 (+1%) | 8mo | $140,000 | $96 | 76 |
| 147 Vista De Oeste | 0.32mi | 2/2.0 | 1,291 (-10%) | 0mo | $190,000 | $147 | 67 |
Match score weights: distance 35% · size 25% · config 20% · recency 20%. Top-matched comps best support the ARV.
Projected returns pro-forma
-3.0% appreciation · 0.0% rent growth · sell at horizon
- IRR
- -7.0%
- Equity multiple
- 0.75×
- Total profit
- $-16,728
- Equity at exit
- $35,636
- IRR
- -1.5%
- Equity multiple
- 0.91×
- Total profit
- $-6,092
- Equity at exit
- $20,664
Cash invested: $66,920 (down + closing). Projections, not guarantees.
Landlord ↔ Tenant lean methodology
- Overall (STATE)
- 18 Strongly Tenant-Friendly
- State California
- 18 Strongly Tenant-Friendly · D+13
- County
- — inherits STATE
- City
- — inherits STATE
ZIP-level market 92264
- Rents YoY
- -0.4%
- Active inventory
- 492
- Price-to-rent
- 7.6×
Monthly cashflow live
- Estimated rent
- $2,635 high interval (Pro) →
- Mortgage (P&I)
- −$1,253
- Tax from tax record
- −$263 /mo · $3,152/yr
- Insurance
- −$100
- HOA
- −$0
- Vacancy / Maint / Mgmt
- −$553
- Net cashflow
- $466
Break-even live
UW: 25.0% down · 7.5% · 30yr · 1.5% tax · 5.0% vac · 8.0% maint · 8.0% mgmt
Financing live
Cash to close
- Down payment
- $59,750
- Closing costs
- $7,170
- Reserves months
- —
- Total cash needed
- —
Loan-product check · same deal, 3 products live
Conventional
25% down · 7.5% · 30yr
- Down + closing
- —
- Monthly P&I
- —
- Monthly cashflow
- —
- DSCR
- —
- Eligible?
- —
Personal DTI + credit; lowest rate.
DSCR
20% down · 8.5% · 30yr
- Down + closing
- —
- Monthly P&I
- —
- Monthly cashflow
- —
- DSCR
- —
- Eligible?
- —
No personal income docs; deal must DSCR.
Hard money
10% down · 12.0% · 12mo
- Down + closing
- —
- Monthly P&I
- —
- Monthly cashflow
- —
- DSCR
- —
- Eligible?
- —
Short-term bridge; refi at stabilization.
Rent comps 40 comps
| Address | Beds | Baths | Sqft | Rent | $/sqft | DOM | Units | Dist |
|---|---|---|---|---|---|---|---|---|
| 26 Pueblo Vista Dr Palm Springs, CA | 3.0 | 2.0 | 1487 | $3,200 | $2.15 | 43d | 1 | 0.28mi |
| 2420 Los Coyotes Dr Palm Springs, CA | 2.0 | 3.0 | 1608 | $2,600 | $1.62 | 43d | 1 | 0.35mi |
| 2700 Lawrence Crossley Rd #18 Palm Springs, CA | 2.0 | 2.0 | 885 | $2,050 | $2.32 | 18d | 1 | 0.40mi |
| 2700 Lawrence Crossley Rd Unit B15 Palm Springs, CA | 2.0 | 2.0 | 885 | $1,950 | $2.20 | 43d | 1 | 0.40mi |
| 2800 Lawrence Crossley Rd Palm Springs, CA | 2.0 | 2.0 | 905 | $2,022 | $2.23 | 43d | 1 | 0.44mi |
| 2010 Lawrence Crossley Rd Unit 8 Palm Springs, CA | 2.0 | 1.5 | 993 | $1,895 | $1.91 | 13d | 1 | 0.44mi |
| 5314 Los Coyotes Dr Palm Springs, CA | 3.0 | 3.0 | 1550 | $2,600 | $1.68 | 19d | 1 | 0.45mi |
| 5951 Montecito Dr #5 Palm Springs, CA | 3.0 | 2.5 | 1551 | $2,300 | $1.48 | 43d | 1 | 0.49mi |
| 5301 E Waverly Dr Palm Springs, CA | 1.0–2.0 | 2.0 | 933 | $2,300 | $2.47 | 14d | 2 | 0.52mi |
| 5301 E Waverly Dr Palm Springs, CA | 1.0–2.0 | 2.0 | 933 | $2,300 | $2.47 | 18d | 2 | 0.52mi |
| 5301 E Waverly Dr #192 Palm Springs, CA | 2.0 | 2.0 | 979 | $2,300 | $2.35 | 24d | 1 | 0.58mi |
| 5301 E Waverly Dr #120 Palm Springs, CA | 1.0 | 2.0 | 887 | $2,800 | $3.16 | 43d | 1 | 0.58mi |
| 68368 Calle Leon Cathedral City, CA | 2.0 | 2.0 | 1406 | $3,790 | $2.70 | 43d | 1 | 0.67mi |
| 68368 Calle Leon Cathedral City, CA | 2.0 | 2.0 | 1406 | $3,790 | $2.70 | 14d | 1 | 0.67mi |
| 35200 Cathedral Canyon Dr Unit B10 Cathedral City, CA | 2.0 | 2.0 | 1384 | $2,600 | $1.88 | 43d | 1 | 0.69mi |
| 5225 E Waverly Dr #66 Palm Springs, CA | 1.0 | 2.0 | 887 | $3,600 | $4.06 | 43d | 1 | 0.71mi |
| 34197 Calle Mora Cathedral City, CA | 2.0 | 2.0 | 1171 | $2,300 | $1.96 | 21d | 1 | 0.74mi |
| 34197 Calle Mora Cathedral City, CA | 2.0 | 2.0 | 1171 | $2,300 | $1.96 | 10d | 1 | 0.74mi |
| 34197 Calle Mora Cathedral City, CA | 2.0 | 2.0 | 1171 | $2,300 | $1.96 | 13d | 1 | 0.74mi |
| 6071 Hazeltine Plz Palm Springs, CA | 2.0 | 2.0 | 1168 | $3,200 | $2.74 | 43d | 1 | 0.75mi |
| 35200 Cathedral Canyon Dr Unit H64 Cathedral City, CA | 2.0 | 2.0 | 1375 | $2,500 | $1.82 | 43d | 1 | 0.77mi |
| 68153 Lakeland Dr Cathedral City, CA | 2.0 | 2.0 | 1255 | $2,500 | $1.99 | 24d | 1 | 0.77mi |
| 33892 Sky Blue Water Trl Cathedral City, CA | 3.0 | 2.0 | 1352 | $2,800 | $2.07 | 4d | 1 | 0.79mi |
| 68615 Paseo Soria Cathedral City, CA | 2.0 | 2.0 | 1462 | $3,500 | $2.39 | 7d | 1 | 0.83mi |
| 2601 S Broadmoor Dr Palm Springs, CA | 2.0 | 2.0 | 1178 | $2,050 | $1.74 | 43d | 2 | 0.88mi |
| 2441 S Birdie Way Unit E Palm Springs, CA | 2.0 | 2.0 | 1438 | $3,250 | $2.26 | 24d | 1 | 0.90mi |
| 33387 Shifting Sands Trl Unit 2 Cathedral City, CA | 2.0 | 2.0 | 1300 | $1,999 | $1.54 | 24d | 1 | 0.94mi |
| 2104 S Birdie Way Palm Springs, CA | 3.0 | 2.0 | 1456 | $3,600 | $2.47 | 43d | 1 | 0.95mi |
| 4850 N Winners Cir Unit A Palm Springs, CA | 2.0 | 2.0 | 1275 | $2,700 | $2.12 | 16d | 1 | 0.96mi |
| 68859 Paseo Real Cathedral City, CA | 2.0 | 2.0 | 1406 | $3,960 | $2.82 | 43d | 1 | 1.03mi |
| 68859 Paseo Real Cathedral City, CA | 2.0 | 2.0 | 1406 | $3,960 | $2.82 | 14d | 1 | 1.03mi |
| 33495 Cathedral Canyon Dr Unit B Cathedral City, CA | 2.0 | 1.0 | 1100 | $2,100 | $1.91 | 43d | 1 | 1.05mi |
| 33495 Cathedral Canyon Dr Cathedral City, CA | 2.0 | 1.0 | 1100 | $2,200 | $2.00 | 43d | 1 | 1.05mi |
| 2550 Miramonte Cir E Unit C Palm Springs, CA | 3.0 | 2.5 | 1397 | $2,730 | $1.95 | 24d | 1 | 1.05mi |
| 68882 Calle Mula Cathedral City, CA | 2.0 | 2.0 | 1714 | $2,500 | $1.46 | 20d | 1 | 1.06mi |
| 272 Desert Lakes Dr Palm Springs, CA | 2.0 | 2.0 | 1545 | $7,000 | $4.53 | 43d | 1 | 1.07mi |
| 2350 Miramonte Cir E Unit A Palm Springs, CA | 2.0 | 2.0 | 1264 | $3,000 | $2.37 | 24d | 1 | 1.09mi |
| 2350 Miramonte Cir E Unit E Palm Springs, CA | 2.0 | 2.0 | 1241 | $4,500 | $3.63 | 43d | 1 | 1.09mi |
| 306 Desert Lakes Dr Palm Springs, CA | 2.0 | 2.0 | 1545 | $8,000 | $5.18 | 43d | 1 | 1.11mi |
| Lawrence Crossley Rd Unit 62 Palm Springs, CA | 2.0 | 2.0 | 885 | $2,100 | $2.37 | 43d | 1 | 1.13mi |
Listing history 50 events
-
2026-06-18days on market $239,000 Active 80 DOM
-
2026-06-17days on market $239,000 Active 79 DOM
-
2026-06-16days on market $239,000 Active 78 DOM
-
2026-06-15days on market $239,000 Active 77 DOM
-
2026-06-13days on market $239,000 Active 75 DOM
-
2026-06-13days on market $239,000 Active 74 DOM
-
2026-06-09days on market $239,000 Active 71 DOM
-
2026-06-08days on market $239,000 Active 70 DOM
-
2026-06-07days on market $239,000 Active 69 DOM
-
2026-06-04days on market $239,000 Active 66 DOM
-
2026-06-03days on market $239,000 Active 65 DOM
-
2026-06-02days on market $239,000 Active 64 DOM
-
2026-06-01days on market $239,000 Active 63 DOM
-
2026-05-31days on market $239,000 Active 62 DOM
-
2026-05-14price $239,000 655-char remark
Show marketing remark (655 chars)
INVESTORS, you OWN THE LAND, LOCATION IS PALM SPRINGS CA. HEART OF CITY, NEAR AIRPORT, SHOPPING AND DINING, CASINOS. 55 + no age restriction to own as an investor, TENANT IN PLACE. HOA is affordable, $355. per month. Tenant pays utilities. CLUBHOUSE, 2 pools, spas and tennis courts, RV parking area separated from homes inside the community. Location near Trader Joes, is mere minutes from downtown, Not windy, highly desirable area. Home is owned by Realtor, and has 20K in updates since purchased for $250,000 in 2024. For details * see private remarks. or Call Listing agent. Home is clean and always maintained and easy to show. Photos are current.
-
2026-03-30$250,000 Active 655-char remark
Show marketing remark (655 chars)
INVESTORS, you OWN THE LAND, LOCATION IS PALM SPRINGS CA. HEART OF CITY, NEAR AIRPORT, SHOPPING AND DINING, CASINOS. 55 + no age restriction to own as an investor, TENANT IN PLACE. HOA is affordable, $355. per month. Tenant pays utilities. CLUBHOUSE, 2 pools, spas and tennis courts, RV parking area separated from homes inside the community. Location near Trader Joes, is mere minutes from downtown, Not windy, highly desirable area. Home is owned by Realtor, and has 20K in updates since purchased for $250,000 in 2024. For details * see private remarks. or Call Listing agent. Home is clean and always maintained and easy to show. Photos are current.
-
2026-03-30historical
Show marketing remark (655 chars)
INVESTORS, you OWN THE LAND, LOCATION IS PALM SPRINGS CA. HEART OF CITY, NEAR AIRPORT, SHOPPING AND DINING, CASINOS. 55 + no age restriction to own as an investor, TENANT IN PLACE. HOA is affordable, $355. per month. Tenant pays utilities. CLUBHOUSE, 2 pools, spas and tennis courts, RV parking area separated from homes inside the community. Location near Trader Joes, is mere minutes from downtown, Not windy, highly desirable area. Home is owned by Realtor, and has 20K in updates since purchased for $250,000 in 2024. For details * see private remarks. or Call Listing agent. Home is clean and always maintained and easy to show. Photos are current.
-
2026-02-19price $258,800
-
2026-02-04$268,800 Active
-
2026-02-04$250,000 Active
-
2026-02-03historical
-
2025-07-23price $269,000
-
2025-07-23status Active
-
2025-07-16historical Active Under Contract
-
2025-05-08price $265,000
-
2025-02-21price $267,000
-
2025-01-23$275,000 Active
-
2024-07-26soldstatus $250,000 Sold
-
2024-07-26soldstatus $250,000
-
2024-07-17historical Backup Offers Accepted
-
2024-06-12price $250,000
-
2024-04-21price $279,900
-
2024-03-07status Active
-
2024-03-03historical Backup Offers Accepted
-
2024-02-02price $285,000
-
2023-12-31$299,000 Active
-
2021-11-05soldstatus $242,000 Closed
-
2021-11-05soldstatus $242,000
-
2021-10-08historical Active Under Contract
-
2021-09-30$242,000 Active
-
2019-09-18historical
-
2015-12-10soldstatus $120,000 Sold
-
2015-12-10soldstatus $120,000 Closed
-
2015-12-10soldstatus $120,000
-
2015-10-21status Pending
-
2015-08-04$139,000 Active
-
2009-09-10historical
-
2009-09-10historical
-
2009-09-01soldstatus $125,000
-
2009-02-25
ⓘ Source: listings_history table (triggers on properties + properties_extension) + one-shot
backfill from property_details.listing_events for pre-trigger history.
Tax reassessment forecast CA · Resets to sale price
- Current annual tax
- $3,152 · $263/mo
- Projected year-2 tax
- $3,152 · $263/mo
- Expected delta
- $0/yr ($0/mo · 0.0%)
ⓘ Screening estimate from a state-policy table — verify with the county assessor before closing.
Climate risk First Street
- Flood 1/10 Low FEMA zone X · 0% chance over 30 yrs
- Wildfire 4/10 Moderate
- Heat 9/10 Extreme 7 d/yr ≥112°F today · 21 d/yr by 30 yrs out
- Wind 1/10 Low
- Air quality 5/10 Major 6 unhealthy d/yr today · 8 by 30 yrs out
Nearby sold comps map
Loading sold comps map…
Walkable amenities ~0.75 mi
Loading nearby amenities…
Taxation est. · year 1
- Rental income
- $31,625
- − Mortgage interest
- −$13,388
- − Property taxes
- −$3,152
- − Insurance
- −$1,195
- − Repairs & maintenance
- −$2,530
- − Management
- −$2,530
- − Depreciation
- −$6,953
- Taxable income
- $1,878
- Est. tax owed @ 24.0%
- −$451
- After-tax cash flow
- $5,146/yr
For passive investors: Depreciation is non-cash, so a rental often shows a tax loss while cash-flowing — sheltering income. Rental losses are passive: they offset passive income freely, and up to $25,000/yr can offset ordinary (W-2) income if you actively participate and your MAGI is under $100k (phasing out to $0 by $150k); unused losses carry forward. On sale, claimed depreciation is recaptured at up to 25%, and gains may owe capital-gains tax (a 1031 exchange can defer both). Figures are a year-1 estimate at your 24.0% rate — not tax advice; consult a CPA.
Schools (NCES district)
- District
- Palm Springs Unified
- NCES district ID
- 0629550
- Math proficiency
- 21% ▼ -7.00%
- Reading proficiency
- 42% ▬ 0.00%
- Median HH income
- $43,638
- Composite
- 26.76/100
- National rank
- #7131
- State rank
- #328 of 517 in CA
Livability — Palm Springs
- Score
- 66/100
- State rank
- #348
- US rank
- #11850
Category grades
Schools grade is shown separately in the Schools card above.
Census & demographics
- Census place
- Palm Springs, CA
- County
- Riverside County · 2,287,001 people
- City population
- 46,786
- Metro
- Riverside-San Bernardino-Ontario, CA
- Population (ZIP)
- 19,899
- Household income
- $77,688
- Rent vs Own
- Severe rent burden
- 1215.0
Population outlook (Riverside County) Hauer SSP2
- Today (2025)
- 2,664,475 people
- By 2030
- 2,802,692 · +5.2%
- By 2040
- 3,050,904 · +14.5%
- By 2050
- 3,256,783 · +22.2%
- By 2075
- 3,655,058 · +37.2%
- By 2100
- 3,766,594 · +41.4%
Race, ethnicity, and origin ACS 2023
- Neighborhood character
- Predominantly White (68%)
- Race & ethnicity
- White 68% Hispanic / Latino 20% Two or more races 12% Asian 6% Black 2% Native American 1%
- Hispanic origin (detail)
- Mexican 16%
- Common ancestry
- Lithuanian 4% Romanian 3% Slovak 3%
- Foreign-born
- 16% · Canada, China, South Korea
- Languages at home
- 81% English-only · Spanish 13% Tagalog/Filipino 2% Other Asian/Pacific 1%
Political lean MEDSL · Riverside
- 2024 margin
- Toss-up / Even · D 48.0% · R 49.3% · Other 2.6%
- 2008→2024 swing
- -3.6pp toward R · 2008: 2.3pp · 2024: -1.3pp
- All cycles
- 2024: R+1.3 2020: D+8.0 2016: D+4.3 2012: R+0.4 2008: D+2.3
Not yet ingested
- Civics
- —
Market trends
- HPI YoY
- ▼ -489.04%
- Current HPI
- 357.0969
- Rent YoY
- ▼ -0.43%
- Metro
- Riverside-San Bernardino-Ontario, CA
- State GDP YoY
- ▲ 3.21%
- F500 in state
- 116
Industry mix (Fortune 500 HQ in CA)
| Industry | F500 HQs | Revenue |
|---|---|---|
| Technology | 27 | $1,492B |
|
||
| Financial Services | 3 | $174B |
|
||
| Retail | 3 | $44B |
|
||
| Insurance | 3 | $26B |
|
||
| Media / Entertainment | 2 | $115B |
|
||
| Pharmaceuticals / Biotech | 2 | $62B |
|
||
Price history
+36.6% since first listed38 events — show timeline
- 2026-05-14 Price Changed $239,000 GPSMLS
- 2026-03-30 Listing Removed — GPSMLS
- 2026-03-30 Listed $250,000 GPSMLS
- 2026-02-19 Price Changed $258,800 GPSMLS
- 2026-02-04 Listed $250,000 GPSMLS
- 2026-02-04 Listed $268,800 GPSMLS
- 2026-02-03 Listing Removed — GPSMLS
- 2025-07-23 Price Changed $269,000 GPSMLS
- 2025-07-23 Relisted — GPSMLS
- 2025-07-16 Contingent — GPSMLS
- 2025-05-08 Price Changed $265,000 GPSMLS
- 2025-02-21 Price Changed $267,000 GPSMLS
- 2025-01-23 Listed $275,000 GPSMLS
- 2024-07-26 Sold (Public Records) $250,000 Public Records
- 2024-07-26 Sold (MLS) $250,000 TheMLS
- 2024-07-17 Contingent — TheMLS
- 2024-06-12 Price Changed $250,000 TheMLS
- 2024-04-21 Price Changed $279,900 TheMLS
- 2024-03-07 Relisted — TheMLS
- 2024-03-03 Contingent — TheMLS
- 2024-02-02 Price Changed $285,000 TheMLS
- 2023-12-31 Listed $299,000 TheMLS
- 2021-11-05 Sold (Public Records) $242,000 Public Records
- 2021-11-05 Sold (MLS) $242,000 GPSMLS
- 2021-10-08 Contingent — GPSMLS
- 2021-09-30 Listed $242,000 GPSMLS
- 2019-09-18 Listing Removed — GPSMLS
- 2015-12-10 Sold (Public Records) $120,000 Public Records
- 2015-12-10 Sold (MLS) $120,000 GPSMLS
- 2015-12-10 Sold (MLS) $120,000 GPSMLS
- 2015-10-21 Pending — GPSMLS
- 2015-08-04 Listed $139,000 GPSMLS
- 2009-09-10 Delisted — PALM
- 2009-09-10 Delisted — PALM
- 2009-09-01 Sold (Public Records) $125,000 Public Records
- 2009-02-25 Listed — PALM
- 2009-02-10 Listed — PALM
- 2009-02-10 Listed $175,000 GPSMLS
Property tax history
+3.1%/yrLatest (2025): $3,152 · -2.4% YoY. Source: county tax records.
Cash-flow waterfall
monthlySold comps — $/sqft
last 12 mo · ≤1 miLoading sold comps…