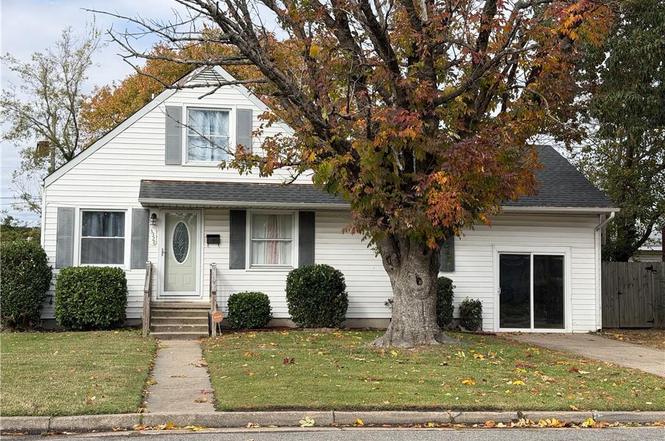
3328 Candlewood Dr · Hampton, VA
Flood risk 1/10 · Minimal
- FEMA flood zone
- X (unshaded)
- Chance of flooding over 30 yrs
- 0.0%
- Est. flood insurance / yr
- $473 – $860
Fire risk 1/10 · Minimal
- Est. fire insurance / yr
- $666 – $1,236
Heat risk 9/10 · Severe
- Hot days now (above 105°F)
- 7 days/yr
- Hot days in 30 yrs
- 16 days/yr
Wind risk 8/10 · Major
- Chance of severe wind over 30 yrs
- 80.0%
Air-quality risk 2/10 · Minimal
- Unhealthy air days now
- 1 days/yr
- Unhealthy air days in 30 yrs
- 1 days/yr
Risk factors via First Street. Map © Google.
Why this score? — see what drove the B grade
The composite is a weighted blend of 9 inputs, each scored 0–100. Each bar is that input's sub-score; the figure is the points it added to the 100-point composite (weight × sub-score).
- Cash flow +25.8/30.0
- ARV discount +15.0/15.0
- DSCR +8.6/10.0
- 1% rule +7.3/10.0
- Schools +5.5/10.0
- Livability +3.8/5.0
- Rent growth +3.5/5.0
- Condition / age +2.5/5.0
- Appreciation +0.0/10.0
$195,000
🖨 Deal sheet 📄 Offer letter ✓ Due diligence
Listing remarks
AMAZING OPPORTUNITY. A little love and INSTANT equity on this one!! 4 bedrooms, 2 baths, updated kitchen. Needs a good cleaning and some fresh paint and you'll be good to go! Selling as-is for a quick sale, subject to short sale approval, but definitely worth it! Schedule your showing today!
Key facts
- Built 1958
- Listed 27 days
Neighborhood map
What this means for you Summary
Snapshot
- This is a 4-bed/2.0-bath single-family listed at $195k.
Deal economics
- At list price, monthly cash flow is $471 ($6k/yr) — positive.
- The deal already cash-flows at list — no discount required.
- Meets the 1% rule at list price ($2k rent vs $195k).
- Recommended offer: $192k (1.5% below list) — sets the bar for market timing.
- Cap rate 9.2% vs local median 4.5% in Hampton — top-decile yield for the area; either an underpriced asset or a hidden risk that comps aren't pricing in. Stress-test before assuming the spread holds.
Location & tenants
- Location reads 75/100 on livability (#133 in VA, #4,302 nationally) — a middle-class / working-renter tenant base. Strengths: housing A+, health & safety A+, cost of living A; Watch: crime C-, amenities D+, commute F.
- Hampton City Public School District (urban): math 60% / reading 70% proficiency, ranked #40 of 131 in VA (top 30%) — acceptable for families but not a draw, mixed tenant base, ~2y average lease.
- Zoned schools: Christopher C. Kraft Elementary (math 52% / reading 67%, grade B-, #536 of 1,108 statewide, top 51%, 457 students, 85% FRL); Bethel High (math 64% / reading 84%, grade B+, #120 of 319 statewide, top 38%, 1,777 students, 86% FRL) — zoned schools average 85% FRL vs 49% district-wide (37 pts higher); higher-poverty schools than district average — tighter screening recommended.
- Market conditions: Rents rising fast (+4.0%/yr); 231 active listings in the ZIP; 5 comparable units currently listed for rent nearby; rentals at typical pace (median 15d on market — plan ~3-4 weeks tenant-placement turnaround); 68 units permitted in Hampton city in 2024 (0 in 5+ unit buildings).
- This rent runs 40% of the median local income ($73k/yr) — at the standard rent-burdened threshold; future hikes will face affordability resistance.
Forward outlook
- Local home prices are declining (-3.0%/yr); year-one equity from $1k of loan paydown is wiped out by about $6k of value loss. Plan a longer hold.
- Hampton County population projected at -13% by 2050 — secular population decline; favor cash flow + early exit over multi-decade hold.
- At projected returns (-3.0% appreciation + 4.0% rent growth), your $55k cash investment doubles in ~10 years — after that, you're playing with house money.
Negotiation context
- It's been on market 27 days — a 2% lower offer ($192k) is reasonable based on typical stale-listing flexibility.
- 4 sale attempts since 7y ago with the ask held roughly flat each time — persistent listings suggest the price (not the market) is what's stuck; bring a comps-based counter.
Risks & watch-outs
- Watch-outs: built in 1958 — expect roof / HVAC / electrical / plumbing capex.
- Climate carrying-cost: severe wind risk, 80% chance of damaging wind over 30y; extreme-heat days projected 7→16/yr by 2055 (HVAC capex compounding) — expect insurance premiums to compound above CPI over the hold.
Questions for the listing agent
- Built in 1958 — when were the roof, HVAC, electrical panel, plumbing, and water heater last replaced?
- Is there a deadline driving the sale (1031 exchange, divorce, estate, relocation)? That informs how much negotiation room exists.
- Schools are B-rated — typically a magnet for longer-tenancy family renters. What's the average tenant stay here, and is there a school-zone premium baked into asking?
- What's the average days-on-market for RENTAL listings here right now (not sales)? A rising rental-DOM trend means longer vacancies and softer asking-rent achievability than the comps imply.
- What's the recent tenant-quality profile in this submarket — average credit score on applications, eviction rate, late-payment / NSF rate, and stable-employment percentage? A property-management company in the area should have these aggregated.
- How much new for-sale + rental construction is in the pipeline within 1–3 miles? Heavy new supply typically softens prices + rents 12–24 months out; constrained supply supports both.
Investment metrics
- 1% rule
- 1.23% ✓
- Cap rate
- 9.19%
- Cash-on-cash
- 10.35%
- DSCR
- 1.46
- GRM
- 6.8
CMA / ARV
- ARV (on-the-fly)
- $334,334
- Comps found
- 12
Show comp detail 12 sales within ~0.75 mi
| Address | Dist | Beds/Ba | Sqft | Sold | Price | $/sf | Match |
|---|---|---|---|---|---|---|---|
| 3325 Greenwood Dr | 0.08mi | 4/2.0 | 1,860 (-7%) | 3mo | $214,720 | $115 | 82 |
| 3311 Candlewood Dr | 0.11mi | 4/2.0 | 1,800 (-10%) | 4mo | $317,500 | $176 | 75 |
| 213 Albany Dr | 0.48mi | 4/2.5 | 2,151 (+7%) | 6mo | $299,900 | $139 | 58 |
| 1119 Gatling Dr | 0.69mi | 4/2.0 | 1,825 (-9%) | 1mo | $337,900 | $185 | 53 |
| 212 Woodbury Forrest Dr | 0.49mi | 3/2.5 (-1) | 2,204 (+10%) | 1mo | $199,000 | $90 | 52 |
| 710 Arlington Ter | 0.68mi | 4/3.0 | 2,165 (+8%) | 1mo | $321,000 | $148 | 50 |
| 228 Woodbury Forrest Dr | 0.60mi | 3/3.5 (-1) | 2,096 (+5%) | 6mo | $349,900 | $167 | 49 |
| 205 Gumwood Dr | 0.58mi | 4/2.0 | 1,752 (-12%) | 5mo | $315,000 | $180 | 48 |
| 347 Brunell Dr | 0.67mi | 4/2.5 | 2,177 (+9%) | 5mo | $342,599 | $157 | 48 |
| 309 Sourwood Dr | 0.47mi | 3/2.0 (-1) | 1,740 (-13%) | 5mo | $293,000 | $168 | 48 |
| 218 Albany Dr | 0.44mi | 3/2.0 (-1) | 1,735 (-13%) | 6mo | $297,000 | $171 | 47 |
| 344 Brout Dr | 0.69mi | 4/2.5 | 2,232 (+12%) | 3mo | $359,900 | $161 | 44 |
Match score weights: distance 35% · size 25% · config 20% · recency 20%. Top-matched comps best support the ARV.
Projected returns pro-forma
-3.0% appreciation · 4.05% rent growth · sell at horizon
- IRR
- 0.5%
- Equity multiple
- 1.02×
- Total profit
- $1,032
- Equity at exit
- $29,075
- IRR
- 11.2%
- Equity multiple
- 1.93×
- Total profit
- $50,581
- Equity at exit
- $16,860
Cash invested: $54,600 (down + closing). Projections, not guarantees.
Landlord ↔ Tenant lean methodology
- Overall (STATE)
- 55 Moderately Landlord-Leaning
- State Virginia
- 55 Moderately Landlord-Leaning · D+2
- County
- — inherits STATE
- City
- — inherits STATE
ZIP-level market 23666
- Home prices YoY
- -15.7%
- Rents YoY
- 4.0%
- Active inventory
- 231
- Price-to-rent
- 6.8×
Monthly cashflow live
- Estimated rent
- $2,398 high interval (Pro) →
- Mortgage (P&I)
- −$1,023
- Tax from tax record
- −$320 /mo · $3,835/yr
- Insurance
- −$81
- HOA
- −$0
- Vacancy / Maint / Mgmt
- −$504
- Net cashflow
- $471
Break-even live
UW: 25.0% down · 7.5% · 30yr · 1.5% tax · 5.0% vac · 8.0% maint · 8.0% mgmt
Financing live
Cash to close
- Down payment
- $48,750
- Closing costs
- $5,850
- Reserves months
- —
- Total cash needed
- —
Loan-product check · same deal, 3 products live
Conventional
25% down · 7.5% · 30yr
- Down + closing
- —
- Monthly P&I
- —
- Monthly cashflow
- —
- DSCR
- —
- Eligible?
- —
Personal DTI + credit; lowest rate.
DSCR
20% down · 8.5% · 30yr
- Down + closing
- —
- Monthly P&I
- —
- Monthly cashflow
- —
- DSCR
- —
- Eligible?
- —
No personal income docs; deal must DSCR.
Hard money
10% down · 12.0% · 12mo
- Down + closing
- —
- Monthly P&I
- —
- Monthly cashflow
- —
- DSCR
- —
- Eligible?
- —
Short-term bridge; refi at stabilization.
Rent comps 5 comps
| Address | Beds | Baths | Sqft | Rent | $/sqft | DOM | Units | Dist |
|---|---|---|---|---|---|---|---|---|
| 321 Big Bethel Rd Hampton, VA | 3.0 | 1.0 | 1400 | $2,300 | $1.64 | 12d | 1 | 0.24mi |
| 3318 Custer Ct Hampton, VA | 4.0 | 2.5 | 1625 | $2,500 | $1.54 | 12d | 1 | 0.37mi |
| 62 Cline Dr Hampton, VA | 5.0 | 2.0 | 2043 | $2,800 | $1.37 | 23d | 1 | 1.22mi |
| 119 Yorkshire Ter Hampton, VA | 4.0 | 1.5 | 1499 | $2,500 | $1.67 | 23d | 1 | 1.23mi |
| 7 Briar Dr Hampton, VA | 3.0 | 1.5 | 1626 | $1,850 | $1.14 | 14d | 1 | 1.31mi |
Listing history 15 events
-
2026-04-13soldstatus $241,684
-
2026-02-02status Under Contract
-
2026-01-10historical Active Under Contract
-
2026-01-06$195,000 Active
-
2025-11-18status Under Contract
-
2025-11-17historical
-
2025-11-13$245,000 Active
-
2019-09-11soldstatus $208,900
-
2019-08-01status Under Contract
-
2019-07-23$208,900 Active
-
2019-06-27status Under Contract
-
2019-06-25historical
-
2019-06-06$208,900 Active
-
2018-04-30soldstatus $75,000
-
1959-04-01soldstatus $14,080
ⓘ Source: listings_history table (triggers on properties + properties_extension) + one-shot
backfill from property_details.listing_events for pre-trigger history.
Tax reassessment forecast VA · Resets to sale price
- Current annual tax
- $3,835 · $320/mo
- Projected year-2 tax
- $3,835 · $320/mo
- Expected delta
- $0/yr ($0/mo · 0.0%)
ⓘ Screening estimate from a state-policy table — verify with the county assessor before closing.
Climate risk First Street
- Flood 1/10 Low FEMA zone X (unshaded) · 0% chance over 30 yrs
- Wildfire 1/10 Low
- Heat 9/10 Extreme 7 d/yr ≥105°F today · 16 d/yr by 30 yrs out
- Wind 8/10 Severe 80% chance of damaging wind over 30 yrs
- Air quality 2/10 Low 1 unhealthy d/yr today · 1 by 30 yrs out
Nearby sold comps map
Loading sold comps map…
Walkable amenities ~0.75 mi
Loading nearby amenities…
Taxation est. · year 1
- Rental income
- $28,774
- − Mortgage interest
- −$10,923
- − Property taxes
- −$3,835
- − Insurance
- −$975
- − Repairs & maintenance
- −$2,302
- − Management
- −$2,302
- − Depreciation
- −$5,673
- Taxable income
- $2,764
- Est. tax owed @ 24.0%
- −$663
- After-tax cash flow
- $4,987/yr
For passive investors: Depreciation is non-cash, so a rental often shows a tax loss while cash-flowing — sheltering income. Rental losses are passive: they offset passive income freely, and up to $25,000/yr can offset ordinary (W-2) income if you actively participate and your MAGI is under $100k (phasing out to $0 by $150k); unused losses carry forward. On sale, claimed depreciation is recaptured at up to 25%, and gains may owe capital-gains tax (a 1031 exchange can defer both). Figures are a year-1 estimate at your 24.0% rate — not tax advice; consult a CPA.
Schools (NCES district)
- District
- Hampton City Public School District
- NCES district ID
- 5101800
- Math proficiency
- 60% ▼ -21.00%
- Reading proficiency
- 70% ▼ -4.00%
- Median HH income
- $50,089
- Composite
- 55.19/100
- National rank
- #1272
- State rank
- #40 of 131 in VA
Livability — Hampton
- Score
- 75/100
- State rank
- #133
- US rank
- #4302
Category grades
Schools grade is shown separately in the Schools card above.
Census & demographics
- Census place
- Hampton, VA
- County
- Hampton City · 132,421 people
- City population
- 132,421
- Metro
- Virginia Beach-Norfolk-Newport News, VA-NC
- Population (ZIP)
- 54,233
- Household income
- $72,568
- Rent vs Own
- Severe rent burden
- 2951.0
Population outlook (Hampton County) Hauer SSP2
- Today (2025)
- 134,055 people
- By 2030
- 131,753 · -1.7%
- By 2040
- 125,017 · -6.7%
- By 2050
- 116,825 · -12.9%
- By 2075
- 97,033 · -27.6%
- By 2100
- 76,188 · -43.2%
Race, ethnicity, and origin ACS 2023
- Neighborhood character
- Diverse neighborhood (Simpson 0.65)
- Race & ethnicity
- Black 51% White 29% Two or more races 10% Hispanic / Latino 9% Asian 4%
- Hispanic origin (detail)
- Mexican 3% Puerto Rican 3%
- Common ancestry
- Italian 1% Lithuanian 1% Romanian 1%
- Foreign-born
- 7% · Canada, Vietnam
- Languages at home
- 90% English-only · Spanish 5% Vietnamese 1% Arabic 1%
Political lean MEDSL · Hampton
- 2024 margin
- Solid D (+39.9) · D 69.2% · R 29.4% · Other 1.4%
- 2008→2024 swing
- +1.0pp no change · 2008: 38.9pp · 2024: 39.9pp
- All cycles
- 2024: D+39.9 2020: D+42.2 2016: D+37.8 2012: D+45.4 2008: D+38.9
Not yet ingested
- Civics
- —
Market trends
- HPI YoY
- ▼ -49.01%
- Current HPI
- 262.821
- Rent YoY
- ▲ 4.05%
- Metro
- Virginia Beach-Norfolk-Newport News, VA-NC
- State GDP YoY
- ▲ 2.40%
- F500 in state
- 50
Industry mix (Fortune 500 HQ in VA)
| Industry | F500 HQs | Revenue |
|---|---|---|
| Aerospace / Defense | 4 | $236B |
|
||
| Technology / Defense | 3 | $32B |
|
||
| Financial Services | 2 | $176B |
|
||
| Utilities | 2 | $27B |
|
||
| Insurance | 2 | $25B |
|
||
| Technology | 2 | $15B |
|
||
Price history
+1616.5% since first listed15 events — show timeline
- 2026-04-13 Sold (Public Records) $241,684 Public Records
- 2026-02-02 Pending — REINMLS
- 2026-01-10 Contingent — REINMLS
- 2026-01-06 Listed $195,000 REINMLS
- 2025-11-18 Pending — REINMLS
- 2025-11-17 Listing Removed — REINMLS
- 2025-11-13 Listed $245,000 REINMLS
- 2019-09-11 Sold (Public Records) $208,900 Public Records
- 2019-08-01 Pending — REINMLS
- 2019-07-23 Listed $208,900 REINMLS
- 2019-06-27 Pending — REINMLS
- 2019-06-25 Listing Removed — REINMLS
- 2019-06-06 Listed $208,900 REINMLS
- 2018-04-30 Sold (Public Records) $75,000 Public Records
- 1959-04-01 Sold (Public Records) $14,080 Public Records
Property tax history
+12.5%/yrLatest (2025): $3,835 · +15.5% YoY. Source: county tax records.
Cash-flow waterfall
monthlySold comps — $/sqft
last 12 mo · ≤1 miLoading sold comps…