 🏗️ New Construction
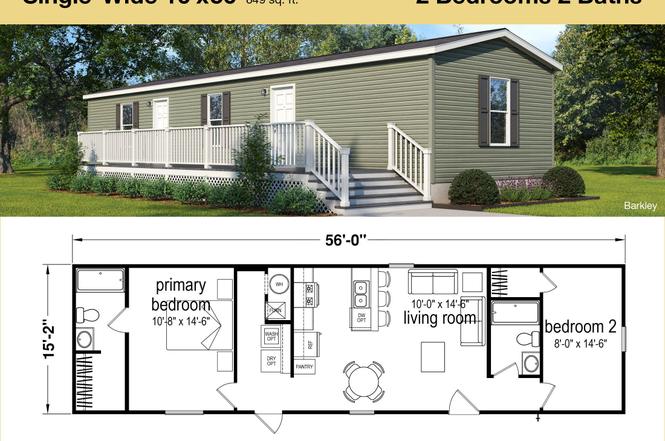
Barkley (Whispering Oaks) Plan · Brooks, KY
Flood risk 1/10 · Minimal
- FEMA flood zone
- X (unshaded)
- Chance of flooding over 30 yrs
- 0.0%
- Est. flood insurance / yr
- $507 – $1,088
Fire risk 3/10 · Minor
- Est. fire insurance / yr
- $839 – $1,559
Heat risk 5/10 · Moderate
- Hot days now (above 104°F)
- 7 days/yr
- Hot days in 30 yrs
- 19 days/yr
Wind risk 2/10 · Minimal
- Chance of severe wind over 30 yrs
- 2.0%
Air-quality risk 3/10 · Minor
- Unhealthy air days now
- 2 days/yr
- Unhealthy air days in 30 yrs
- 5 days/yr
Risk factors via First Street. Map © Google.
Why this score? — see what drove the D grade
The composite is a weighted blend of 9 inputs, each scored 0–100. Each bar is that input's sub-score; the figure is the points it added to the 100-point composite (weight × sub-score).
- 1% rule +10.0/10.0
- Cash flow +8.0/30.0
- ARV discount +7.5/15.0
- Rent growth +3.9/5.0
- Livability +3.2/5.0
- Schools +3.1/10.0
- Condition / age +2.5/5.0
- DSCR +2.1/10.0
- Appreciation +0.0/10.0
$65,995
🖨 Deal sheet 📄 Offer letter ✓ Due diligence
Listing remarks
Located in Bullitt County the Brooks exit 15 minutes from Louisville, Whispering Oaks Pointe is in a quiet suburban tree-lined neighborhood close to shopping, employment and schools. Community Amenities Basketball Court, Lake/Pond, Pantry, Picnic Area, and Playground Schools Brooks Elementary School, Hebron Middle School, and North Bullitt High School
Key facts
- Picnic area
- Lake/pond
- Basketball court
Tags
Property features AI
Finance
- Other: List price $65,995; Address: 315 Barricks Rd, Louisville KY 40229; Status: Active
- HOA & community: Association fee of $560
Exterior
- Home design: Single-family plan home
- Exterior features: Living area of 849
Interior
- Bedrooms: 2 bedrooms
- Bathrooms: 2 full bathrooms
- Interior features: Plan home — Barkley (Whispering Oaks)
Neighborhood map
What this means for you Summary
Snapshot
- This is a 2-bed/2.0-bath manufactured listed at $66k.
Deal economics
- At list price, monthly cash flow is $-67 ($-803/yr) — negative.
- To cash-flow at today's rent, offer at most $56k (14.7% below list).
- Meets the 1% rule at list price ($1k rent vs $66k).
- Recommended offer: $56k (14.7% below list) — sets the bar for cash-flow.
Location & tenants
- Location reads 65/100 on livability (#277 in KY) — a middle-class / working-renter tenant base. Strengths: crime A+, cost of living A+, housing A+; Watch: schools F, amenities F, commute F.
- Bullitt County (suburban): math 29% / reading 41% proficiency, ranked #55 of 165 in KY (top 33%) — families likely to look elsewhere, expect single-tenant / working-renter base with shorter leases.
- Market conditions: Rents rising fast (+5.5%/yr); 243 active listings in the ZIP; 9 comparable units currently listed for rent nearby; rentals at typical pace (median 24d on market — plan ~3-4 weeks tenant-placement turnaround); solid renter incomes; 380 units permitted in Bullitt County in 2024 (8 in 5+ unit buildings).
Forward outlook
- Local home prices are declining (-3.0%/yr); year-one equity from $456 of loan paydown is wiped out by about $2k of value loss. Plan a longer hold.
- Bullitt County population projected at +22% by 2050 — long-run rental-demand tailwind backs the buy-and-hold thesis.
Negotiation context
- It's been on market 236 days — a 12% lower offer ($58k) is reasonable based on typical stale-listing flexibility.
Risks & watch-outs
- Watch-outs: HOA is 47% of rent.
- Climate carrying-cost: extreme-heat days projected 7→19/yr by 2055 (HVAC capex compounding) — expect insurance premiums to compound above CPI over the hold.
Questions for the listing agent
- What do current leases actually rent for vs. the listed asking? Can we see a recent rent roll and the last 12 months of T-12 income?
- It's been on market 236 days. Have you received any prior offers? Is the seller open to a 15% concession, seller financing, or rate buy-down credit?
- What does the HOA fee cover, when was the last increase, and are there any pending special assessments or reserve-fund shortfalls?
- Why hasn't it sold? Are there any deal-killer items the seller is aware of (foundation, flood, title, zoning, code violations)?
- Is there a deadline driving the sale (1031 exchange, divorce, estate, relocation)? That informs how much negotiation room exists.
- Schools are F-rated, which usually means shorter tenancies and higher turnover. Who's the typical renter profile here, and what's been the actual vacancy rate?
- The area grade is low — what's the realistic commute time and amenity access for the typical tenant pool here? Any planned neighborhood developments (good or bad) we should know about?
- What's the average days-on-market for RENTAL listings here right now (not sales)? A rising rental-DOM trend means longer vacancies and softer asking-rent achievability than the comps imply.
- What's the recent tenant-quality profile in this submarket — average credit score on applications, eviction rate, late-payment / NSF rate, and stable-employment percentage? A property-management company in the area should have these aggregated.
- How much new for-sale + rental construction is in the pipeline within 1–3 miles? Heavy new supply typically softens prices + rents 12–24 months out; constrained supply supports both.
Investment metrics
- 1% rule
- 1.82% ✓
- Cap rate
- 5.08%
- Cash-on-cash
- -4.35%
- DSCR
- 0.81
- GRM
- 4.6
CMA / ARV
No comps found within radius.
Projected returns pro-forma
-3.0% appreciation · 5.46% rent growth · sell at horizon
- IRR
- -16.7%
- Equity multiple
- 0.38×
- Total profit
- $-11,549
- Equity at exit
- $9,840
- IRR
- -0.6%
- Equity multiple
- 0.95×
- Total profit
- $-927
- Equity at exit
- $5,706
Cash invested: $18,479 (down + closing). Projections, not guarantees.
Landlord ↔ Tenant lean methodology
- Overall (STATE)
- 83 Strongly Landlord-Friendly
- State Kentucky
- 83 Strongly Landlord-Friendly · R+16
- County
- — inherits STATE
- City
- — inherits STATE
ZIP-level market 40229
- Rents YoY
- 5.5%
- Active inventory
- 243
- Price-to-rent
- 4.6×
Monthly cashflow live
- Estimated rent
- $1,201 high interval (Pro) →
- Mortgage (P&I)
- −$346
- Tax est. 1.5%
- −$82 /mo · $990/yr
- Insurance
- −$27
- HOA
- −$560
- Vacancy / Maint / Mgmt
- −$252
- Net cashflow
- $-67
Break-even live
UW: 25.0% down · 7.5% · 30yr · 1.5% tax · 5.0% vac · 8.0% maint · 8.0% mgmt
Financing live
Cash to close
- Down payment
- $16,499
- Closing costs
- $1,980
- Reserves months
- —
- Total cash needed
- —
Loan-product check · same deal, 3 products live
Conventional
25% down · 7.5% · 30yr
- Down + closing
- —
- Monthly P&I
- —
- Monthly cashflow
- —
- DSCR
- —
- Eligible?
- —
Personal DTI + credit; lowest rate.
DSCR
20% down · 8.5% · 30yr
- Down + closing
- —
- Monthly P&I
- —
- Monthly cashflow
- —
- DSCR
- —
- Eligible?
- —
No personal income docs; deal must DSCR.
Hard money
10% down · 12.0% · 12mo
- Down + closing
- —
- Monthly P&I
- —
- Monthly cashflow
- —
- DSCR
- —
- Eligible?
- —
Short-term bridge; refi at stabilization.
Rent comps 9 comps
| Address | Beds | Baths | Sqft | Rent | $/sqft | DOM | Units | Dist |
|---|---|---|---|---|---|---|---|---|
| 184 Cannon Ct Unit 2 Louisville, KY | 2.0 | 1.5 | 975 | $1,000 | $1.03 | 10d | 1 | 0.46mi |
| 3600 Hillcross Dr Unit 6 Louisville, KY | 2.0 | 1.0 | 850 | $950 | $1.12 | 12d | 1 | 0.87mi |
| 3600 Hillcross Dr Unit 5 Louisville, KY | 2.0 | 1.0 | 850 | $950 | $1.12 | 24d | 1 | 0.87mi |
| 3700 Hillcross Dr Louisville, KY | 3.0 | 1.5 | 832 | $1,599 | $1.92 | 17d | 1 | 0.91mi |
| 4109 Blue Lick Ct Unit 7 Louisville, KY | 2.0 | 1.0 | 800 | $999 | $1.25 | 3d | 1 | 0.92mi |
| 4105 Blue Lick Ct Unit 4 Louisville, KY | 2.0 | 1.0 | 800 | $999 | $1.25 | 24d | 1 | 0.95mi |
| 4101 Blue Lick Ct Unit 3 Louisville, KY | 2.0 | 1.0 | 800 | $999 | $1.25 | 24d | 1 | 0.97mi |
| 4103 Blue Lick Ct Unit 7 Louisville, KY | 2.0 | 1.0 | 800 | $899 | $1.12 | 24d | 1 | 0.98mi |
| 365 Prairie Dr Unit 5 Louisville, KY | 2.0 | 1.5 | 975 | $1,250 | $1.28 | 24d | 1 | 1.35mi |
HOA detail
- Monthly dues
- $560 · $6,720/yr
Listing history 13 events
-
2026-06-18days on market $65,995 Active 236 DOM
-
2026-06-17days on market $65,995 Active 235 DOM
-
2026-06-16days on market $65,995 Active 234 DOM
-
2026-06-15days on market $65,995 Active 233 DOM
-
2026-06-13days on market $65,995 Active 231 DOM
-
2026-06-10days on market $65,995 Active 228 DOM
-
2026-06-09days on market $65,995 Active 227 DOM
-
2026-06-08days on market $65,995 Active 226 DOM
-
2026-06-07days on market $65,995 Active 225 DOM
-
2026-06-03days on market $65,995 Active 221 DOM
-
2026-06-02days on market $65,995 Active 220 DOM
-
2026-06-01days on market $65,995 Active 219 DOM
-
2026-05-31days on market $65,995 Active 218 DOM
ⓘ Source: listings_history table (triggers on properties + properties_extension) + one-shot
backfill from property_details.listing_events for pre-trigger history.
Climate risk First Street
- Flood 1/10 Low FEMA zone X (unshaded) · 0% chance over 30 yrs
- Wildfire 3/10 Moderate
- Heat 5/10 Major 7 d/yr ≥104°F today · 19 d/yr by 30 yrs out
- Wind 2/10 Low 2% chance of damaging wind over 30 yrs
- Air quality 3/10 Moderate 2 unhealthy d/yr today · 5 by 30 yrs out
Nearby sold comps map
Loading sold comps map…
Walkable amenities ~0.75 mi
Loading nearby amenities…
Taxation est. · year 1
- Rental income
- $14,417
- − Mortgage interest
- −$3,697
- − Property taxes
- −$990
- − Insurance
- −$330
- − Repairs & maintenance
- −$1,153
- − Management
- −$1,153
- − HOA
- −$6,720
- − Depreciation
- −$1,920
- Taxable loss
- −$1,546
- Est. tax savings @ 24.0%
- +$371
- After-tax cash flow
- $-432/yr
For passive investors: Depreciation is non-cash, so a rental often shows a tax loss while cash-flowing — sheltering income. Rental losses are passive: they offset passive income freely, and up to $25,000/yr can offset ordinary (W-2) income if you actively participate and your MAGI is under $100k (phasing out to $0 by $150k); unused losses carry forward. On sale, claimed depreciation is recaptured at up to 25%, and gains may owe capital-gains tax (a 1031 exchange can defer both). Figures are a year-1 estimate at your 24.0% rate — not tax advice; consult a CPA.
Schools (NCES district)
- District
- Bullitt County
- NCES district ID
- 2100750
- Math proficiency
- 29% ▼ -15.00%
- Reading proficiency
- 41% ▼ -14.00%
- Median HH income
- $55,009
- Composite
- 30.78/100
- National rank
- #6151
- State rank
- #55 of 165 in KY
Livability — Brooks
- Score
- 65/100
- State rank
- #277
- US rank
- #13521
Category grades
Schools grade is shown separately in the Schools card above.
Census & demographics
- Census place
- Brooks, KY
- County
- Jefferson County · 790,184 people
- Metro
- Louisville/Jefferson County, KY-IN
- Population (ZIP)
- 41,299
- Household income
- $79,936
- Rent vs Own
- Severe rent burden
- 628.0
Population outlook (Bullitt County) Hauer SSP2
- Today (2025)
- 89,555 people
- By 2030
- 94,389 · +5.4%
- By 2040
- 102,759 · +14.7%
- By 2050
- 108,955 · +21.7%
- By 2075
- 121,898 · +36.1%
- By 2100
- 126,383 · +41.1%
Race, ethnicity, and origin ACS 2023
- Neighborhood character
- Predominantly White (71%)
- Race & ethnicity
- White 71% Black 12% Hispanic / Latino 12% Two or more races 9% Asian 1%
- Hispanic origin (detail)
- Mexican 3% Cuban 6%
- Common ancestry
- Lithuanian 2% Slovak 2% Italian 1%
- Foreign-born
- 9% · Canada
- Languages at home
- 87% English-only · Spanish 10% Other Indo-European 1%
Political lean MEDSL · Bullitt
- 2024 margin
- Solid R (+51.0) · D 23.8% · R 74.8% · Other 1.4%
- 2008→2024 swing
- -18.7pp toward R · 2008: -32.3pp · 2024: -51.0pp
- All cycles
- 2024: R+51.0 2020: R+48.0 2016: R+49.8 2012: R+35.7 2008: R+32.3
Not yet ingested
- Civics
- —
Market trends
- HPI YoY
- ▼ -148.38%
- Current HPI
- 244.2747
- Rent YoY
- ▲ 5.46%
- Metro
- Louisville/Jefferson County, KY-IN
- State GDP YoY
- ▲ 1.81%
- F500 in state
- 4
Industry mix (Fortune 500 HQ in KY)
| Industry | F500 HQs | Revenue |
|---|---|---|
| Healthcare | 1 | $118B |
|
||
| Food / Beverage | 1 | $7B |
|
||
Cash-flow waterfall
monthlySold comps — $/sqft
last 12 mo · ≤1 miLoading sold comps…