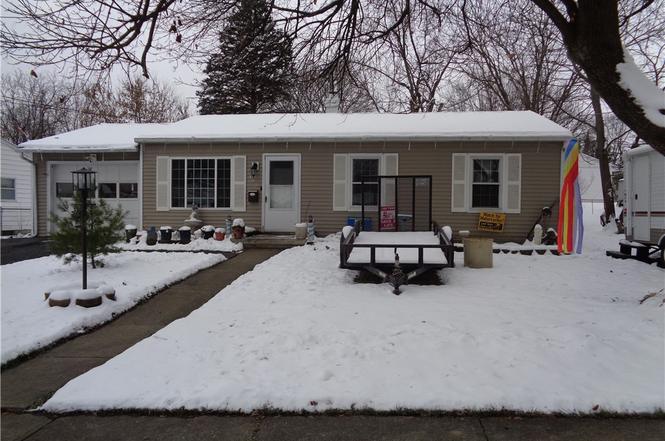
403 Shappee St · Horseheads, NY
Flood risk 1/10 · Minimal
- FEMA flood zone
- X (shaded)
- Chance of flooding over 30 yrs
- 0.0%
- Est. flood insurance / yr
- $507 – $1,088
Fire risk 1/10 · Minimal
- Est. fire insurance / yr
- $691 – $1,283
Heat risk 3/10 · Minor
- Hot days now (above 96°F)
- 8 days/yr
- Hot days in 30 yrs
- 17 days/yr
Wind risk 1/10 · Minimal
- Chance of severe wind over 30 yrs
- 1.0%
Air-quality risk 2/10 · Minimal
- Unhealthy air days now
- 0 days/yr
- Unhealthy air days in 30 yrs
- 1 days/yr
Risk factors via First Street. Map © Google.
Why this score? — see what drove the D+ grade
The composite is a weighted blend of 9 inputs, each scored 0–100. Each bar is that input's sub-score; the figure is the points it added to the 100-point composite (weight × sub-score).
- ARV discount +15.0/15.0
- Cash flow +11.9/30.0
- 1% rule +5.4/10.0
- Schools +4.5/10.0
- DSCR +3.5/10.0
- Livability +3.5/5.0
- Rent growth +2.5/5.0
- Condition / age +2.5/5.0
- Appreciation +0.0/10.0
$140,000
🖨 Deal sheet 📄 Offer letter ✓ Due diligence
Listing remarks MLS
BANK OWNED AND A GREAT OPPORTUNITY TO OWN INSTEAD OF RENTING. NEEDS TLC BUT PRICED BELOW ASSESSMENT. 3 BEDROOM, 1 BATH, UNHEATED ROOM AND EXTRA LONG GARAGE. SEE AGENT NOTES FOR OFFER INFO AND SHOWINGS INSTRUCTIONS.
Key facts
- Family room addition
- Spacious kitchen
- Water heater
Tags
Neighborhood map
What this means for you Summary
Snapshot
- This is a 3-bed/1.0-bath single-family listed at $140k.
Deal economics
- At list price, monthly cash flow is $-35 ($-419/yr) — negative.
- To cash-flow at today's rent, offer at most $134k (4.4% below list).
- Meets the 1% rule at list price ($1k rent vs $140k).
- Recommended offer: $127k (9.0% below list) — sets the bar for market timing.
Location & tenants
- Location reads 69/100 on livability (#494 in NY) — a middle-class / working-renter tenant base. Strengths: housing A+, cost of living A, schools B; Watch: crime D+, health & safety D, amenities F.
- Horseheads Central School District (suburban): math 44% / reading 58% proficiency, ranked #347 of 590 in NY (top 59%) — acceptable for families but not a draw, mixed tenant base, ~2y average lease.
- Market conditions: 92 active listings in the ZIP; 1 comparable units currently listed for rent nearby; 91 units permitted in Chemung County in 2024 (63 in 5+ unit buildings).
Forward outlook
- Local home prices are declining (-3.0%/yr); year-one equity from $968 of loan paydown is wiped out by about $4k of value loss. Plan a longer hold.
- Chemung County population projected at -17% by 2050 — secular population decline; favor cash flow + early exit over multi-decade hold.
Negotiation context
- It's been on market 116 days — a 9% lower offer ($127k) is reasonable based on typical stale-listing flexibility.
- 3 sale attempts since 24y ago with the ask held roughly flat each time — persistent listings suggest the price (not the market) is what's stuck; bring a comps-based counter.
- Current owner paid $54k; list at $140k implies a 159% gain — meaningful room to come down on a strong offer.
Risks & watch-outs
- Watch-outs: property tax is 3.3% of price.
Questions for the listing agent
- What do current leases actually rent for vs. the listed asking? Can we see a recent rent roll and the last 12 months of T-12 income?
- It's been on market 116 days. Have you received any prior offers? Is the seller open to a 9% concession, seller financing, or rate buy-down credit?
- Built in 1965 — when were the roof, HVAC, electrical panel, plumbing, and water heater last replaced?
- Property tax is high relative to price — has the assessment been appealed recently, and will the sale trigger a re-assessment?
- Why hasn't it sold? Are there any deal-killer items the seller is aware of (foundation, flood, title, zoning, code violations)?
- Is there a deadline driving the sale (1031 exchange, divorce, estate, relocation)? That informs how much negotiation room exists.
- Schools are B-rated — typically a magnet for longer-tenancy family renters. What's the average tenant stay here, and is there a school-zone premium baked into asking?
- Crime grade is D in this area — have there been break-ins, vandalism, or insurance claims at this property in the last 3 years? What carrier currently insures it and at what premium?
- The area grade is low — what's the realistic commute time and amenity access for the typical tenant pool here? Any planned neighborhood developments (good or bad) we should know about?
- What's the average days-on-market for RENTAL listings here right now (not sales)? A rising rental-DOM trend means longer vacancies and softer asking-rent achievability than the comps imply.
- What's the recent tenant-quality profile in this submarket — average credit score on applications, eviction rate, late-payment / NSF rate, and stable-employment percentage? A property-management company in the area should have these aggregated.
- How much new for-sale + rental construction is in the pipeline within 1–3 miles? Heavy new supply typically softens prices + rents 12–24 months out; constrained supply supports both.
Investment metrics
- 1% rule
- 1.04% ✓
- Cap rate
- 5.99%
- Cash-on-cash
- -1.07%
- DSCR
- 0.95
- GRM
- 8.0
CMA / ARV
- ARV (on-the-fly)
- $174,496
- Comps found
- 12
Show comp detail 12 sales within ~0.75 mi
| Address | Dist | Beds/Ba | Sqft | Sold | Price | $/sf | Match |
|---|---|---|---|---|---|---|---|
| 2805 Westinghouse Rd | 0.19mi | 3/1.5 | 1,189 (+4%) | 4mo | $170,215 | $143 | 80 |
| 325 Shappee St | 0.06mi | 3/1.5 | 1,025 (-11%) | 3mo | $179,900 | $176 | 75 |
| 321 Shappee St | 0.09mi | 3/1.0 | 1,044 (-9%) | 8mo | $155,000 | $148 | 74 |
| 133 Berkley Ln | 0.28mi | 3/1.0 | 1,209 (+5%) | 10mo | $192,000 | $159 | 69 |
| 106 Matthews Cir | 0.26mi | 3/1.0 | 1,032 (-10%) | 6mo | $156,914 | $152 | 66 |
| 313 Gardner Rd | 0.59mi | 3/1.0 | 1,175 (+2%) | 10mo | $185,000 | $157 | 60 |
| 415 Gardner Rd | 0.42mi | 2/1.0 (-1) | 1,248 (+9%) | 5mo | $65,550 | $53 | 57 |
| 137 Matthew Cir | 0.38mi | 3/1.0 | 1,009 (-12%) | 8mo | $146,264 | $145 | 55 |
| 209 Winding Way | 0.34mi | 3/1.0 | 1,000 (-13%) | 11mo | $157,000 | $157 | 53 |
| 302 Gardner Rd | 0.64mi | 3/1.0 | 1,289 (+12%) | 0mo | $179,900 | $140 | 50 |
| 218 Lynhurst Ave | 0.52mi | 4/2.0 (+1) | 1,289 (+12%) | 4mo | $122,000 | $95 | 43 |
| 1069 W Broad St | 0.68mi | 3/2.0 | 1,040 (-9%) | 11mo | $212,500 | $204 | 39 |
Match score weights: distance 35% · size 25% · config 20% · recency 20%. Top-matched comps best support the ARV.
Projected returns pro-forma
-3.0% appreciation · 3.0% rent growth · sell at horizon
- IRR
- -17.9%
- Equity multiple
- 0.37×
- Total profit
- $-24,756
- Equity at exit
- $20,874
- IRR
- -9.9%
- Equity multiple
- 0.39×
- Total profit
- $-23,798
- Equity at exit
- $12,105
Cash invested: $39,200 (down + closing). Projections, not guarantees.
Landlord ↔ Tenant lean methodology
- Overall (STATE)
- 15 Strongly Tenant-Friendly
- State New York
- 15 Strongly Tenant-Friendly · D+10
- County
- — inherits STATE
- City
- — inherits STATE
ZIP-level market 14845
- Home prices YoY
- -24.9%
- Active inventory
- 92
- Price-to-rent
- 8.0×
Monthly cashflow live
- Estimated rent
- $1,450 medium interval (Pro) →
- Mortgage (P&I)
- −$734
- Tax from tax record
- −$388 /mo · $4,655/yr
- Insurance
- −$58
- HOA
- −$0
- Vacancy / Maint / Mgmt
- −$304
- Net cashflow
- $-35
Break-even live
UW: 25.0% down · 7.5% · 30yr · 1.5% tax · 5.0% vac · 8.0% maint · 8.0% mgmt
Financing live
Cash to close
- Down payment
- $35,000
- Closing costs
- $4,200
- Reserves months
- —
- Total cash needed
- —
Loan-product check · same deal, 3 products live
Conventional
25% down · 7.5% · 30yr
- Down + closing
- —
- Monthly P&I
- —
- Monthly cashflow
- —
- DSCR
- —
- Eligible?
- —
Personal DTI + credit; lowest rate.
DSCR
20% down · 8.5% · 30yr
- Down + closing
- —
- Monthly P&I
- —
- Monthly cashflow
- —
- DSCR
- —
- Eligible?
- —
No personal income docs; deal must DSCR.
Hard money
10% down · 12.0% · 12mo
- Down + closing
- —
- Monthly P&I
- —
- Monthly cashflow
- —
- DSCR
- —
- Eligible?
- —
Short-term bridge; refi at stabilization.
Rent comps 1 comps
| Address | Beds | Baths | Sqft | Rent | $/sqft | DOM | Units | Dist |
|---|---|---|---|---|---|---|---|---|
| 112 S Main St Horseheads, NY | 2.0 | 1.0 | 1000 | $1,450 | $1.45 | 43d | 1 | 1.21mi |
Listing history 10 events
-
2026-03-30status Pending
-
2025-12-12historical Active Under Contract
-
2025-12-04$140,000 Active
-
2007-03-06soldstatus $54,100
-
2007-03-05soldstatus $54,100 214-char remark
Show marketing remark (214 chars)
BANK OWNED AND A GREAT OPPORTUNITY TO OWN INSTEAD OF RENTING. NEEDS TLC BUT PRICED BELOW ASSESSMENT. 3 BEDROOM, 1 BATH, UNHEATED ROOM AND EXTRA LONG GARAGE. SEE AGENT NOTES FOR OFFER INFO AND SHOWINGS INSTRUCTIONS.
-
2006-10-02$54,100 214-char remark
Show marketing remark (214 chars)
BANK OWNED AND A GREAT OPPORTUNITY TO OWN INSTEAD OF RENTING. NEEDS TLC BUT PRICED BELOW ASSESSMENT. 3 BEDROOM, 1 BATH, UNHEATED ROOM AND EXTRA LONG GARAGE. SEE AGENT NOTES FOR OFFER INFO AND SHOWINGS INSTRUCTIONS.
-
2006-07-18soldstatus $42,500
-
2003-02-05soldstatus $62,000
-
2003-01-24soldstatus $62,000 75-char remark
Show marketing remark (75 chars)
FENCED REAR YARD, TANDEM 2 CAR GARAGE, ENCLOSED PA TIO & CENTRAL AIR.
-
2002-06-14$59,900 75-char remark
Show marketing remark (75 chars)
FENCED REAR YARD, TANDEM 2 CAR GARAGE, ENCLOSED PA TIO & CENTRAL AIR.
ⓘ Source: listings_history table (triggers on properties + properties_extension) + one-shot
backfill from property_details.listing_events for pre-trigger history.
Tax reassessment forecast NY · Partial reset (capped growth)
- Current annual tax
- $4,655 · $388/mo
- Projected year-2 tax
- $4,655 · $388/mo
- Expected delta
- $0/yr ($0/mo · 0.0%)
ⓘ Screening estimate from a state-policy table — verify with the county assessor before closing.
Climate risk First Street
- Flood 1/10 Low FEMA zone X (shaded) · 0% chance over 30 yrs
- Wildfire 1/10 Low
- Heat 3/10 Moderate 8 d/yr ≥96°F today · 17 d/yr by 30 yrs out
- Wind 1/10 Low 100% chance of damaging wind over 30 yrs
- Air quality 2/10 Low 0 unhealthy d/yr today · 1 by 30 yrs out
Nearby sold comps map
Loading sold comps map…
Walkable amenities ~0.75 mi
Loading nearby amenities…
Taxation est. · year 1
- Rental income
- $17,400
- − Mortgage interest
- −$7,842
- − Property taxes
- −$4,655
- − Insurance
- −$700
- − Repairs & maintenance
- −$1,392
- − Management
- −$1,392
- − Depreciation
- −$4,073
- Taxable loss
- −$2,653
- Est. tax savings @ 24.0%
- +$637
- After-tax cash flow
- $218/yr
For passive investors: Depreciation is non-cash, so a rental often shows a tax loss while cash-flowing — sheltering income. Rental losses are passive: they offset passive income freely, and up to $25,000/yr can offset ordinary (W-2) income if you actively participate and your MAGI is under $100k (phasing out to $0 by $150k); unused losses carry forward. On sale, claimed depreciation is recaptured at up to 25%, and gains may owe capital-gains tax (a 1031 exchange can defer both). Figures are a year-1 estimate at your 24.0% rate — not tax advice; consult a CPA.
Schools (NCES district)
- District
- Horseheads Central School District
- NCES district ID
- 3614850
- Math proficiency
- 44% ▼ -19.00%
- Reading proficiency
- 58% ▲ 3.00%
- Median HH income
- $60,594
- Composite
- 44.58/100
- National rank
- #2781
- State rank
- #347 of 590 in NY
Livability — Horseheads
- Score
- 69/100
- State rank
- #494
- US rank
- #8689
Category grades
Schools grade is shown separately in the Schools card above.
Census & demographics
- Census place
- Horseheads, NY
- Population (ZIP)
- 20,552
Population outlook (Chemung County) Hauer SSP2
- Today (2025)
- 82,931 people
- By 2030
- 80,356 · -3.1%
- By 2040
- 74,745 · -9.9%
- By 2050
- 69,012 · -16.8%
- By 2075
- 55,689 · -32.8%
- By 2100
- 41,428 · -50.0%
Race, ethnicity, and origin ACS 2023
- Neighborhood character
- Predominantly White (90%)
- Race & ethnicity
- White 90% Two or more races 5% Asian 2% Hispanic / Latino 2% Black 2%
- Common ancestry
- Romanian 6% Slovak 2% Iranian 2%
- Foreign-born
- 6% · Canada, China, South Korea
- Languages at home
- 94% English-only · Spanish 2% Other Asian/Pacific 1% Other Indo-European 1%
Political lean MEDSL · Chemung
- 2024 margin
- R (+16.8) · D 41.6% · R 58.4%
- 2008→2024 swing
- -15.6pp toward R · 2008: -1.2pp · 2024: -16.8pp
- All cycles
- 2024: R+16.8 2020: R+13.4 2016: R+20.0 2012: R+2.9 2008: R+1.2
Not yet ingested
- Civics
- —
Market trends
- HPI YoY
- ▼ -82.23%
- Current HPI
- 247.777
- Rent YoY
- —
- Metro
- —
- State GDP YoY
- ▲ 2.60%
- F500 in state
- 92
Industry mix (Fortune 500 HQ in NY)
| Industry | F500 HQs | Revenue |
|---|---|---|
| Financial Services | 10 | $950B |
|
||
| Consumer Goods | 9 | $162B |
|
||
| Insurance | 4 | $225B |
|
||
| Telecommunications | 2 | $144B |
|
||
| Pharmaceuticals | 2 | $112B |
|
||
| Media / Entertainment | 2 | $69B |
|
||
Price history
+133.7% since first listed10 events — show timeline
- 2026-03-30 Pending — UNYREIS
- 2025-12-12 Contingent — UNYREIS
- 2025-12-04 Listed $140,000 UNYREIS
- 2007-03-06 Sold (Public Records) $54,100 Public Records
- 2007-03-05 Sold (MLS) $54,100 UNYREIS
- 2006-10-02 Listed $54,100 UNYREIS
- 2006-07-18 Sold (Public Records) $42,500 Public Records
- 2003-02-05 Sold (Public Records) $62,000 Public Records
- 2003-01-24 Sold (MLS) $62,000 UNYREIS
- 2002-06-14 Listed $59,900 UNYREIS
Property tax history
+5.4%/yrLatest (2025): $4,655 · +4.1% YoY. Source: county tax records.
Cash-flow waterfall
monthlySold comps — $/sqft
last 12 mo · ≤1 miLoading sold comps…