 🏷️ Likely Rental
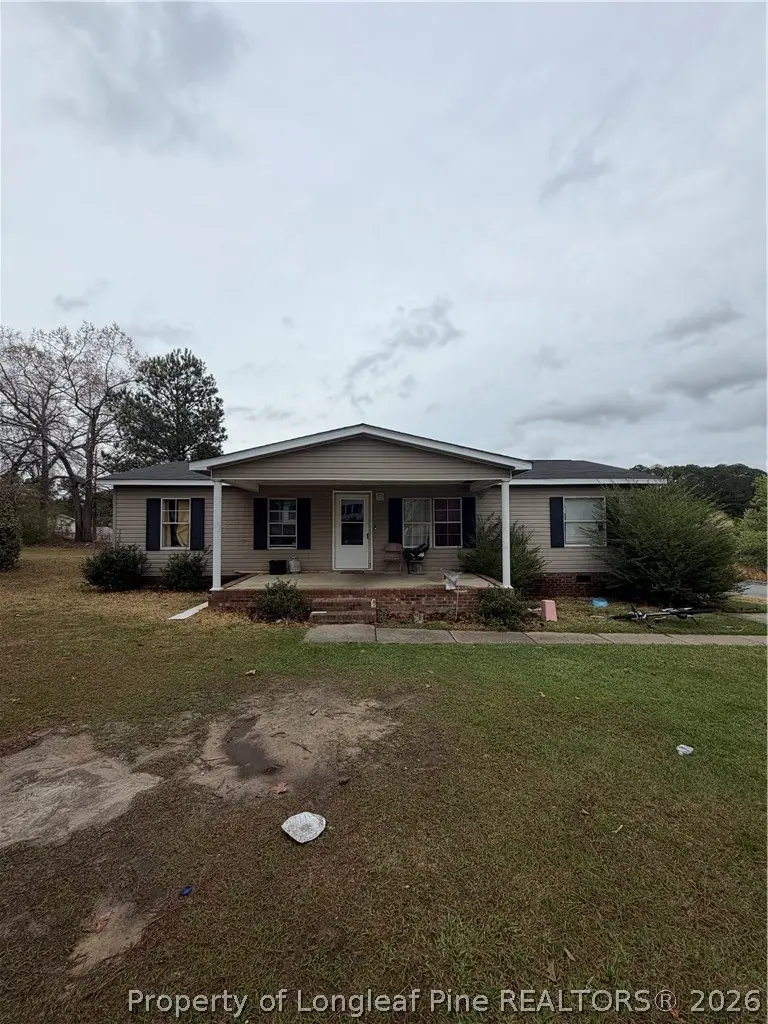
14 Tryon Ct W · Anderson Creek, NC
Flood risk 1/10 · Minimal
- FEMA flood zone
- X (unshaded)
- Chance of flooding over 30 yrs
- 0.0%
- Est. flood insurance / yr
- $507 – $1,088
Fire risk 6/10 · Moderate
- Est. fire insurance / yr
- $906 – $1,684
Heat risk 7/10 · Major
- Hot days now (above 106°F)
- 7 days/yr
- Hot days in 30 yrs
- 16 days/yr
Wind risk 6/10 · Moderate
- Chance of severe wind over 30 yrs
- 68.0%
Air-quality risk 2/10 · Minimal
- Unhealthy air days now
- 0 days/yr
- Unhealthy air days in 30 yrs
- 1 days/yr
Risk factors via First Street. Map © Google.
Why this score? — see what drove the B- grade
The composite is a weighted blend of 9 inputs, each scored 0–100. Each bar is that input's sub-score; the figure is the points it added to the 100-point composite (weight × sub-score).
- Cash flow +30.0/30.0
- 1% rule +10.0/10.0
- DSCR +10.0/10.0
- ARV discount +7.5/15.0
- Rent growth +3.6/5.0
- Schools +3.0/10.0
- Livability +2.5/5.0
- Condition / age +2.5/5.0
- Appreciation +0.0/10.0
$85,000
🖨 Deal sheet 📄 Offer letter ✓ Due diligence
Listing remarks
Investor Special in Raeford! This 3-bedroom, 2-bath manufactured home offers great potential in a desirable neighborhood just minutes from Ft. Bragg. Featuring a covered front porch perfect for relaxing, this property is an excellent opportunity for a savvy investor looking for their next fix-and-flip or buy-and-hold rental. Great large corner lot and area is growing rapidly. The home will need some repairs and updates, but with the right vision, it can truly shine. Currently tenant-occupied, offering immediate rental income potential for investors looking to expand their portfolio. Per the seller roof is newer (2019) and the HVAC age is unknown. Conveniently located near shopping, dining,
Key facts
- Covered front porch
- Large corner lot
- Newer roof
Tags
Neighborhood map
What this means for you Summary
Snapshot
- This is a 3-bed/2.0-bath manufactured listed at $85k.
Deal economics
- At list price, monthly cash flow is $662 ($8k/yr) — positive.
- The deal already cash-flows at list — no discount required.
- Meets the 1% rule at list price ($2k rent vs $85k).
- Cap rate 15.6% vs local median 3.5% in Anderson Creek — top-decile yield for the area; either an underpriced asset or a hidden risk that comps aren't pricing in. Stress-test before assuming the spread holds.
Location & tenants
- Location reads: area grade B — affects rentability + tenant quality, not the cash-flow math above.
- Harnett County Schools (rural): math 31% / reading 39% proficiency, ranked #130 of 178 in NC (top 73%) — families likely to look elsewhere, expect single-tenant / working-renter base with shorter leases.
- Zoned schools: Overhills Middle (math 29% / reading 40%, grade F, #292 of 475 statewide, top 62%, 799 students, 61% FRL); Overhills High (math 52% / reading 63%, grade C, #245 of 535 statewide, top 46%, 1,971 students, 47% FRL) — zoned schools at 54% FRL track the district average.
- Market conditions: Rents rising fast (+4.5%/yr); 348 active listings in the ZIP; 7 comparable units currently listed for rent nearby; rentals at typical pace (median 23d on market — plan ~3-4 weeks tenant-placement turnaround); 2,080 units permitted in Harnett County in 2024 (12 in 5+ unit buildings).
Forward outlook
- Local home prices are declining (-3.0%/yr); year-one equity from $588 of loan paydown is wiped out by about $3k of value loss. Plan a longer hold.
- Harnett County population projected at +42% by 2050 — long-run rental-demand tailwind backs the buy-and-hold thesis.
- At projected returns (-3.0% appreciation + 4.5% rent growth), your $24k cash investment doubles in ~4 years — after that, you're playing with house money.
Negotiation context
- Only 10 days on market — expect competitive offers; lowballing is unlikely to land.
Risks & watch-outs
- Climate carrying-cost: major wind risk, 68% chance of damaging wind over 30y; major wildfire risk; extreme-heat days projected 7→16/yr by 2055 (HVAC capex compounding) — expect insurance premiums to compound above CPI over the hold.
Questions for the listing agent
- Is there a deadline driving the sale (1031 exchange, divorce, estate, relocation)? That informs how much negotiation room exists.
- What's the average days-on-market for RENTAL listings here right now (not sales)? A rising rental-DOM trend means longer vacancies and softer asking-rent achievability than the comps imply.
- What's the recent tenant-quality profile in this submarket — average credit score on applications, eviction rate, late-payment / NSF rate, and stable-employment percentage? A property-management company in the area should have these aggregated.
- How much new for-sale + rental construction is in the pipeline within 1–3 miles? Heavy new supply typically softens prices + rents 12–24 months out; constrained supply supports both.
Investment metrics
- 1% rule
- 1.77% ✓
- Cap rate
- 15.65%
- Cash-on-cash
- 33.40%
- DSCR
- 2.49
- GRM
- 4.7
CMA / ARV
- ARV (on-the-fly)
- $176,256
- Comps found
- 12
Show comp detail 12 sales within ~0.75 mi
| Address | Dist | Beds/Ba | Sqft | Sold | Price | $/sf | Match |
|---|---|---|---|---|---|---|---|
| 384 Jamestown Dr | 0.08mi | 3/2.0 | 1,337 (+3%) | 2mo | $159,000 | $119 | 89 |
| 43 W Tryon Ct Ct | 0.05mi | 3/2.0 | 1,336 (+3%) | 18mo | $189,000 | $141 | 78 |
| 21 Plymouth Ct | 0.15mi | 3/2.0 | 1,250 (-4%) | 12mo | $170,000 | $136 | 77 |
| 282 Old Salem Dr | 0.14mi | 3/2.0 | 1,355 (+5%) | 14mo | $196,000 | $145 | 74 |
| 128 Londontown Dr | 0.15mi | 3/2.0 | 1,386 (+7%) | 12mo | $137,050 | $99 | 72 |
| 504 Jamestown Dr | 0.17mi | 3/2.0 | 1,248 (-4%) | 18mo | $156,100 | $125 | 71 |
| 43 Columbus Cts | 0.26mi | 3/2.0 | 1,223 (-6%) | 10mo | $169,900 | $139 | 70 |
| 357 Jamestown Dr | 0.07mi | 3/2.0 | 1,193 (-8%) | 18mo | $155,000 | $130 | 68 |
| 44 Plymouth Ct | 0.19mi | 3/2.0 | 1,150 (-11%) | 7mo | $135,000 | $117 | 67 |
| 170 Woodbridge Dr | 0.21mi | 3/2.0 | 1,214 (-6%) | 17mo | $159,500 | $131 | 65 |
| 54 Tryon Ct W | 0.05mi | 3/2.0 | 1,120 (-14%) | 17mo | $165,000 | $147 | 61 |
| 26 Londontown Dr | 0.11mi | 3/2.0 | 1,123 (-13%) | 17mo | $158,000 | $141 | 59 |
Match score weights: distance 35% · size 25% · config 20% · recency 20%. Top-matched comps best support the ARV.
Projected returns pro-forma
-3.0% appreciation · 4.49% rent growth · sell at horizon
- IRR
- 30.2%
- Equity multiple
- 2.29×
- Total profit
- $30,691
- Equity at exit
- $12,674
- IRR
- 38.3%
- Equity multiple
- 4.81×
- Total profit
- $90,663
- Equity at exit
- $7,349
Cash invested: $23,800 (down + closing). Projections, not guarantees.
Landlord ↔ Tenant lean methodology
- Overall (STATE)
- 85 Strongly Landlord-Friendly
- State North Carolina
- 85 Strongly Landlord-Friendly · R+3
- County
- — inherits STATE
- City
- — inherits STATE
ZIP-level market 28390
- Home prices YoY
- -15.2%
- Rents YoY
- 4.5%
- Active inventory
- 348
- Price-to-rent
- 4.7×
Monthly cashflow live
- Estimated rent
- $1,503 high interval (Pro) →
- Mortgage (P&I)
- −$446
- Tax from tax record
- −$44 /mo · $522/yr
- Insurance
- −$35
- HOA
- −$0
- Vacancy / Maint / Mgmt
- −$316
- Net cashflow
- $662
Break-even live
UW: 25.0% down · 7.5% · 30yr · 1.5% tax · 5.0% vac · 8.0% maint · 8.0% mgmt
Financing live
Cash to close
- Down payment
- $21,250
- Closing costs
- $2,550
- Reserves months
- —
- Total cash needed
- —
Loan-product check · same deal, 3 products live
Conventional
25% down · 7.5% · 30yr
- Down + closing
- —
- Monthly P&I
- —
- Monthly cashflow
- —
- DSCR
- —
- Eligible?
- —
Personal DTI + credit; lowest rate.
DSCR
20% down · 8.5% · 30yr
- Down + closing
- —
- Monthly P&I
- —
- Monthly cashflow
- —
- DSCR
- —
- Eligible?
- —
No personal income docs; deal must DSCR.
Hard money
10% down · 12.0% · 12mo
- Down + closing
- —
- Monthly P&I
- —
- Monthly cashflow
- —
- DSCR
- —
- Eligible?
- —
Short-term bridge; refi at stabilization.
Rent comps 7 comps
| Address | Beds | Baths | Sqft | Rent | $/sqft | DOM | Units | Dist |
|---|---|---|---|---|---|---|---|---|
| 54 Tryon Ct W Spring Lake, NC | 3.0 | 2.0 | 1101 | $1,400 | $1.27 | 23d | 1 | 0.07mi |
| 16B Wedgewood Dr Spring Lake, NC | 2.0 | 1.0–1.5 | 904 | $1,120 | $1.24 | 23d | 15 | 0.39mi |
| 65 W Northpoint Rd Spring Lake, NC | 2.0 | 2.0 | 905 | $1,197 | $1.32 | 13d | 2 | 0.53mi |
| 201 W Northpoint Rd Spring Lake, NC | 2.0 | 2.0 | 920 | $1,197 | $1.30 | 23d | 1 | 0.66mi |
| 290 W Northpoint Rd Spring Lake, NC | 2.0 | 2.0 | 905 | $1,197 | $1.32 | 23d | 1 | 0.76mi |
| 38 Hallmark Dr Spring Lake, NC | 3.0 | 2.0 | 1340 | $1,800 | $1.34 | 13d | 1 | 0.85mi |
| 301 River Oak St Spring Lake, NC | 4.0 | 2.5 | 1859 | $1,850 | $1.00 | 23d | 1 | 1.26mi |
Listing history 8 events
-
2026-06-14status $85,000 Pending 10 DOM
-
2026-06-10days on market $85,000 Active 10 DOM
-
2026-06-09days on market $85,000 Active 9 DOM
-
2026-06-08days on market $85,000 Active 8 DOM
-
2026-06-07days on market $85,000 Active 7 DOM
-
2026-06-05status $85,000 Active 4 DOM
-
2026-04-04status Pending
-
2026-03-26$85,000 Active
ⓘ Source: listings_history table (triggers on properties + properties_extension) + one-shot
backfill from property_details.listing_events for pre-trigger history.
Tax reassessment forecast NC · Resets to sale price
- Current annual tax
- $522 · $44/mo
- Projected year-2 tax
- $697 · $58/mo
- Expected delta
- +$175/yr (+$15/mo · 33.5%)
ⓘ Screening estimate from a state-policy table — verify with the county assessor before closing.
Climate risk First Street
- Flood 1/10 Low FEMA zone X (unshaded) · 0% chance over 30 yrs
- Wildfire 6/10 Major
- Heat 7/10 Severe 7 d/yr ≥106°F today · 16 d/yr by 30 yrs out
- Wind 6/10 Major 68% chance of damaging wind over 30 yrs
- Air quality 2/10 Low 0 unhealthy d/yr today · 1 by 30 yrs out
Nearby sold comps map
Loading sold comps map…
Walkable amenities ~0.75 mi
Loading nearby amenities…
Taxation est. · year 1
- Rental income
- $18,033
- − Mortgage interest
- −$4,761
- − Property taxes
- −$522
- − Insurance
- −$425
- − Repairs & maintenance
- −$1,443
- − Management
- −$1,443
- − Depreciation
- −$2,473
- Taxable income
- $6,966
- Est. tax owed @ 24.0%
- −$1,672
- After-tax cash flow
- $6,278/yr
For passive investors: Depreciation is non-cash, so a rental often shows a tax loss while cash-flowing — sheltering income. Rental losses are passive: they offset passive income freely, and up to $25,000/yr can offset ordinary (W-2) income if you actively participate and your MAGI is under $100k (phasing out to $0 by $150k); unused losses carry forward. On sale, claimed depreciation is recaptured at up to 25%, and gains may owe capital-gains tax (a 1031 exchange can defer both). Figures are a year-1 estimate at your 24.0% rate — not tax advice; consult a CPA.
Schools (NCES district)
- District
- Harnett County Schools
- NCES district ID
- 3702010
- Math proficiency
- 31% ▼ -2.00%
- Reading proficiency
- 39% ▼ -1.00%
- Median HH income
- $45,400
- Composite
- 29.88/100
- National rank
- #6397
- State rank
- #130 of 178 in NC
Livability — Anderson Creek
No livability data for this city. (Only ~50 U.S. cities are tracked.)
Census & demographics
- Census place
- Anderson Creek, NC
- County
- Harnett County · 125,715 people
- City population
- 24,158
- Metro
- Fayetteville, NC
- Population (ZIP)
- 24,000
- Household income
- $62,972
- Rent vs Own
- Severe rent burden
- 811.0
Population outlook (Harnett County) Hauer SSP2
- Today (2025)
- 153,758 people
- By 2030
- 166,581 · +8.3%
- By 2040
- 192,741 · +25.4%
- By 2050
- 218,332 · +42.0%
- By 2075
- 275,422 · +79.1%
- By 2100
- 313,511 · +103.9%
Race, ethnicity, and origin ACS 2023
- Neighborhood character
- Diverse neighborhood (Simpson 0.70)
- Race & ethnicity
- White 41% Black 33% Hispanic / Latino 14% Two or more races 12% Asian 2% Native American 1%
- Hispanic origin (detail)
- Mexican 6% Puerto Rican 4%
- Common ancestry
- Italian 1% Slovak 1% Romanian 1%
- Foreign-born
- 7% · Canada, South Korea, Jamaica
- Languages at home
- 88% English-only · Spanish 8% German/W. Germanic 1% Korean 1%
Political lean MEDSL · Harnett
- 2024 margin
- Strong R (+25.1) · D 36.9% · R 62.0% · Other 1.1%
- 2008→2024 swing
- -8.4pp toward R · 2008: -16.7pp · 2024: -25.1pp
- All cycles
- 2024: R+25.1 2020: R+22.4 2016: R+24.1 2012: R+19.4 2008: R+16.7
Not yet ingested
- Civics
- —
Market trends
- HPI YoY
- ▼ -37.43%
- Current HPI
- 207.9349
- Rent YoY
- ▲ 4.49%
- Metro
- Fayetteville, NC
- State GDP YoY
- ▲ 3.28%
- F500 in state
- 26
Industry mix (Fortune 500 HQ in NC)
| Industry | F500 HQs | Revenue |
|---|---|---|
| Financial Services | 2 | $213B |
|
||
| Retail | 2 | $95B |
|
||
| Industrial Conglomerate | 1 | $38B |
|
||
| Metals / Steel | 1 | $35B |
|
||
| Utilities | 1 | $30B |
|
||
| Industrial Machinery | 1 | $19B |
|
||
Price history
2 events — show timeline
- 2026-04-04 Pending — LPRMLS
- 2026-03-26 Listed $85,000 LPRMLS
Property tax history
-1.3%/yrLatest (2025): $522 · +0.0% YoY. Source: county tax records.
Cash-flow waterfall
monthlySold comps — $/sqft
last 12 mo · ≤1 miLoading sold comps…