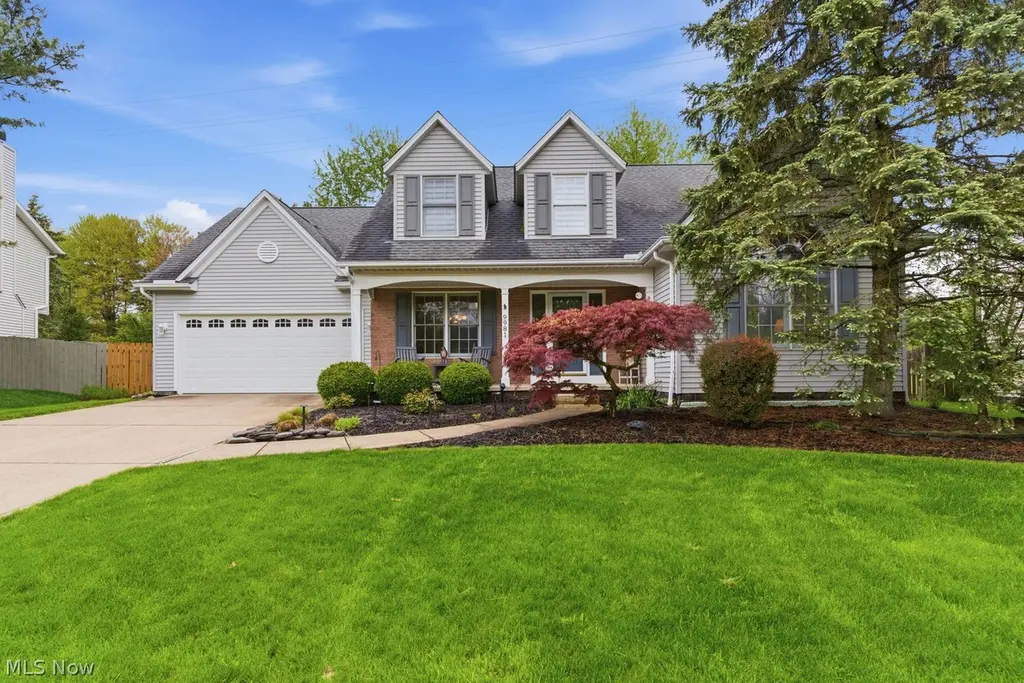
9981 Woodhurst Dr · Strongsville, OH
Flood risk 1/10 · Minimal
- FEMA flood zone
- X (unshaded)
- Chance of flooding over 30 yrs
- 0.0%
- Est. flood insurance / yr
- $473 – $860
Fire risk 1/10 · Minimal
- Est. fire insurance / yr
- $713 – $1,323
Heat risk 3/10 · Minor
- Hot days now (above 96°F)
- 7 days/yr
- Hot days in 30 yrs
- 16 days/yr
Wind risk 1/10 · Minimal
- Chance of severe wind over 30 yrs
- —
Air-quality risk 2/10 · Minimal
- Unhealthy air days now
- 1 days/yr
- Unhealthy air days in 30 yrs
- 2 days/yr
Risk factors via First Street. Map © Google.
Why this score? — see what drove the F grade
The composite is a weighted blend of 9 inputs, each scored 0–100. Each bar is that input's sub-score; the figure is the points it added to the 100-point composite (weight × sub-score).
- Schools +6.7/10.0
- Cash flow +6.0/30.0
- Livability +4.4/5.0
- Rent growth +2.5/5.0
- Condition / age +2.5/5.0
- 1% rule +1.1/10.0
- DSCR +0.3/10.0
- ARV discount +0.3/15.0
- Appreciation +0.0/10.0
$420,000
🖨 Deal sheet 📄 Offer letter ✓ Due diligence
Listing remarks MLS
Love At First Sight! Fantastic Curb Appeal W/ Fabulous Landscaping. Step Inside To An Open Floor Plan. Lovingly Cared For & Decorated In Fashion Colors. Be Sure To See Medallion Ceiling In Din Rm, Architectural Details In 2 Story Foyer & Spectacular Great Rm -- The Heart Of This Very Special Home.
Key facts
- Custom cabinetry
- Quartz counters
- Open floorplan
Tags
Neighborhood map
What this means for you Summary
Snapshot
- This is a 3-bed/2.5-bath single-family listed at $420k.
Deal economics
- At list price, monthly cash flow is $-804 ($-10k/yr) — negative.
- To cash-flow at today's rent, offer at most $278k (33.8% below list).
- To meet the 1% rule (rent ≥ 1% of price), the offer needs to be $255k (39.2% below list).
- Recommended offer: $255k (39.2% below list) — sets the bar for 1% rule.
- Cap rate 4.0% vs local median 3.2% in Strongsville — meaningfully above typical; check what's discounted (condition, days-on-market, listing class) to confirm the premium yield is real.
Location & tenants
- Location reads 88/100 on livability (#27 in OH, #243 nationally) — a professional / high-income tenant draw. Strengths: schools A+, crime A+, amenities A+; Watch: commute F.
- Strongsville City (suburban): math 73% / reading 79% proficiency, ranked #62 of 656 in OH (top 10%) — strong family-tenant draw, lease renewals of 3-5y typical; only 15% free/reduced lunch — higher-income household profile.
- Market conditions: 116 active listings in the ZIP; 6 comparable units currently listed for rent nearby; rentals leasing fast (median 8d on market — plan ~1-2 weeks tenant-placement turnaround); high-income renter base; 1,441 units permitted in Cuyahoga County in 2024 (700 in 5+ unit buildings).
Forward outlook
- Local home prices are declining (-3.0%/yr); year-one equity from $3k of loan paydown is wiped out by about $13k of value loss. Plan a longer hold.
- Cuyahoga County population projected to shrink 8% by 2050 — rents likely to lag national; underwrite the cash flow, not the appreciation.
Negotiation context
- Only 8 days on market — expect competitive offers; lowballing is unlikely to land.
- 3 sale attempts since 28y ago with the ask held roughly flat each time — persistent listings suggest the price (not the market) is what's stuck; bring a comps-based counter.
- Current owner paid $221k; list at $420k implies a 90% gain — meaningful room to come down on a strong offer.
Questions for the listing agent
- What do current leases actually rent for vs. the listed asking? Can we see a recent rent roll and the last 12 months of T-12 income?
- Is there a deadline driving the sale (1031 exchange, divorce, estate, relocation)? That informs how much negotiation room exists.
- Schools are A-rated — typically a magnet for longer-tenancy family renters. What's the average tenant stay here, and is there a school-zone premium baked into asking?
- The area grade is low — what's the realistic commute time and amenity access for the typical tenant pool here? Any planned neighborhood developments (good or bad) we should know about?
- What's the average days-on-market for RENTAL listings here right now (not sales)? A rising rental-DOM trend means longer vacancies and softer asking-rent achievability than the comps imply.
- What's the recent tenant-quality profile in this submarket — average credit score on applications, eviction rate, late-payment / NSF rate, and stable-employment percentage? A property-management company in the area should have these aggregated.
- How much new for-sale + rental construction is in the pipeline within 1–3 miles? Heavy new supply typically softens prices + rents 12–24 months out; constrained supply supports both.
Investment metrics
- 1% rule
- 0.61% ✗
- Cap rate
- 4.00%
- Cash-on-cash
- -8.20%
- DSCR
- 0.63
- GRM
- 13.7
CMA / ARV
- ARV (median comp)
- $361,894
- List price
- $420,000
- Delta
- 16.06%
- Verdict
- OVERPRICED
- Comps
- 20 within 1.0 mi
Show comp detail 12 sales within ~0.75 mi
| Address | Dist | Beds/Ba | Sqft | Sold | Price | $/sf | Match |
|---|---|---|---|---|---|---|---|
| 10020 Fair Rd | 0.07mi | 3/2.5 | 2,104 (+5%) | 4mo | $417,000 | $198 | 85 |
| 19825 Deer Run Ln | 0.41mi | 3/2.5 | 1,878 (-6%) | 2mo | $435,000 | $232 | 69 |
| 10024 Fair Rd | 0.07mi | 3/2.0 | 2,276 (+14%) | 8mo | $399,000 | $175 | 65 |
| 19654 Tanbark Ln | 0.33mi | 3/2.5 | 1,828 (-9%) | 11mo | $360,000 | $197 | 61 |
| 21292 Creekside Dr | 0.66mi | 3/2.5 | 2,124 (+6%) | 8mo | $385,000 | $181 | 52 |
| 9753 Prospect Rd | 0.46mi | 3/2.0 | 1,704 (-15%) | 0mo | $430,000 | $252 | 52 |
| 19338 Idlewood Trl | 0.69mi | 3/2.0 | 2,166 (+8%) | 1mo | $330,000 | $152 | 51 |
| 11179 Fawn Meadow Ln | 0.59mi | 3/2.0 | 2,178 (+9%) | 6mo | $405,000 | $186 | 50 |
| 21355 Hickory Branch Trl | 0.75mi | 3/2.0 | 2,170 (+8%) | 6mo | $465,000 | $214 | 44 |
| 11304 Blodgett Creek Trl | 0.56mi | 3/2.0 | 1,735 (-13%) | 10mo | $330,000 | $190 | 42 |
| 11480 Blodgett Creek Trl | 0.63mi | 3/2.5 | 1,759 (-12%) | 12mo | $322,500 | $183 | 40 |
| 20771 Rudy Dr | 0.69mi | 4/2.5 (+1) | 2,280 (+14%) | 2mo | $430,000 | $189 | 38 |
Match score weights: distance 35% · size 25% · config 20% · recency 20%. Top-matched comps best support the ARV.
Projected returns pro-forma
-3.0% appreciation · 3.0% rent growth · sell at horizon
- IRR
- -30.7%
- Equity multiple
- -0.01×
- Total profit
- $-119,272
- Equity at exit
- $62,623
- IRR
- -33.3%
- Equity multiple
- -0.44×
- Total profit
- $-169,839
- Equity at exit
- $36,314
Cash invested: $117,600 (down + closing). Projections, not guarantees.
Landlord ↔ Tenant lean methodology
- Overall (STATE)
- 73 Landlord-Friendly
- State Ohio
- 73 Landlord-Friendly · R+6
- County
- — inherits STATE
- City
- — inherits STATE
ZIP-level market 44149
- Active inventory
- 116
- Price-to-rent
- 13.7×
Monthly cashflow live
- Estimated rent
- $2,553 medium interval (Pro) →
- Mortgage (P&I)
- −$2,203
- Tax from tax record
- −$443 /mo · $5,320/yr
- Insurance
- −$175
- HOA
- −$0
- Vacancy / Maint / Mgmt
- −$536
- Net cashflow
- $-804
Break-even live
UW: 25.0% down · 7.5% · 30yr · 1.5% tax · 5.0% vac · 8.0% maint · 8.0% mgmt
Financing live
Cash to close
- Down payment
- $105,000
- Closing costs
- $12,600
- Reserves months
- —
- Total cash needed
- —
Loan-product check · same deal, 3 products live
Conventional
25% down · 7.5% · 30yr
- Down + closing
- —
- Monthly P&I
- —
- Monthly cashflow
- —
- DSCR
- —
- Eligible?
- —
Personal DTI + credit; lowest rate.
DSCR
20% down · 8.5% · 30yr
- Down + closing
- —
- Monthly P&I
- —
- Monthly cashflow
- —
- DSCR
- —
- Eligible?
- —
No personal income docs; deal must DSCR.
Hard money
10% down · 12.0% · 12mo
- Down + closing
- —
- Monthly P&I
- —
- Monthly cashflow
- —
- DSCR
- —
- Eligible?
- —
Short-term bridge; refi at stabilization.
Rent comps 6 comps
| Address | Beds | Baths | Sqft | Rent | $/sqft | DOM | Units | Dist |
|---|---|---|---|---|---|---|---|---|
| 8040 Strongsville Blvd Unit 1496063P Strongsville, OH | 3.0 | 2.0 | 1980 | $8,055 | $4.07 | 21d | 1 | 1.19mi |
| 22410 Rock Creek Cir Strongsville, OH | 3.0 | 2.0 | 2103 | $2,400 | $1.14 | 1d | 1 | 1.19mi |
| 20368 Westwood Dr Strongsville, OH | 4.0 | 2.0 | 1864 | $2,400 | $1.29 | 3d | 1 | 1.24mi |
| 9790 Pebble Brook Ln Strongsville, OH | 3.0 | 2.0 | 2785 | $2,800 | $1.01 | 19d | 1 | 1.26mi |
| 13187 Yager Dr Strongsville, OH | 4.0 | 1.5 | 1850 | $2,700 | $1.46 | 3d | 1 | 1.41mi |
| 367 S Rocky River Dr Unit 1496132P Berea, OH | 4.0 | 2.0 | 1765 | $5,357 | $3.04 | 7d | 1 | 1.42mi |
Listing history 8 events
-
2026-05-16historical Contingent 1676-char remark
-
2026-05-08$420,000 Active 1676-char remark
-
2005-07-15soldstatus $221,000 310-char remark
Show marketing remark (310 chars)
Love At First Sight! Fantastic Curb Appeal W/ Fabulous Landscaping. Step Inside To An Open Floor Plan. Lovingly Cared For & Decorated In Fashion Colors. Be Sure To See Medallion Ceiling In Din Rm, Architectural Details In 2 Story Foyer & Spectacular Great Rm -- The Heart Of This Very Special Home.
-
2005-07-15soldstatus $221,000
Show marketing remark (310 chars)
Love At First Sight! Fantastic Curb Appeal W/ Fabulous Landscaping. Step Inside To An Open Floor Plan. Lovingly Cared For & Decorated In Fashion Colors. Be Sure To See Medallion Ceiling In Din Rm, Architectural Details In 2 Story Foyer & Spectacular Great Rm -- The Heart Of This Very Special Home.
-
2005-04-30$224,900 310-char remark
Show marketing remark (310 chars)
Love At First Sight! Fantastic Curb Appeal W/ Fabulous Landscaping. Step Inside To An Open Floor Plan. Lovingly Cared For & Decorated In Fashion Colors. Be Sure To See Medallion Ceiling In Din Rm, Architectural Details In 2 Story Foyer & Spectacular Great Rm -- The Heart Of This Very Special Home.
-
1999-09-23historical
-
1998-03-24$169,900
ⓘ Source: listings_history table (triggers on properties + properties_extension) + one-shot
backfill from property_details.listing_events for pre-trigger history.
Tax reassessment forecast OH · Partial reset (capped growth)
- Current annual tax
- $5,320 · $443/mo
- Projected year-2 tax
- $5,936 · $495/mo
- Expected delta
- +$616/yr (+$51/mo · 11.6%)
ⓘ Screening estimate from a state-policy table — verify with the county assessor before closing.
Climate risk First Street
- Flood 1/10 Low FEMA zone X (unshaded) · 0% chance over 30 yrs
- Wildfire 1/10 Low
- Heat 3/10 Moderate 7 d/yr ≥96°F today · 16 d/yr by 30 yrs out
- Wind 1/10 Low
- Air quality 2/10 Low 1 unhealthy d/yr today · 2 by 30 yrs out
Nearby sold comps map
Loading sold comps map…
Walkable amenities ~0.75 mi
Loading nearby amenities…
Taxation est. · year 1
- Rental income
- $30,638
- − Mortgage interest
- −$23,527
- − Property taxes
- −$5,320
- − Insurance
- −$2,100
- − Repairs & maintenance
- −$2,451
- − Management
- −$2,451
- − Depreciation
- −$12,218
- Taxable loss
- −$17,430
- Est. tax savings @ 24.0%
- +$4,183
- After-tax cash flow
- $-5,464/yr
For passive investors: Depreciation is non-cash, so a rental often shows a tax loss while cash-flowing — sheltering income. Rental losses are passive: they offset passive income freely, and up to $25,000/yr can offset ordinary (W-2) income if you actively participate and your MAGI is under $100k (phasing out to $0 by $150k); unused losses carry forward. On sale, claimed depreciation is recaptured at up to 25%, and gains may owe capital-gains tax (a 1031 exchange can defer both). Figures are a year-1 estimate at your 24.0% rate — not tax advice; consult a CPA.
Schools (NCES district)
- District
- Strongsville City
- NCES district ID
- 3904484
- Math proficiency
- 73% ▼ -10.00%
- Reading proficiency
- 79% ▼ -2.00%
- Median HH income
- $78,206
- Composite
- 67.02/100
- National rank
- #395
- State rank
- #62 of 656 in OH
Livability — Strongsville
- Score
- 88/100
- State rank
- #27
- US rank
- #243
Category grades
Schools grade is shown separately in the Schools card above.
Census & demographics
- Census place
- Strongsville, OH
- County
- Cuyahoga · 1,045,444 people
- City population
- 46,110
- Metro
- Cleveland, OH
- Population (ZIP)
- 21,042
- Household income
- $114,107
- Rent vs Own
- Severe rent burden
- 2.7
Population outlook (Cuyahoga County) Hauer SSP2
- Today (2025)
- 1,244,621 people
- By 2030
- 1,230,093 · -1.2%
- By 2040
- 1,189,108 · -4.5%
- By 2050
- 1,145,706 · -7.9%
- By 2075
- 1,076,557 · -13.5%
- By 2100
- 978,987 · -21.3%
Race, ethnicity, and origin ACS 2023
- Neighborhood character
- Predominantly White (91%)
- Race & ethnicity
- White 91% Asian 3% Two or more races 3% Hispanic / Latino 3% Black 1%
- Common ancestry
- Romanian 11% Italian 2% Slovak 2%
- Foreign-born
- 7% · Canada, China
- Languages at home
- 92% English-only · Other Indo-European 2% Arabic 1% Russian/Polish/Slavic 1%
Political lean MEDSL · Cuyahoga
- 2024 margin
- Solid D (+31.5) · D 65.4% · R 33.9%
- 2008→2024 swing
- -7.4pp toward R · 2008: 38.9pp · 2024: 31.5pp
- All cycles
- 2024: D+31.5 2020: D+34.1 2016: D+35.0 2012: D+38.7 2008: D+38.9
Not yet ingested
- Civics
- —
Market trends
- HPI YoY
- ▼ -238.17%
- Current HPI
- 196.9311
- Rent YoY
- —
- Metro
- —
- State GDP YoY
- ▲ 1.98%
- F500 in state
- 48
Industry mix (Fortune 500 HQ in OH)
| Industry | F500 HQs | Revenue |
|---|---|---|
| Insurance | 3 | $145B |
|
||
| Industrial Machinery | 3 | $49B |
|
||
| Financial Services | 3 | $24B |
|
||
| Consumer Goods | 2 | $93B |
|
||
| Aerospace / Defense | 2 | $47B |
|
||
| Utilities | 2 | $33B |
|
||
Price history
+147.2% since first listed9 events — show timeline
- 2026-05-22 Pending — MLSNOW
- 2026-05-16 Contingent — MLSNOW
- 2026-05-08 Listed $420,000 MLSNOW
- 2005-07-15 Sold (Public Records) $221,000 Public Records
- 2005-07-15 Sold (Public Records) $221,000 Public Records
- 2005-07-15 Sold (MLS) $221,000 MLSNOW
- 2005-04-30 Listed $224,900 MLSNOW
- 1999-09-23 Listing Removed — MLSNOW
- 1998-03-24 Listed $169,900 MLSNOW
Property tax history
+1.3%/yrLatest (2025): $5,320 · -0.0% YoY. Source: county tax records.
Cash-flow waterfall
monthlySold comps — $/sqft
last 12 mo · ≤1 miLoading sold comps…