 Duplex
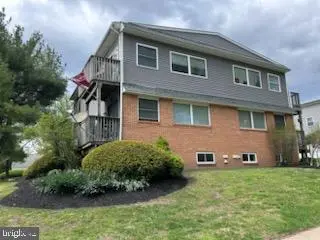
540 Green St · Lansdale, PA
Flood risk 1/10 · Minimal
- FEMA flood zone
- X (unshaded)
- Chance of flooding over 30 yrs
- 0.0%
- Est. flood insurance / yr
- $473 – $860
Fire risk 1/10 · Minimal
- Est. fire insurance / yr
- $511 – $949
Heat risk 5/10 · Moderate
- Hot days now (above 99°F)
- 7 days/yr
- Hot days in 30 yrs
- 15 days/yr
Wind risk 6/10 · Moderate
- Chance of severe wind over 30 yrs
- 27.0%
Air-quality risk 4/10 · Minor
- Unhealthy air days now
- 5 days/yr
- Unhealthy air days in 30 yrs
- 8 days/yr
Risk factors via First Street. Map © Google.
Why this score? — see what drove the D- grade
The composite is a weighted blend of 9 inputs, each scored 0–100. Each bar is that input's sub-score; the figure is the points it added to the 100-point composite (weight × sub-score).
- Cash flow +12.9/30.0
- Schools +5.2/10.0
- Livability +4.5/5.0
- DSCR +3.9/10.0
- 1% rule +3.3/10.0
- Rent growth +3.3/5.0
- Condition / age +2.5/5.0
- ARV discount +0.0/15.0
- Appreciation +0.0/10.0
$474,750
🖨 Deal sheet (PDF) 📄 Offer letter ✓ Due diligence
Multi-family units
County records classify this as Multi-Family (2-4 Unit). Listing-text estimate: 2 units. confirmed
Listing remarks
Very Nice DUPLEX Investment Opportunity In Lansdale Borough; Each Unit Features Living Room, Dining Area, Kitchen With Refrigerator, , 2 Bedrooms And 1 Full Bath And Outside Balcony; Tenants Pay Electric, Heat, Water & Sewer; Landlord Pays Insurance, Landscaping, Snow Removal, Trash & Taxes; This Duplex Is NOT A Conversion, It was Built As A Duplex With Nice Layouts; Off Street Parking At Rear Of Property; Each Unit Has A Private Basement With Alot Of Storage & Washer & Dryer For Each Unit; Walk To Shopping And Various Events In Lansdale Borough.
Key facts
- 7,375 sq ft lot
- 4 parking spots
- Built 1979
Property features AI
Finance
- Other: 2 total residential units; Finished above-grade area approximately 1,800
Exterior
- Parking: Total of 4 garage/parking spaces; Parking lot
- Utilities: Public water; Public sewer; Electric service with circuit breakers; Electric hot water
- Home design: Semi-detached property; 2 stories; Fee simple ownership
- Construction: Brick and vinyl siding exterior; Block foundation; Above-grade and below-grade structures
- Exterior features: Paved driveway; Parking lot with 4 spaces; Lot dimensions approximately 54.00 x 0.00; Property condition rated excellent
Interior
- Kitchen: Kitchen and dining areas are combined
- Bedrooms: Two 2-bedroom units (multifamily)
- Bathrooms: Bathrooms include tub/shower combinations
- Heating & cooling: Central heating (electric); Central air conditioning
- Interior features: Combination kitchen/dining; Tub with shower; Unfinished basement with interior access; 8 total rooms
- Laundry & utility: Basement provides utility space
Neighborhood map
What this means for you Summary
Snapshot
- This is a 2 × 2-bed/1-bath units multifamily listed at $475k.
Deal economics
- At list price, monthly cash flow is $-31 ($-376/yr) — negative. Per door: $-16/mo.
- To cash-flow at today's rent, offer at most $469k (1.2% below list).
- To meet the 1% rule (rent ≥ 1% of price), the offer needs to be $392k (17.4% below list).
- Recommended offer: $392k (17.4% below list) — sets the bar for 1% rule.
- Cap rate 6.2% vs local median 3.4% in Lansdale — top-decile yield for the area; either an underpriced asset or a hidden risk that comps aren't pricing in. Stress-test before assuming the spread holds.
Location & tenants
- Location reads 89/100 on livability (#31 in PA, #170 nationally) — a professional / high-income tenant draw. Strengths: crime A+, commute A+, housing A+.
- North Penn SD (suburban): math 48% / reading 67% proficiency, ranked #76 of 539 in PA (top 14%) — acceptable for families but not a draw, mixed tenant base, ~2y average lease; only 20% free/reduced lunch — higher-income household profile.
- Zoned schools: York Avenue El Sch (math 42% / reading 67%, grade C, #504 of 1,518 statewide, top 37%, 283 students, 42% FRL); Penndale Ms (math 32% / reading 63%, grade C-, #156 of 512 statewide, top 32%, 1,208 students, 43% FRL); North Penn Shs (math 78% / reading 50%, grade B-, #67 of 437 statewide, top 15%, 3,184 students, 34% FRL) — zoned schools average 40% FRL vs 20% district-wide (20 pts higher); higher-poverty schools than district average — tighter screening recommended.
- Market conditions: Rents rising (+3.1%/yr); 190 active listings in the ZIP; 9 comparable units currently listed for rent nearby; rentals leasing fast (median 4d on market — plan ~1-2 weeks tenant-placement turnaround); solid renter incomes; 1,936 units permitted in Montgomery County in 2024 (530 in 5+ unit buildings).
- This rent runs 44% of the median local income ($106k/yr) — at the standard rent-burdened threshold; future hikes will face affordability resistance.
Forward outlook
- Local home prices are declining (-3.0%/yr); year-one equity from $3k of loan paydown is wiped out by about $14k of value loss. Plan a longer hold.
- Montgomery County population projected at +5% by 2050 — modest demand growth; plan on rents tracking national, not racing it.
Negotiation context
- Only 4 days on market — expect competitive offers; lowballing is unlikely to land.
- Current owner paid $80k; list at $475k implies a 494% gain — meaningful room to come down on a strong offer.
Risks & watch-outs
- Climate carrying-cost: major wind risk, 27% chance of damaging wind over 30y; extreme-heat days projected 7→15/yr by 2055 (HVAC capex compounding) — expect insurance premiums to compound above CPI over the hold.
Questions for the listing agent
- What do current leases actually rent for vs. the listed asking? Can we see a recent rent roll and the last 12 months of T-12 income?
- Can we see the unit-by-unit rent roll, current vacancy, and any below-market leases? What's the average tenancy length?
- What capital expenditures (roof, boiler, parking lot, exteriors) have been made in the last 5 years, and what's planned in the next 2?
- Built in 1979 — when were the roof, HVAC, electrical panel, plumbing, and water heater last replaced?
- Is there a deadline driving the sale (1031 exchange, divorce, estate, relocation)? That informs how much negotiation room exists.
- Schools are A-rated — typically a magnet for longer-tenancy family renters. What's the average tenant stay here, and is there a school-zone premium baked into asking?
- The area grade is low — what's the realistic commute time and amenity access for the typical tenant pool here? Any planned neighborhood developments (good or bad) we should know about?
- What's the average days-on-market for RENTAL listings here right now (not sales)? A rising rental-DOM trend means longer vacancies and softer asking-rent achievability than the comps imply.
- What's the recent tenant-quality profile in this submarket — average credit score on applications, eviction rate, late-payment / NSF rate, and stable-employment percentage? A property-management company in the area should have these aggregated.
- How much new apartment / multifamily construction is in the pipeline within 1–3 miles? Heavy new supply (>2% of stock underway) typically softens rents 12–24 months out; light construction supports rent growth.
Investment metrics
- 1% rule
- 0.83% ✗
- Cap rate
- 6.21%
- Cash-on-cash
- -0.28%
- DSCR
- 0.99
- GRM
- 10.1
CMA / ARV
- ARV (on-the-fly)
- $403,200
- Comps found
- 11
Show comp detail 11 sales within ~0.75 mi
| Address | Dist | Beds/Ba | Sqft | Sold | Price | $/sf | Match |
|---|---|---|---|---|---|---|---|
| 540 Green St | 0.00mi | 4/— | 1,800 (0%) | 1mo | $460,000 | $256 | 99 |
| 538 Green St | 0.01mi | 4/— | 1,800 (0%) | 1mo | $475,000 | $264 | 99 |
| 534 Green St | 0.02mi | 4/— | 1,800 (0%) | 4mo | $460,000 | $256 | 96 |
| 532 Green St | 0.02mi | 4/— | 1,800 (0%) | 6mo | $460,000 | $256 | 94 |
| 117 Green St | 0.39mi | 4/— | 1,929 (+7%) | 16mo | $422,500 | $219 | 56 |
| 136 Jenkins Ave | 0.57mi | 3/— (-1) | 1,704 (-5%) | 4mo | $315,000 | $185 | 56 |
| 48 E Main St | 0.58mi | 3/— (-1) | 1,682 (-7%) | 14mo | $370,000 | $220 | 46 |
| 409 Pierce St | 0.74mi | 5/— (+1) | 1,856 (+3%) | 20mo | $415,000 | $224 | 39 |
| 156 E Main St | 0.64mi | 4/2.0 | 1,986 (+10%) | 21mo | $392,500 | $198 | 35 |
| 146 E Second St | 0.70mi | 3/— (-1) | 2,009 (+12%) | 12mo | $450,000 | $224 | 33 |
| 33 E Third | 0.70mi | 3/— (-1) | 1,569 (-13%) | 12mo | $370,000 | $236 | 31 |
Match score weights: distance 35% · size 25% · config 20% · recency 20%. Top-matched comps best support the ARV.
Projected returns pro-forma
-3.0% appreciation · 3.08% rent growth · sell at horizon
- IRR
- -16.7%
- Equity multiple
- 0.41×
- Total profit
- $-78,646
- Equity at exit
- $70,787
- IRR
- -8.4%
- Equity multiple
- 0.47×
- Total profit
- $-69,895
- Equity at exit
- $41,048
Cash invested: $132,930 (down + closing). Projections, not guarantees.
Landlord ↔ Tenant lean methodology
- Overall (STATE)
- 62 Landlord-Friendly
- State Pennsylvania
- 62 Landlord-Friendly · EVEN
- County
- — inherits STATE
- City
- — inherits STATE
ZIP-level market 19446
- Rents YoY
- 3.1%
- Active inventory
- 190
- Price-to-rent
- 20.2×
Monthly cashflow live
- Estimated rent
- $3,922 high interval (Pro) →
- Mortgage (P&I)
- −$2,490
- Tax from tax record
- −$442 /mo · $5,308/yr
- Insurance
- −$198
- HOA
- −$0
- Vacancy / Maint / Mgmt
- −$824
- Net cashflow
- $-31
Break-even live
Sensitivity live
| Price | -10% $237 | -5% $103 | +0% $-31 | +5% $-166 | +10% $-300 |
|---|---|---|---|---|---|
| Rent | -10% $-341 | -5% $-186 | +0% $-31 | +5% $124 | +10% $278 |
| Rate | -1.0pp $208 | -0.5pp $89 | base $-31 | +0.5pp $-154 | +1.0pp $-280 |
2-unit breakdown (identical units grouped — click to expand)
| Units | Beds | Baths | Est. rent |
|---|---|---|---|
| 2× units | 2 | 1 | $3,922 |
| #1 | 2 | 1 | $1,961 |
| #2 | 2 | 1 | $1,961 |
| Total (2 units) | $3,922 | ||
UW: 25.0% down · 7.5% · 30yr · 1.5% tax · 5.0% vac · 8.0% maint · 8.0% mgmt
Financing live
Cash to close
- Down payment
- $118,688
- Closing costs
- $14,242
- Reserves months
- —
- Total cash needed
- —
Loan-product check · same deal, 3 products live
Conventional
25% down · 7.5% · 30yr
- Down + closing
- —
- Monthly P&I
- —
- Monthly cashflow
- —
- DSCR
- —
- Eligible?
- —
Personal DTI + credit; lowest rate.
DSCR
20% down · 8.5% · 30yr
- Down + closing
- —
- Monthly P&I
- —
- Monthly cashflow
- —
- DSCR
- —
- Eligible?
- —
No personal income docs; deal must DSCR.
Hard money
10% down · 12.0% · 12mo
- Down + closing
- —
- Monthly P&I
- —
- Monthly cashflow
- —
- DSCR
- —
- Eligible?
- —
Short-term bridge; refi at stabilization.
Rent comps 9 comps
| Address | Beds | Baths | Sqft | Rent | $/sqft | DOM | Units | Dist |
|---|---|---|---|---|---|---|---|---|
| 113 Dragon Dr Unit 113 Lansdale, PA | 4.0 | 3.0 | 2080 | $3,400 | $1.63 | 3d | 1 | 0.41mi |
| 228 Compass Dr Lansdale, PA | 3.0 | 2.5 | 2080 | $3,100 | $1.49 | 4d | 1 | 0.48mi |
| 235 E Main St Unit 2F Lansdale, PA | 3.0 | 1.0 | 1916 | $1,650 | $0.86 | 3d | 1 | 0.69mi |
| 39 N Mitchell Ave Lansdale, PA | 3.0 | 3.5 | 1955 | $2,850 | $1.46 | 3d | 1 | 0.72mi |
| 201 N Line St Lansdale, PA | 3.0 | 2.0 | 1656 | $1,887 | $1.14 | 25d | 1 | 0.75mi |
| 31 W End Dr Lansdale, PA | 3.0 | 2.0 | 1380 | $3,100 | $2.25 | 18d | 1 | 0.90mi |
| 431 Williamson Ct Lansdale, PA | 3.0 | 2.5 | 2200 | $2,995 | $1.36 | 4d | 1 | 0.92mi |
| 1 Marlbrook Ln Lansdale, PA | 1.0–3.0 | 1.0–2.0 | 1251 | $2,649 | $2.12 | 0d | 18 | 1.13mi |
| 100 Snyder Rd Lansdale, PA | 1.0–3.0 | 1.0–2.0 | 1007 | $2,440 | $2.42 | 0d | 20 | 1.13mi |
Listing history 5 events
-
2026-05-06status Pending
-
2026-04-28historical Active Under Contract
-
2026-04-25$474,750 Active
-
2026-04-22historical $474,750
-
1984-01-05soldstatus $79,900
ⓘ Source: listings_history table (triggers on properties + properties_extension) + one-shot
backfill from property_details.listing_events for pre-trigger history.
Tax reassessment forecast PA · Partial reset (capped growth)
- Current annual tax
- $5,308 · $442/mo
- Projected year-2 tax
- $6,404 · $534/mo
- Expected delta
- +$1,097/yr (+$91/mo · 20.7%)
ⓘ Screening estimate from a state-policy table — verify with the county assessor before closing.
Climate risk First Street
- Flood 1/10 Low FEMA zone X (unshaded) · 0% chance over 30 yrs
- Wildfire 1/10 Low
- Heat 5/10 Major 7 d/yr ≥99°F today · 15 d/yr by 30 yrs out
- Wind 6/10 Major 27% chance of damaging wind over 30 yrs
- Air quality 4/10 Moderate 5 unhealthy d/yr today · 8 by 30 yrs out
Nearby sold comps map
Loading sold comps map…
Walkable amenities ~0.75 mi
Loading nearby amenities…
Taxation est. · year 1
- Rental income
- $47,064
- − Mortgage interest
- −$26,593
- − Property taxes
- −$5,308
- − Insurance
- −$2,374
- − Repairs & maintenance
- −$3,765
- − Management
- −$3,765
- − Depreciation
- −$13,811
- Taxable loss
- −$8,552
- Est. tax savings @ 24.0%
- +$2,052
- After-tax cash flow
- $1,676/yr
For passive investors: Depreciation is non-cash, so a rental often shows a tax loss while cash-flowing — sheltering income. Rental losses are passive: they offset passive income freely, and up to $25,000/yr can offset ordinary (W-2) income if you actively participate and your MAGI is under $100k (phasing out to $0 by $150k); unused losses carry forward. On sale, claimed depreciation is recaptured at up to 25%, and gains may owe capital-gains tax (a 1031 exchange can defer both). Figures are a year-1 estimate at your 24.0% rate — not tax advice; consult a CPA.
Schools (NCES district)
- District
- North Penn SD
- NCES district ID
- 4217280
- Math proficiency
- 48% ▼ -10.00%
- Reading proficiency
- 67% ▼ -9.00%
- Median HH income
- $76,866
- Composite
- 51.5/100
- National rank
- #1722
- State rank
- #76 of 539 in PA
Livability — Lansdale
- Score
- 89/100
- State rank
- #31
- US rank
- #170
Category grades
Schools grade is shown separately in the Schools card above.
Census & demographics
- Census place
- Lansdale, PA
- County
- Montgomery County · 712,331 people
- City population
- 61,848
- Metro
- Philadelphia-Camden-Wilmington, PA-NJ-DE-MD
- Population (ZIP)
- 61,848
- Household income
- $106,310
- Rent vs Own
- Severe rent burden
- 1930.0
Population outlook (Montgomery County) Hauer SSP2
- Today (2025)
- 856,074 people
- By 2030
- 870,887 · +1.7%
- By 2040
- 891,195 · +4.1%
- By 2050
- 896,417 · +4.7%
- By 2075
- 903,212 · +5.5%
- By 2100
- 843,240 · -1.5%
Race, ethnicity, and origin ACS 2023
- Neighborhood character
- Predominantly White (71%)
- Race & ethnicity
- White 71% Asian 14% Black 7% Two or more races 4% Hispanic / Latino 4%
- Common ancestry
- Romanian 5% Slovak 2% Scotch-Irish 1%
- Foreign-born
- 16% · Canada, South Korea, China
- Languages at home
- 81% English-only · Other Indo-European 6% Spanish 2% Korean 2%
Political lean MEDSL · Montgomery
- 2024 margin
- Strong D (+22.8) · D 60.9% · R 38.1% · Other 1.1%
- 2008→2024 swing
- +2.0pp toward D · 2008: 20.8pp · 2024: 22.8pp
- All cycles
- 2024: D+22.8 2020: D+26.3 2016: D+21.1 2012: D+14.3 2008: D+20.8
Not yet ingested
- Civics
- —
Market trends
- HPI YoY
- ▼ -340.90%
- Current HPI
- 279.3557
- Rent YoY
- ▲ 3.08%
- Metro
- Philadelphia-Camden-Wilmington, PA-NJ-DE-MD
- State GDP YoY
- ▲ 1.68%
- F500 in state
- 34
Industry mix (Fortune 500 HQ in PA)
| Industry | F500 HQs | Revenue |
|---|---|---|
| Healthcare | 2 | $309B |
|
||
| Insurance | 2 | $27B |
|
||
| Telecommunications / Media | 1 | $124B |
|
||
| Industrial Distribution | 1 | $22B |
|
||
| Financial Services | 1 | $20B |
|
||
| Chemicals / Materials | 1 | $18B |
|
||
Price history
+494.2% since first listed5 events — show timeline
- 2026-05-06 Pending — BRIGHT MLS
- 2026-04-28 Contingent — BRIGHT MLS
- 2026-04-25 Listed $474,750 BRIGHT MLS
- 2026-04-22 Coming Soon $474,750 BRIGHT MLS
- 1984-01-05 Sold (Public Records) $79,900 Public Records
Property tax history
+3.5%/yrLatest (2026): $5,308 · +4.6% YoY. Source: county tax records.
Cash-flow waterfall
monthlySold comps — $/sqft
last 12 mo · ≤1 miLoading sold comps…