 Multi-family
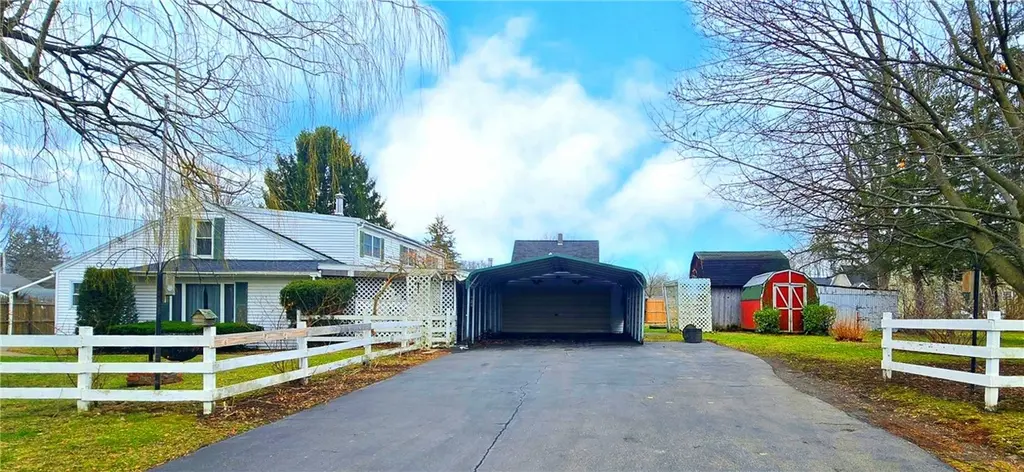
31 Lorraine Blvd · Horseheads, NY
Flood risk 1/10 · Minimal
- FEMA flood zone
- X
- Chance of flooding over 30 yrs
- 0.0%
- Est. flood insurance / yr
- $473 – $860
Fire risk 2/10 · Minimal
- Est. fire insurance / yr
- $691 – $1,283
Heat risk 3/10 · Minor
- Hot days now (above 96°F)
- 7 days/yr
- Hot days in 30 yrs
- 16 days/yr
Wind risk 1/10 · Minimal
- Chance of severe wind over 30 yrs
- 1.0%
Air-quality risk 2/10 · Minimal
- Unhealthy air days now
- 0 days/yr
- Unhealthy air days in 30 yrs
- 1 days/yr
Risk factors via First Street. Map © Google.
Why this score? — see what drove the B grade
The composite is a weighted blend of 9 inputs, each scored 0–100. Each bar is that input's sub-score; the figure is the points it added to the 100-point composite (weight × sub-score).
- Cash flow +30.0/30.0
- 1% rule +10.0/10.0
- DSCR +10.0/10.0
- ARV discount +8.2/15.0
- Schools +4.5/10.0
- Livability +3.5/5.0
- Rent growth +2.5/5.0
- Condition / age +2.5/5.0
- Appreciation +0.0/10.0
$165,000
🖨 Deal sheet (PDF) 📄 Offer letter ✓ Due diligence
Multi-family units
County records classify this as Multi-Family (2-4 Unit). Listing-text estimate: 1 unit. estimate disagrees with records
Listing remarks
This 3,200+square-foot home in Horseheads is full of charm and ready for someone with creativity to make it shine. It has a warm, cozy farmhouse feel. While it needs some fixing up, it has great bones and tons of potential. The layout is very flexible. Both the main home and the attached apartment can be set up to fit your needs. In total, the home offers five bedrooms, giving you plenty of space for family, guests, hobbies, or even a rental opportunity. Unit A features a retro kitchen, living room, dining room, family room, & a laundry room. Unit B includes a kitchen and a living room. If you love cars or projects, the four-car garage is a huge bonus. Outside, you’ll find a barn
Key facts
- Garden area
- Flexible layout
- Carport
Tags
Neighborhood map
What this means for you Summary
Snapshot
- This is a 5-bed/2.0-bath multifamily listed at $165k.
Deal economics
- At list price, monthly cash flow is $1k ($13k/yr) — positive.
- The deal already cash-flows at list — no discount required.
- Meets the 1% rule at list price ($3k rent vs $165k).
- Recommended offer: $163k (1.5% below list) — sets the bar for market timing.
- Cap rate 14.4% vs local median 5.1% in Horseheads — top-decile yield for the area; either an underpriced asset or a hidden risk that comps aren't pricing in. Stress-test before assuming the spread holds.
Location & tenants
- Location reads 69/100 on livability (#494 in NY) — a middle-class / working-renter tenant base. Strengths: housing A+, cost of living A; Watch: crime D+, health & safety D, amenities F.
- Horseheads Central School District (suburban): math 44% / reading 58% proficiency, ranked #347 of 590 in NY (top 59%) — acceptable for families but not a draw, mixed tenant base, ~2y average lease.
- Zoned schools: Center Street School (math 17% / reading 37%, grade F, #1,786 of 2,108 statewide, top 86%, 280 students, 55% FRL); Horseheads Middle School (math 29% / reading 50%, grade F, #418 of 729 statewide, top 59%, 572 students, 36% FRL); Horseheads Senior High School (math 95% / reading 98%, grade A+, #59 of 1,100 statewide, top 6%, 1,142 students, 27% FRL) — zoned schools average 39% FRL vs 24% district-wide (15 pts higher); higher-poverty schools than district average — tighter screening recommended.
- Market conditions: 92 active listings in the ZIP; 1 comparable units currently listed for rent nearby; 91 units permitted in Chemung County in 2024 (63 in 5+ unit buildings).
Forward outlook
- Local home prices are declining (-3.0%/yr); year-one equity from $1k of loan paydown is wiped out by about $5k of value loss. Plan a longer hold.
- Chemung County population projected at -17% by 2050 — secular population decline; favor cash flow + early exit over multi-decade hold.
- At projected returns (-3.0% appreciation + 3.0% rent growth), your $46k cash investment doubles in ~5 years — after that, you're playing with house money.
Negotiation context
- It's been on market 27 days — a 2% lower offer ($163k) is reasonable based on typical stale-listing flexibility.
- Current owner paid $97k; list at $165k implies a 70% gain — meaningful room to come down on a strong offer.
Risks & watch-outs
- Watch-outs: property tax is 3.9% of price; built in 1950 — expect roof / HVAC / electrical / plumbing capex.
Questions for the listing agent
- Built in 1950 — when were the roof, HVAC, electrical panel, plumbing, and water heater last replaced?
- Property tax is high relative to price — has the assessment been appealed recently, and will the sale trigger a re-assessment?
- Is there a deadline driving the sale (1031 exchange, divorce, estate, relocation)? That informs how much negotiation room exists.
- Schools are B-rated — typically a magnet for longer-tenancy family renters. What's the average tenant stay here, and is there a school-zone premium baked into asking?
- Crime grade is D in this area — have there been break-ins, vandalism, or insurance claims at this property in the last 3 years? What carrier currently insures it and at what premium?
- What's the average days-on-market for RENTAL listings here right now (not sales)? A rising rental-DOM trend means longer vacancies and softer asking-rent achievability than the comps imply.
- What's the recent tenant-quality profile in this submarket — average credit score on applications, eviction rate, late-payment / NSF rate, and stable-employment percentage? A property-management company in the area should have these aggregated.
- How much new apartment / multifamily construction is in the pipeline within 1–3 miles? Heavy new supply (>2% of stock underway) typically softens rents 12–24 months out; light construction supports rent growth.
Investment metrics
- 1% rule
- 1.98% ✓
- Cap rate
- 14.40%
- Cash-on-cash
- 28.95%
- DSCR
- 2.29
- GRM
- 4.2
CMA / ARV
- ARV (on-the-fly)
- $167,535
- Comps found
- 1
Show comp detail 1 sale within ~0.75 mi
| Address | Dist | Beds/Ba | Sqft | Sold | Price | $/sf | Match |
|---|---|---|---|---|---|---|---|
| 911 S Main St | 0.62mi | 5/2.0 | 2,945 (-10%) | 15mo | $150,000 | $51 | 42 |
Match score weights: distance 35% · size 25% · config 20% · recency 20%. Top-matched comps best support the ARV.
Projected returns pro-forma
-3.0% appreciation · 3.0% rent growth · sell at horizon
- IRR
- 23.4%
- Equity multiple
- 1.96×
- Total profit
- $44,500
- Equity at exit
- $24,602
- IRR
- 31.4%
- Equity multiple
- 3.84×
- Total profit
- $131,171
- Equity at exit
- $14,266
Cash invested: $46,200 (down + closing). Projections, not guarantees.
Landlord ↔ Tenant lean methodology
- Overall (STATE)
- 15 Strongly Tenant-Friendly
- State New York
- 15 Strongly Tenant-Friendly · D+10
- County
- — inherits STATE
- City
- — inherits STATE
ZIP-level market 14845
- Home prices YoY
- -24.9%
- Active inventory
- 92
- Price-to-rent
- 8.0×
Monthly cashflow live
- Estimated rent
- $3,266 medium interval (Pro) →
- Mortgage (P&I)
- −$865
- Tax from tax record
- −$532 /mo · $6,378/yr
- Insurance
- −$69
- HOA
- −$0
- Vacancy / Maint / Mgmt
- −$686
- Net cashflow
- $1,115
Break-even live
Sensitivity live
| Price | -10% $1,208 | -5% $1,161 | +0% $1,115 | +5% $1,068 | +10% $1,021 |
|---|---|---|---|---|---|
| Rent | -10% $857 | -5% $986 | +0% $1,115 | +5% $1,244 | +10% $1,373 |
| Rate | -1.0pp $1,198 | -0.5pp $1,157 | base $1,115 | +0.5pp $1,072 | +1.0pp $1,028 |
2-unit breakdown (identical units grouped — click to expand)
| Units | Beds | Baths | Est. rent |
|---|---|---|---|
| 1× unit | 3 | 1.5 | $1,722 |
| 1× unit | 2 | 1 | $1,544 |
| Total (2 units) | $3,266 | ||
UW: 25.0% down · 7.5% · 30yr · 1.5% tax · 5.0% vac · 8.0% maint · 8.0% mgmt
Financing live
Cash to close
- Down payment
- $41,250
- Closing costs
- $4,950
- Reserves months
- —
- Total cash needed
- —
Loan-product check · same deal, 3 products live
Conventional
25% down · 7.5% · 30yr
- Down + closing
- —
- Monthly P&I
- —
- Monthly cashflow
- —
- DSCR
- —
- Eligible?
- —
Personal DTI + credit; lowest rate.
DSCR
20% down · 8.5% · 30yr
- Down + closing
- —
- Monthly P&I
- —
- Monthly cashflow
- —
- DSCR
- —
- Eligible?
- —
No personal income docs; deal must DSCR.
Hard money
10% down · 12.0% · 12mo
- Down + closing
- —
- Monthly P&I
- —
- Monthly cashflow
- —
- DSCR
- —
- Eligible?
- —
Short-term bridge; refi at stabilization.
Rent comps 1 comps
| Address | Beds | Baths | Sqft | Rent | $/sqft | DOM | Units | Dist |
|---|---|---|---|---|---|---|---|---|
| 911 S Main St Horseheads, NY | 4.0 | 3.0 | 2945 | $4,500 | $1.53 | 45d | 1 | 0.64mi |
Listing history 5 events
-
2026-04-20status Pending
-
2026-04-17price $165,000
-
2026-04-08price $175,000
-
2026-03-24$199,000 Active
-
2020-10-19soldstatus $97,000
ⓘ Source: listings_history table (triggers on properties + properties_extension) + one-shot
backfill from property_details.listing_events for pre-trigger history.
Tax reassessment forecast NY · Partial reset (capped growth)
- Current annual tax
- $6,378 · $532/mo
- Projected year-2 tax
- $6,378 · $532/mo
- Expected delta
- $0/yr ($0/mo · 0.0%)
ⓘ Screening estimate from a state-policy table — verify with the county assessor before closing.
Climate risk First Street
- Flood 1/10 Low FEMA zone X · 0% chance over 30 yrs
- Wildfire 2/10 Low
- Heat 3/10 Moderate 7 d/yr ≥96°F today · 16 d/yr by 30 yrs out
- Wind 1/10 Low 100% chance of damaging wind over 30 yrs
- Air quality 2/10 Low 0 unhealthy d/yr today · 1 by 30 yrs out
Nearby sold comps map
Loading sold comps map…
Walkable amenities ~0.75 mi
Loading nearby amenities…
Taxation est. · year 1
- Rental income
- $39,192
- − Mortgage interest
- −$9,243
- − Property taxes
- −$6,378
- − Insurance
- −$825
- − Repairs & maintenance
- −$3,135
- − Management
- −$3,135
- − Depreciation
- −$4,800
- Taxable income
- $11,675
- Est. tax owed @ 24.0%
- −$2,802
- After-tax cash flow
- $10,573/yr
For passive investors: Depreciation is non-cash, so a rental often shows a tax loss while cash-flowing — sheltering income. Rental losses are passive: they offset passive income freely, and up to $25,000/yr can offset ordinary (W-2) income if you actively participate and your MAGI is under $100k (phasing out to $0 by $150k); unused losses carry forward. On sale, claimed depreciation is recaptured at up to 25%, and gains may owe capital-gains tax (a 1031 exchange can defer both). Figures are a year-1 estimate at your 24.0% rate — not tax advice; consult a CPA.
Schools (NCES district)
- District
- Horseheads Central School District
- NCES district ID
- 3614850
- Math proficiency
- 44% ▼ -19.00%
- Reading proficiency
- 58% ▲ 3.00%
- Median HH income
- $60,594
- Composite
- 44.58/100
- National rank
- #2781
- State rank
- #347 of 590 in NY
Livability — Horseheads
- Score
- 69/100
- State rank
- #494
- US rank
- #8689
Category grades
Schools grade is shown separately in the Schools card above.
Census & demographics
- Census place
- Horseheads, NY
- Population (ZIP)
- 20,552
Population outlook (Chemung County) Hauer SSP2
- Today (2025)
- 82,931 people
- By 2030
- 80,356 · -3.1%
- By 2040
- 74,745 · -9.9%
- By 2050
- 69,012 · -16.8%
- By 2075
- 55,689 · -32.8%
- By 2100
- 41,428 · -50.0%
Race, ethnicity, and origin ACS 2023
- Neighborhood character
- Predominantly White (90%)
- Race & ethnicity
- White 90% Two or more races 5% Asian 2% Hispanic / Latino 2% Black 2%
- Common ancestry
- Romanian 6% Slovak 2% Iranian 2%
- Foreign-born
- 6% · Canada, China, South Korea
- Languages at home
- 94% English-only · Spanish 2% Other Asian/Pacific 1% Other Indo-European 1%
Political lean MEDSL · Chemung
- 2024 margin
- R (+16.8) · D 41.6% · R 58.4%
- 2008→2024 swing
- -15.6pp toward R · 2008: -1.2pp · 2024: -16.8pp
- All cycles
- 2024: R+16.8 2020: R+13.4 2016: R+20.0 2012: R+2.9 2008: R+1.2
Not yet ingested
- Civics
- —
Market trends
- HPI YoY
- ▼ -82.23%
- Current HPI
- 247.777
- Rent YoY
- —
- Metro
- —
- State GDP YoY
- ▲ 2.60%
- F500 in state
- 92
Industry mix (Fortune 500 HQ in NY)
| Industry | F500 HQs | Revenue |
|---|---|---|
| Financial Services | 10 | $950B |
|
||
| Consumer Goods | 9 | $162B |
|
||
| Insurance | 4 | $225B |
|
||
| Telecommunications | 2 | $144B |
|
||
| Pharmaceuticals | 2 | $112B |
|
||
| Media / Entertainment | 2 | $69B |
|
||
Price history
+70.1% since first listed5 events — show timeline
- 2026-04-20 Pending — UNYREIS
- 2026-04-17 Price Changed $165,000 UNYREIS
- 2026-04-08 Price Changed $175,000 UNYREIS
- 2026-03-24 Listed $199,000 UNYREIS
- 2020-10-19 Sold (Public Records) $97,000 Public Records
Property tax history
+11.0%/yrLatest (2025): $6,378 · +51.8% YoY. Source: county tax records.
Cash-flow waterfall
monthlySold comps — $/sqft
last 12 mo · ≤1 miLoading sold comps…