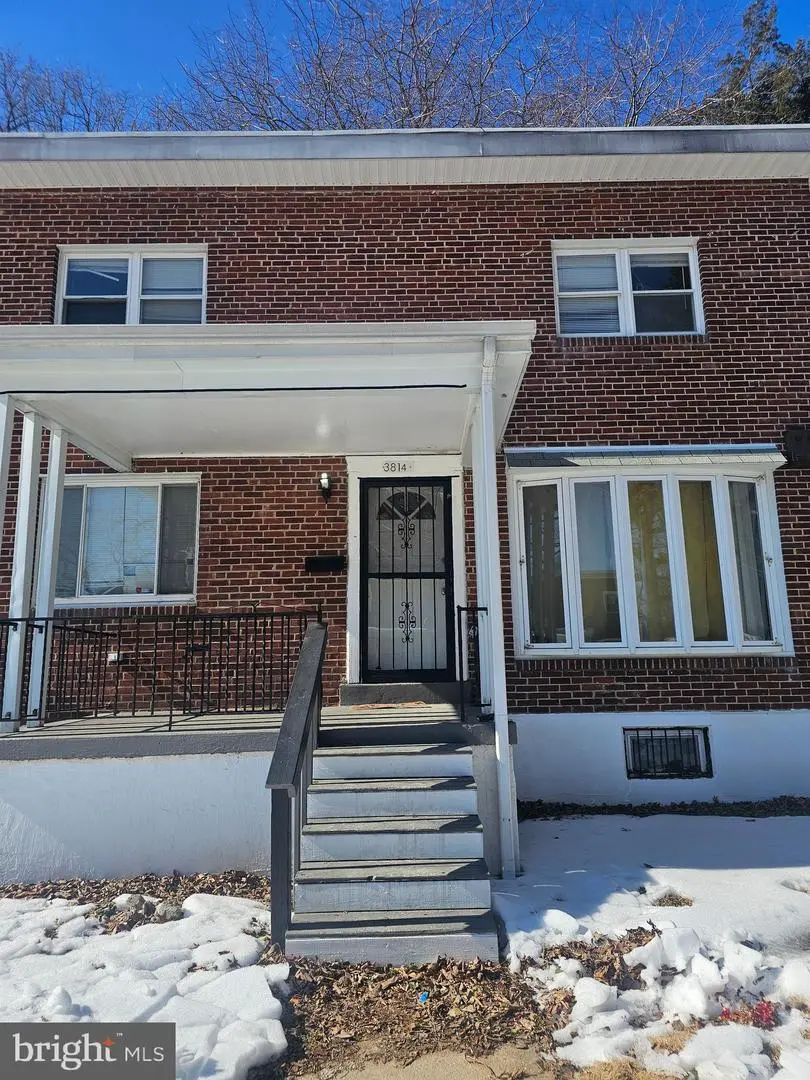
3814 Howard Park Ave · Baltimore, MD
Flood risk 1/10 · Minimal
- FEMA flood zone
- X (unshaded)
- Chance of flooding over 30 yrs
- 0.0%
- Est. flood insurance / yr
- $473 – $860
Fire risk 1/10 · Minimal
- Est. fire insurance / yr
- $755 – $1,403
Heat risk 6/10 · Moderate
- Hot days now (above 103°F)
- 7 days/yr
- Hot days in 30 yrs
- 15 days/yr
Wind risk 5/10 · Moderate
- Chance of severe wind over 30 yrs
- 24.0%
Air-quality risk 3/10 · Minor
- Unhealthy air days now
- 3 days/yr
- Unhealthy air days in 30 yrs
- 4 days/yr
Risk factors via First Street. Map © Google.
Why this score? — see what drove the A grade
The composite is a weighted blend of 9 inputs, each scored 0–100. Each bar is that input's sub-score; the figure is the points it added to the 100-point composite (weight × sub-score).
- Cash flow +30.0/30.0
- ARV discount +15.0/15.0
- 1% rule +10.0/10.0
- DSCR +10.0/10.0
- Appreciation +9.8/10.0
- Rent growth +3.8/5.0
- Livability +3.8/5.0
- Condition / age +2.5/5.0
- Schools +1.0/10.0
$120,000
🖨 Deal sheet 📄 Offer letter ✓ Due diligence
Listing remarks MLS
Investor Opportunity in Sought-After Howard Park! Property must be listed as active for 15 days as per lender guidelines. Rare chance to secure a property in the desirable Howard Park community at just $120,000. This home experienced significant flooding and has not been restored; however, the insurance company has already completed professional dry-out services and removed the flooring, giving investors a head start on the renovation process. The property will require a full rehab. Electrical issues are present with partial power loss, and all appliances are currently non-functional. For the right investor, this is a prime opportunity to renovate and add serious value in a strong neighborhood. The home also features a spacious backyard, offering additional potential for outdoor living or expansion. Sold strictly as-is. Short sale—subject to third-party approval. Cash or renovation financing preferred. No utilities on. Use caution when entering. Buyer to verify all property condition, utilities, and potential use. Seller will make no repairs.
Key facts
- Spacious backyard
- Built 1953
- Listed 19 days
Tags
Neighborhood map
What this means for you Summary
Snapshot
- This is a 4-bed/3.0-bath townhouse listed at $120k.
Deal economics
- At list price, monthly cash flow is $869 ($10k/yr) — positive.
- The deal already cash-flows at list — no discount required.
- Meets the 1% rule at list price ($2k rent vs $120k).
- Recommended offer: $118k (1.5% below list) — sets the bar for market timing.
- Cap rate 15.0% vs local median 6.0% in Baltimore — top-decile yield for the area; either an underpriced asset or a hidden risk that comps aren't pricing in. Stress-test before assuming the spread holds.
Location & tenants
- Location reads 76/100 on livability (#90 in MD, #3,396 nationally) — a middle-class / working-renter tenant base. Strengths: amenities A+, commute A+, housing A+; Watch: schools D, crime F.
- Baltimore City Public Schools (urban): math 7% / reading 16% proficiency, ranked #24 of 24 in MD (top 100%) — low school quality limits family demand, transient renter base, plan for 1-2y turnover; 79% free/reduced lunch — lower-income household profile, screen leases tightly.
- Market conditions: Rents rising fast (+5.2%/yr); 126 active listings in the ZIP; 10 comparable units currently listed for rent nearby; rentals at typical pace (median 20d on market — plan ~3-4 weeks tenant-placement turnaround); 1,273 units permitted in Baltimore city in 2024 (1,104 in 5+ unit buildings).
- This rent runs 43% of the median local income ($67k/yr) — at the standard rent-burdened threshold; future hikes will face affordability resistance.
Forward outlook
- In year one you build about $12k of equity ($830 loan paydown + $11k appreciation (9.5% local appreciation)).
- Baltimore County population projected to shrink 4% by 2050 — rents likely to lag national; underwrite the cash flow, not the appreciation.
- At projected returns (9.5% appreciation + 5.2% rent growth), your $34k cash investment doubles in ~2 years — after that, you're playing with house money.
- By year 3, paydown + projected appreciation supports a ~$31k cash-out refi (75% LTV) — recoverable capital for the next deal without selling this one.
Negotiation context
- It's been on market 19 days — a 2% lower offer ($118k) is reasonable based on typical stale-listing flexibility.
- 6 sale attempts since 22y ago with the ask held roughly flat each time — persistent listings suggest the price (not the market) is what's stuck; bring a comps-based counter.
Risks & watch-outs
- Watch-outs: property tax is 3.3% of price; built in 1953 — expect roof / HVAC / electrical / plumbing capex.
- Climate carrying-cost: moderate wind risk, 24% chance of damaging wind over 30y; extreme-heat days projected 7→15/yr by 2055 (HVAC capex compounding) — expect insurance premiums to compound above CPI over the hold.
Questions for the listing agent
- Built in 1953 — when were the roof, HVAC, electrical panel, plumbing, and water heater last replaced?
- Property tax is high relative to price — has the assessment been appealed recently, and will the sale trigger a re-assessment?
- Is there a deadline driving the sale (1031 exchange, divorce, estate, relocation)? That informs how much negotiation room exists.
- Schools are D-rated, which usually means shorter tenancies and higher turnover. Who's the typical renter profile here, and what's been the actual vacancy rate?
- Crime grade is F in this area — have there been break-ins, vandalism, or insurance claims at this property in the last 3 years? What carrier currently insures it and at what premium?
- What's the average days-on-market for RENTAL listings here right now (not sales)? A rising rental-DOM trend means longer vacancies and softer asking-rent achievability than the comps imply.
- What's the recent tenant-quality profile in this submarket — average credit score on applications, eviction rate, late-payment / NSF rate, and stable-employment percentage? A property-management company in the area should have these aggregated.
- How much new for-sale + rental construction is in the pipeline within 1–3 miles? Heavy new supply typically softens prices + rents 12–24 months out; constrained supply supports both.
Investment metrics
- 1% rule
- 1.98% ✓
- Cap rate
- 14.98%
- Cash-on-cash
- 31.02%
- DSCR
- 2.38
- GRM
- 4.2
CMA / ARV
- ARV (median comp)
- $218,080
- List price
- $120,000
- Delta
- -44.97%
- Verdict
- UNDERPRICED
- Comps
- 20 within 1.0 mi
Show comp detail 12 sales within ~0.75 mi
| Address | Dist | Beds/Ba | Sqft | Sold | Price | $/sf | Match |
|---|---|---|---|---|---|---|---|
| 4411 Belvieu Ave | 0.19mi | 4/2.0 | 1,696 (+2%) | 4mo | $190,000 | $112 | 81 |
| 4703 Post Rd | 0.21mi | 4/2.5 | 1,600 (-4%) | 9mo | $275,000 | $172 | 74 |
| 4402 Haddon Ave | 0.42mi | 4/3.5 | 1,814 (+9%) | 2mo | $290,000 | $160 | 62 |
| 5528 Belle Ave | 0.34mi | 4/2.0 | 1,480 (-11%) | 2mo | $268,000 | $181 | 60 |
| 5419 Lynview Ave | 0.66mi | 4/2.0 | 1,692 (+2%) | 7mo | $236,000 | $139 | 57 |
| 5404 Crismer Ave | 0.73mi | 3/2.0 (-1) | 1,667 (+0%) | 1mo | $239,900 | $144 | 56 |
| 3951 Boarman Ave | 0.74mi | 4/2.5 | 1,588 (-5%) | 2mo | $249,000 | $157 | 54 |
| 5310 Haddon Ave | 0.32mi | 4/2.0 | 1,882 (+13%) | 6mo | $275,000 | $146 | 54 |
| 4040 W Cold Spring Ln | 0.53mi | 4/2.0 | 1,782 (+7%) | 7mo | $205,000 | $115 | 54 |
| 5527 Belle Ave | 0.35mi | 4/2.0 | 1,440 (-14%) | 6mo | $125,000 | $87 | 52 |
| 4011 Oakford Ave | 0.55mi | 5/3.0 (+1) | 1,504 (-10%) | 7mo | $304,000 | $202 | 48 |
| 3601 Hicks Ave | 0.64mi | 4/4.0 | 1,782 (+7%) | 12mo | $287,500 | $161 | 44 |
Match score weights: distance 35% · size 25% · config 20% · recency 20%. Top-matched comps best support the ARV.
Projected returns pro-forma
9.5% appreciation · 5.23% rent growth · sell at horizon
- IRR
- 48.8%
- Equity multiple
- 4.64×
- Total profit
- $122,201
- Equity at exit
- $103,753
- IRR
- 43.9%
- Equity multiple
- 10.76×
- Total profit
- $327,799
- Equity at exit
- $219,272
Cash invested: $33,600 (down + closing). Projections, not guarantees.
Landlord ↔ Tenant lean methodology
- Overall (CITY)
- 12 Strongly Tenant-Friendly
- State Maryland
- 27 Tenant-Leaning · D+14
- County
- — inherits STATE
- City Baltimore
- 12 Strongly Tenant-Friendly · D+58
ZIP-level market 21207
- Home prices YoY
- 1.1%
- Rents YoY
- 5.2%
- Active inventory
- 126
- Price-to-rent
- 4.2×
Monthly cashflow live
- Estimated rent
- $2,381 high interval (Pro) →
- Mortgage (P&I)
- −$629
- Tax from tax record
- −$333 /mo · $4,000/yr
- Insurance
- −$50
- HOA
- −$0
- Vacancy / Maint / Mgmt
- −$500
- Net cashflow
- $869
Break-even live
UW: 25.0% down · 7.5% · 30yr · 1.5% tax · 5.0% vac · 8.0% maint · 8.0% mgmt
Financing live
Cash to close
- Down payment
- $30,000
- Closing costs
- $3,600
- Reserves months
- —
- Total cash needed
- —
Loan-product check · same deal, 3 products live
Conventional
25% down · 7.5% · 30yr
- Down + closing
- —
- Monthly P&I
- —
- Monthly cashflow
- —
- DSCR
- —
- Eligible?
- —
Personal DTI + credit; lowest rate.
DSCR
20% down · 8.5% · 30yr
- Down + closing
- —
- Monthly P&I
- —
- Monthly cashflow
- —
- DSCR
- —
- Eligible?
- —
No personal income docs; deal must DSCR.
Hard money
10% down · 12.0% · 12mo
- Down + closing
- —
- Monthly P&I
- —
- Monthly cashflow
- —
- DSCR
- —
- Eligible?
- —
Short-term bridge; refi at stabilization.
Rent comps 10 comps
| Address | Beds | Baths | Sqft | Rent | $/sqft | DOM | Units | Dist |
|---|---|---|---|---|---|---|---|---|
| 3807 Bowers Ave Gwynn Oak, MD | 3.0 | 1.5 | 1152 | $2,200 | $1.91 | 43d | 1 | 0.42mi |
| 3535 Flannery Ln Gwynn Oak, MD | 3.0 | 1.5 | 1536 | $2,000 | $1.30 | 43d | 1 | 0.86mi |
| 3784 Columbus Dr Baltimore, MD | 4.0 | 2.0 | 1250 | $2,200 | $1.76 | 23d | 1 | 0.98mi |
| 3912 Mortimer Ave Baltimore, MD | 3.0 | 2.0 | 1204 | $2,723 | $2.26 | 43d | 1 | 1.01mi |
| 6226 Robin Hill Rd Gwynn Oak, MD | 3.0 | 1.5 | 1140 | $2,850 | $2.50 | 16d | 1 | 1.17mi |
| 4998 W Forest Park Ave Baltimore, MD | 3.0 | 1.0–2.0 | 790 | $1,875 | $2.37 | 14d | 15 | 1.23mi |
| 5306 Ethelbert Ave Baltimore, MD | 5.0 | 2.5 | 1510 | $3,000 | $1.99 | 4d | 1 | 1.34mi |
| 3709 Fords Ln Baltimore, MD | 4.0 | 3.5 | 2248 | $3,200 | $1.42 | 20d | 1 | 1.45mi |
| 4037 Cedardale Rd Baltimore, MD | 5.0 | 3.0 | 1500 | $2,800 | $1.87 | 14d | 1 | 1.47mi |
| 6609 Eberle Dr Baltimore, MD | 1.0–3.0 | 1.0–2.0 | 1011 | $1,787 | $1.77 | 1d | 25 | 1.49mi |
Listing history 20 events
-
2026-05-11status Pending 1064-char remark
Show marketing remark (1064 chars)
Investor Opportunity in Sought-After Howard Park! Property must be listed as active for 15 days as per lender guidelines. Rare chance to secure a property in the desirable Howard Park community at just $120,000. This home experienced significant flooding and has not been restored; however, the insurance company has already completed professional dry-out services and removed the flooring, giving investors a head start on the renovation process. The property will require a full rehab. Electrical issues are present with partial power loss, and all appliances are currently non-functional. For the right investor, this is a prime opportunity to renovate and add serious value in a strong neighborhood. The home also features a spacious backyard, offering additional potential for outdoor living or expansion. Sold strictly as-is. Short sale—subject to third-party approval. Cash or renovation financing preferred. No utilities on. Use caution when entering. Buyer to verify all property condition, utilities, and potential use. Seller will make no repairs.
-
2026-04-22$120,000 Active 1064-char remark
Show marketing remark (1064 chars)
Investor Opportunity in Sought-After Howard Park! Property must be listed as active for 15 days as per lender guidelines. Rare chance to secure a property in the desirable Howard Park community at just $120,000. This home experienced significant flooding and has not been restored; however, the insurance company has already completed professional dry-out services and removed the flooring, giving investors a head start on the renovation process. The property will require a full rehab. Electrical issues are present with partial power loss, and all appliances are currently non-functional. For the right investor, this is a prime opportunity to renovate and add serious value in a strong neighborhood. The home also features a spacious backyard, offering additional potential for outdoor living or expansion. Sold strictly as-is. Short sale—subject to third-party approval. Cash or renovation financing preferred. No utilities on. Use caution when entering. Buyer to verify all property condition, utilities, and potential use. Seller will make no repairs.
-
2025-11-17historical
-
2025-11-15status Active
-
2025-09-23historical Active Under Contract
-
2025-08-29$205,000 Active
-
2017-01-18soldstatus $159,000
-
2017-01-04soldstatus $159,000
-
2017-01-04soldstatus $159,000 Sold
-
2016-11-24status Contract
-
2016-11-09$159,900 Active
-
2016-07-25soldstatus $47,000
-
2016-07-25soldstatus $47,000 Sold
-
2016-07-16status Contract
-
2016-06-27historical Temporarily Off-Market
-
2016-06-18$44,900 Active
-
2004-08-26soldstatus $92,500
-
2004-08-13soldstatus $92,500
-
2004-06-15historical
-
2004-03-17$92,500
ⓘ Source: listings_history table (triggers on properties + properties_extension) + one-shot
backfill from property_details.listing_events for pre-trigger history.
Tax reassessment forecast MD · Partial reset (capped growth)
- Current annual tax
- $4,000 · $333/mo
- Projected year-2 tax
- $4,000 · $333/mo
- Expected delta
- $0/yr ($0/mo · 0.0%)
ⓘ Screening estimate from a state-policy table — verify with the county assessor before closing.
Climate risk First Street
- Flood 1/10 Low FEMA zone X (unshaded) · 0% chance over 30 yrs
- Wildfire 1/10 Low
- Heat 6/10 Major 7 d/yr ≥103°F today · 15 d/yr by 30 yrs out
- Wind 5/10 Major 24% chance of damaging wind over 30 yrs
- Air quality 3/10 Moderate 3 unhealthy d/yr today · 4 by 30 yrs out
Nearby sold comps map
Loading sold comps map…
Walkable amenities ~0.75 mi
Loading nearby amenities…
Taxation est. · year 1
- Rental income
- $28,577
- − Mortgage interest
- −$6,722
- − Property taxes
- −$4,000
- − Insurance
- −$600
- − Repairs & maintenance
- −$2,286
- − Management
- −$2,286
- − Depreciation
- −$3,491
- Taxable income
- $9,192
- Est. tax owed @ 24.0%
- −$2,206
- After-tax cash flow
- $8,218/yr
For passive investors: Depreciation is non-cash, so a rental often shows a tax loss while cash-flowing — sheltering income. Rental losses are passive: they offset passive income freely, and up to $25,000/yr can offset ordinary (W-2) income if you actively participate and your MAGI is under $100k (phasing out to $0 by $150k); unused losses carry forward. On sale, claimed depreciation is recaptured at up to 25%, and gains may owe capital-gains tax (a 1031 exchange can defer both). Figures are a year-1 estimate at your 24.0% rate — not tax advice; consult a CPA.
Schools (NCES district)
- District
- Baltimore City Public Schools
- NCES district ID
- 2400090
- Math proficiency
- 7% ▼ -9.00%
- Reading proficiency
- 16% ▼ -5.00%
- Median HH income
- $42,108
- Composite
- 10.08/100
- National rank
- #9805
- State rank
- #24 of 24 in MD
Livability — Baltimore
- Score
- 76/100
- State rank
- #90
- US rank
- #3396
Category grades
Schools grade is shown separately in the Schools card above.
Census & demographics
- Census place
- Baltimore, MD
- County
- Baltimore County · 769,527 people
- City population
- 588,727
- Metro
- Baltimore-Columbia-Towson, MD
- Population (ZIP)
- 47,099
- Household income
- $67,060
- Rent vs Own
- Severe rent burden
- 2139.0
Population outlook (Baltimore County) Hauer SSP2
- Today (2025)
- 624,249 people
- By 2030
- 621,541 · -0.4%
- By 2040
- 609,756 · -2.3%
- By 2050
- 597,249 · -4.3%
- By 2075
- 552,236 · -11.5%
- By 2100
- 513,934 · -17.7%
Race, ethnicity, and origin ACS 2023
- Neighborhood character
- Predominantly Black (78%)
- Race & ethnicity
- Black 78% White 8% Hispanic / Latino 7% Two or more races 5% Asian 3%
- Hispanic origin (detail)
- Puerto Rican 1%
- Common ancestry
- Swedish 1%
- Foreign-born
- 13% · Canada, Philippines, South Korea
- Languages at home
- 86% English-only · Spanish 4% French/Haitian/Cajun 1% Other Asian/Pacific 1%
Political lean MEDSL · Baltimore
- 2024 margin
- Solid D (+73.0) · D 85.2% · R 12.2% · Other 2.6%
- 2008→2024 swing
- -2.5pp toward R · 2008: 75.5pp · 2024: 73.0pp
- All cycles
- 2024: D+73.0 2020: D+76.6 2016: D+74.6 2012: D+76.4 2008: D+75.5
Not yet ingested
- Civics
- —
Market trends
- HPI YoY
- ▲ 9.50%
- Current HPI
- 843.63
- Rent YoY
- ▲ 5.23%
- Metro
- Baltimore-Columbia-Towson, MD
- State GDP YoY
- ▲ 2.97%
- F500 in state
- 12
Industry mix (Fortune 500 HQ in MD)
| Industry | F500 HQs | Revenue |
|---|---|---|
| Aerospace / Defense | 1 | $71B |
|
||
| Utilities | 1 | $25B |
|
||
| Hotels | 1 | $24B |
|
||
| Consumer Goods | 1 | $7B |
|
||
| Real Estate | 1 | $6B |
|
||
| Chemicals | 1 | $2B |
|
||
Price history
+29.7% since first listed20 events — show timeline
- 2026-05-11 Pending — BRIGHT MLS
- 2026-04-22 Listed $120,000 BRIGHT MLS
- 2025-11-17 Listing Removed — BRIGHT MLS
- 2025-11-15 Relisted — BRIGHT MLS
- 2025-09-23 Contingent — BRIGHT MLS
- 2025-08-29 Listed $205,000 BRIGHT MLS
- 2017-01-18 Sold (Public Records) $159,000 Public Records
- 2017-01-04 Sold (MLS) $159,000 MRIS
- 2017-01-04 Sold (MLS) $159,000 BRIGHT MLS
- 2016-11-24 Pending — MRIS
- 2016-11-09 Listed $159,900 MRIS
- 2016-07-25 Sold (MLS) $47,000 MRIS
- 2016-07-25 Sold (MLS) $47,000 BRIGHT MLS
- 2016-07-16 Pending — MRIS
- 2016-06-27 Delisted — MRIS
- 2016-06-18 Listed $44,900 MRIS
- 2004-08-26 Sold (Public Records) $92,500 Public Records
- 2004-08-13 Sold (MLS) $92,500 MRIS
- 2004-06-15 Delisted — MRIS
- 2004-03-17 Listed $92,500 MRIS
Property tax history
+3.7%/yrLatest (2025): $4,000 · +8.3% YoY. Source: county tax records.
Cash-flow waterfall
monthlySold comps — $/sqft
last 12 mo · ≤1 miLoading sold comps…