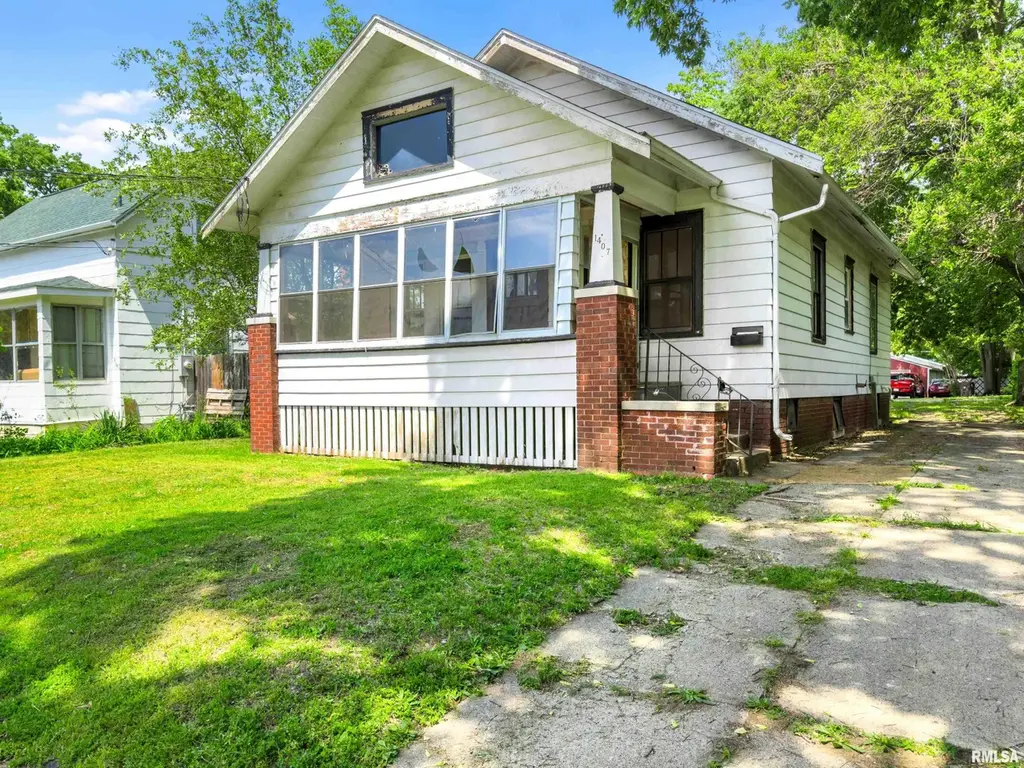
1407 NE Madison Ave · Peoria, IL
Flood risk 1/10 · Minimal
- FEMA flood zone
- X
- Chance of flooding over 30 yrs
- 0.0%
- Est. flood insurance / yr
- $473 – $860
Fire risk 1/10 · Minimal
- Est. fire insurance / yr
- $804 – $1,492
Heat risk 3/10 · Minor
- Hot days now (above 105°F)
- 7 days/yr
- Hot days in 30 yrs
- 18 days/yr
Wind risk 2/10 · Minimal
- Chance of severe wind over 30 yrs
- 1.0%
Air-quality risk 3/10 · Minor
- Unhealthy air days now
- 1 days/yr
- Unhealthy air days in 30 yrs
- 3 days/yr
Risk factors via First Street. Map © Google.
Why this score? — see what drove the C+ grade
The composite is a weighted blend of 9 inputs, each scored 0–100. Each bar is that input's sub-score; the figure is the points it added to the 100-point composite (weight × sub-score).
- Cash flow +30.0/30.0
- 1% rule +10.0/10.0
- DSCR +10.0/10.0
- Livability +3.7/5.0
- Rent growth +3.4/5.0
- Condition / age +2.5/5.0
- Schools +1.1/10.0
- ARV discount +0.0/15.0
- Appreciation +0.0/10.0
$50,000
🖨 Deal sheet 📄 Offer letter ✓ Due diligence
Listing remarks MLS
This property is Occupied: NO VIEWINGS of this property. Please DO NOT DISTURB the occupant. Any attempts to access the property or disturbance of the occupant may be considered trespassing. Price is reflective of occupancy. "As is" cash only sale with no physical access, including no contingencies or inspections. Buyer assumes all responsibility and liability for any occupancy, and assumes all responsibility, liability and cost of taking possession. Neither seller or listing agent have seen the interior - all measurements estimated or taken from public record. Per RMLS rules this listing has to be placed in a non-active status until access can be granted
Key facts
- Covered front porch
- Updated electrical
- New plumbing
Tags
Property features AI
Exterior
- Parking: On-street parking
- Utilities: Public water; Public sewer
- Home design: Single-family residence; Built in 1925; Total living area approximately 948
- Construction: Shingle roof; Full, unfinished basement
- Exterior features: Level, wooded lot; Paved road access
Interior
- Kitchen: Kitchen with laminate flooring (approx. 13' x 11')
- Bedrooms: 2 bedrooms (main level: two bedrooms listed; one is 13' x 10', the other is 12' x 9')
- Flooring: Carpet in most living areas and bedrooms; Laminate in the kitchen
- Bathrooms: 1 full bathroom
- Heating & cooling: Forced air heating; Gas water heater
- Interior features: Cable available; Ceiling fans
Neighborhood map
What this means for you Summary
Snapshot
- This is a 2-bed/1.0-bath single-family listed at $50k.
Deal economics
- At list price, monthly cash flow is $468 ($6k/yr) — positive.
- The deal already cash-flows at list — no discount required.
- Meets the 1% rule at list price ($1k rent vs $50k).
- Cap rate 17.5% vs local median 5.6% in Peoria — top-decile yield for the area; either an underpriced asset or a hidden risk that comps aren't pricing in. Stress-test before assuming the spread holds.
Location & tenants
- Location reads 73/100 on livability (#270 in IL) — a middle-class / working-renter tenant base. Strengths: commute A+, cost of living A+, housing A+; Watch: employment D+, crime F.
- Peoria SD 150 (urban): math 11% / reading 14% proficiency, ranked #554 of 620 in IL (top 89%) — low school quality limits family demand, transient renter base, plan for 1-2y turnover; 70% free/reduced lunch — lower-income household profile, screen leases tightly.
- Zoned schools: Manual High School (math 2% / reading 2%, grade F, #659 of 693 statewide, top 100%, 656 students, 0% FRL) — zoned schools average 0% FRL vs 70% district-wide (70 pts lower); this property's tenant base skews higher-income than the district average.
- Market conditions: Rents rising (+3.5%/yr); 104 active listings in the ZIP; 11 comparable units currently listed for rent nearby; rentals at typical pace (median 21d on market — plan ~3-4 weeks tenant-placement turnaround); lower-income renter base — watch delinquency; 73 units permitted in Peoria County in 2024 (0 in 5+ unit buildings).
Forward outlook
- Local home prices are declining (-3.0%/yr); year-one equity from $346 of loan paydown is wiped out by about $2k of value loss. Plan a longer hold.
- Peoria County population projected at -11% by 2050 — secular population decline; favor cash flow + early exit over multi-decade hold.
- At projected returns (-3.0% appreciation + 3.5% rent growth), your $14k cash investment doubles in ~3 years — after that, you're playing with house money.
Negotiation context
- Only 4 days on market — expect competitive offers; lowballing is unlikely to land.
- 3 sale attempts since 5y ago with the ask held roughly flat each time — persistent listings suggest the price (not the market) is what's stuck; bring a comps-based counter.
- Current owner paid $18k; list at $50k implies a 170% gain — meaningful room to come down on a strong offer.
Risks & watch-outs
- Watch-outs: built in 1925 — expect roof / HVAC / electrical / plumbing capex.
Questions for the listing agent
- Built in 1925 — when were the roof, HVAC, electrical panel, plumbing, and water heater last replaced?
- Is there a deadline driving the sale (1031 exchange, divorce, estate, relocation)? That informs how much negotiation room exists.
- Schools are F-rated, which usually means shorter tenancies and higher turnover. Who's the typical renter profile here, and what's been the actual vacancy rate?
- Crime grade is F in this area — have there been break-ins, vandalism, or insurance claims at this property in the last 3 years? What carrier currently insures it and at what premium?
- What's the average days-on-market for RENTAL listings here right now (not sales)? A rising rental-DOM trend means longer vacancies and softer asking-rent achievability than the comps imply.
- What's the recent tenant-quality profile in this submarket — average credit score on applications, eviction rate, late-payment / NSF rate, and stable-employment percentage? A property-management company in the area should have these aggregated.
- How much new for-sale + rental construction is in the pipeline within 1–3 miles? Heavy new supply typically softens prices + rents 12–24 months out; constrained supply supports both.
Investment metrics
- 1% rule
- 2.02% ✓
- Cap rate
- 17.52%
- Cash-on-cash
- 40.10%
- DSCR
- 2.78
- GRM
- 4.1
CMA / ARV
- ARV (on-the-fly)
- $35,264
- Comps found
- 11
Show comp detail 11 sales within ~0.75 mi
| Address | Dist | Beds/Ba | Sqft | Sold | Price | $/sf | Match |
|---|---|---|---|---|---|---|---|
| 502 Caroline St | 0.07mi | 2/1.0 | 912 (-2%) | 9mo | $14,000 | $15 | 86 |
| 803 Caroline St | 0.27mi | 2/1.0 | 910 (-2%) | 4mo | $49,000 | $54 | 81 |
| 1305 NE Monroe St | 0.12mi | 2/1.0 | 1,042 (+12%) | 1mo | $50,000 | $48 | 74 |
| 1622 NE Jefferson St | 0.23mi | 2/1.5 | 837 (-10%) | 7mo | $26,000 | $31 | 65 |
| 716 E Kansas St | 0.71mi | 2/1.0 | 896 (-3%) | 2mo | $26,666 | $30 | 60 |
| 1220 NE Bond St | 0.31mi | 2/1.0 | 1,024 (+10%) | 12mo | $62,000 | $61 | 58 |
| 223 NE Rock Island Ave | 0.73mi | 2/1.0 | 984 (+6%) | 0mo | $25,000 | $25 | 56 |
| 2204 N Atlantic Ave | 0.73mi | 1/1.0 (-1) | 912 (-2%) | 12mo | $35,000 | $38 | 48 |
| 1918 N Indiana Ave | 0.72mi | 2/1.0 | 970 (+4%) | 21mo | $27,100 | $28 | 41 |
| 701 E Kansas Ave | 0.75mi | 3/1.0 (+1) | 1,025 (+10%) | 15mo | $50,000 | $49 | 30 |
| 2306 NE Perry Ave | 0.67mi | 3/1.0 (+1) | 794 (-14%) | 24mo | $38,000 | $48 | 20 |
Match score weights: distance 35% · size 25% · config 20% · recency 20%. Top-matched comps best support the ARV.
Projected returns pro-forma
-3.0% appreciation · 3.49% rent growth · sell at horizon
- IRR
- 37.0%
- Equity multiple
- 2.59×
- Total profit
- $22,198
- Equity at exit
- $7,455
- IRR
- 43.9%
- Equity multiple
- 5.27×
- Total profit
- $59,790
- Equity at exit
- $4,323
Cash invested: $14,000 (down + closing). Projections, not guarantees.
Landlord ↔ Tenant lean methodology
- Overall (STATE)
- 43 Moderately Tenant-Leaning
- State Illinois
- 43 Moderately Tenant-Leaning · D+7
- County
- — inherits STATE
- City
- — inherits STATE
ZIP-level market 61603
- Home prices YoY
- -31.8%
- Rents YoY
- 3.5%
- Active inventory
- 104
- Price-to-rent
- 4.1×
Monthly cashflow live
- Estimated rent
- $1,009 high interval (Pro) →
- Mortgage (P&I)
- −$262
- Tax from tax record
- −$47 /mo · $558/yr
- Insurance
- −$21
- HOA
- −$0
- Vacancy / Maint / Mgmt
- −$212
- Net cashflow
- $468
Break-even live
UW: 25.0% down · 7.5% · 30yr · 1.5% tax · 5.0% vac · 8.0% maint · 8.0% mgmt
Financing live
Cash to close
- Down payment
- $12,500
- Closing costs
- $1,500
- Reserves months
- —
- Total cash needed
- —
Loan-product check · same deal, 3 products live
Conventional
25% down · 7.5% · 30yr
- Down + closing
- —
- Monthly P&I
- —
- Monthly cashflow
- —
- DSCR
- —
- Eligible?
- —
Personal DTI + credit; lowest rate.
DSCR
20% down · 8.5% · 30yr
- Down + closing
- —
- Monthly P&I
- —
- Monthly cashflow
- —
- DSCR
- —
- Eligible?
- —
No personal income docs; deal must DSCR.
Hard money
10% down · 12.0% · 12mo
- Down + closing
- —
- Monthly P&I
- —
- Monthly cashflow
- —
- DSCR
- —
- Eligible?
- —
Short-term bridge; refi at stabilization.
Rent comps 11 comps
| Address | Beds | Baths | Sqft | Rent | $/sqft | DOM | Units | Dist |
|---|---|---|---|---|---|---|---|---|
| 506 Caroline St Unit B Peoria, IL | 2.0 | 1.0 | 1000 | $900 | $0.90 | 13d | 1 | 0.08mi |
| 901 NE Glen Oak Ave Unit 2 Peoria, IL | 3.0 | 1.0 | 1120 | $1,200 | $1.07 | 21d | 1 | 0.57mi |
| 2121 N Prospect Rd Peoria, IL | 3.0 | 1.0 | 946 | $802 | $0.85 | 13d | 1 | 0.65mi |
| 2302 NE Monroe St Peoria, IL | 3.0 | 1.0 | 1100 | $875 | $0.80 | 13d | 1 | 0.73mi |
| 1505 N Peoria Ave Peoria, IL | 1.0 | 1.0 | 525 | $1,006 | $1.92 | 13d | 4 | 0.87mi |
| 123 SW Jefferson Ave Unit E6W Peoria, IL | 2.0 | 1.0 | 868 | $1,495 | $1.72 | 21d | 1 | 1.14mi |
| 123 SW Jefferson Ave Unit E15SW Peoria, IL | 2.0 | 2.0 | 1100 | $1,750 | $1.59 | 13d | 1 | 1.14mi |
| 737 E Gift Ave Unit 737 Peoria, IL | 2.0 | 1.0 | 800 | $1,125 | $1.41 | 44d | 1 | 1.16mi |
| 416 W Main St Unit A Peoria, IL | 2.0 | 1.0 | 1050 | $950 | $0.90 | 44d | 1 | 1.30mi |
| 511 W Elizabeth St Unit A Peoria, IL | 1.0 | 1.0 | 850 | $800 | $0.94 | 44d | 1 | 1.34mi |
| 311 SW Water St Unit 301 Peoria, IL | 1.0 | 1.0 | 635 | $1,300 | $2.05 | 44d | 1 | 1.35mi |
Listing history 6 events
-
2026-05-30statusdays on market $50,000 Pending 4 DOM
-
2026-05-26$50,000 Active
-
2022-02-28soldstatus $18,500 679-char remark
Show marketing remark (679 chars)
This property is Occupied: NO VIEWINGS of this property. Please DO NOT DISTURB the occupant. Any attempts to access the property or disturbance of the occupant may be considered trespassing. Price is reflective of occupancy. "As is" cash only sale with no physical access, including no contingencies or inspections. Buyer assumes all responsibility and liability for any occupancy, and assumes all responsibility, liability and cost of taking possession. Neither seller or listing agent have seen the interior - all measurements estimated or taken from public record. Per RMLS rules this listing has to be placed in a non-active status until access can be granted
-
2021-12-13$18,900 679-char remark
Show marketing remark (679 chars)
This property is Occupied: NO VIEWINGS of this property. Please DO NOT DISTURB the occupant. Any attempts to access the property or disturbance of the occupant may be considered trespassing. Price is reflective of occupancy. "As is" cash only sale with no physical access, including no contingencies or inspections. Buyer assumes all responsibility and liability for any occupancy, and assumes all responsibility, liability and cost of taking possession. Neither seller or listing agent have seen the interior - all measurements estimated or taken from public record. Per RMLS rules this listing has to be placed in a non-active status until access can be granted
-
2021-10-14soldstatus $14,500 678-char remark
Show marketing remark (678 chars)
Asset is being sold in an upcoming auction (occupied). All initial offers must be submitted via PropOffers.com by the Selling Agent ONLY. All offers must be submitted on PropOffers.com. "Subject property is being sold occupied with any and all occupants in AS IS/WHERE IS condition. Neither the seller nor the listing broker can verify the existence of any lease agreement, either written or verbal, nor any rental amount being paid, due or owing. Please DO NOT disturb the occupants. Access for inspections or other purposes is NOT guaranteed - contact listing broker to confirm if accessible. Buyer is assuming ALL responsibility for any necessary eviction action."
-
2021-08-17$32,000 678-char remark
Show marketing remark (678 chars)
Asset is being sold in an upcoming auction (occupied). All initial offers must be submitted via PropOffers.com by the Selling Agent ONLY. All offers must be submitted on PropOffers.com. "Subject property is being sold occupied with any and all occupants in AS IS/WHERE IS condition. Neither the seller nor the listing broker can verify the existence of any lease agreement, either written or verbal, nor any rental amount being paid, due or owing. Please DO NOT disturb the occupants. Access for inspections or other purposes is NOT guaranteed - contact listing broker to confirm if accessible. Buyer is assuming ALL responsibility for any necessary eviction action."
ⓘ Source: listings_history table (triggers on properties + properties_extension) + one-shot
backfill from property_details.listing_events for pre-trigger history.
Tax reassessment forecast IL · Partial reset (capped growth)
- Current annual tax
- $558 · $47/mo
- Projected year-2 tax
- $847 · $71/mo
- Expected delta
- +$288/yr (+$24/mo · 51.7%)
ⓘ Screening estimate from a state-policy table — verify with the county assessor before closing.
Climate risk First Street
- Flood 1/10 Low FEMA zone X · 0% chance over 30 yrs
- Wildfire 1/10 Low
- Heat 3/10 Moderate 7 d/yr ≥105°F today · 18 d/yr by 30 yrs out
- Wind 2/10 Low 100% chance of damaging wind over 30 yrs
- Air quality 3/10 Moderate 1 unhealthy d/yr today · 3 by 30 yrs out
Nearby sold comps map
Loading sold comps map…
Walkable amenities ~0.75 mi
Loading nearby amenities…
Taxation est. · year 1
- Rental income
- $12,112
- − Mortgage interest
- −$2,801
- − Property taxes
- −$558
- − Insurance
- −$250
- − Repairs & maintenance
- −$969
- − Management
- −$969
- − Depreciation
- −$1,455
- Taxable income
- $5,110
- Est. tax owed @ 24.0%
- −$1,227
- After-tax cash flow
- $4,387/yr
For passive investors: Depreciation is non-cash, so a rental often shows a tax loss while cash-flowing — sheltering income. Rental losses are passive: they offset passive income freely, and up to $25,000/yr can offset ordinary (W-2) income if you actively participate and your MAGI is under $100k (phasing out to $0 by $150k); unused losses carry forward. On sale, claimed depreciation is recaptured at up to 25%, and gains may owe capital-gains tax (a 1031 exchange can defer both). Figures are a year-1 estimate at your 24.0% rate — not tax advice; consult a CPA.
Schools (NCES district)
- District
- Peoria SD 150
- NCES district ID
- 1731230
- Math proficiency
- 11% ▼ -5.00%
- Reading proficiency
- 14% ▼ -4.00%
- Median HH income
- $41,951
- Composite
- 10.92/100
- National rank
- #9751
- State rank
- #554 of 620 in IL
Livability — Peoria
- Score
- 73/100
- State rank
- #270
- US rank
- #5096
Category grades
Schools grade is shown separately in the Schools card above.
Census & demographics
- Census place
- Peoria, IL
- County
- Peoria County · 120,495 people
- City population
- 114,670
- Metro
- Peoria, IL
- Population (ZIP)
- 15,356
- Household income
- $41,618
- Rent vs Own
- Severe rent burden
- 849.0
Population outlook (Peoria County) Hauer SSP2
- Today (2025)
- 183,007 people
- By 2030
- 179,643 · -1.8%
- By 2040
- 171,782 · -6.1%
- By 2050
- 163,508 · -10.7%
- By 2075
- 140,178 · -23.4%
- By 2100
- 114,493 · -37.4%
Race, ethnicity, and origin ACS 2023
- Neighborhood character
- Diverse neighborhood (Simpson 0.68)
- Race & ethnicity
- Black 43% White 36% Two or more races 12% Hispanic / Latino 10% Asian 1%
- Hispanic origin (detail)
- Mexican 7%
- Common ancestry
- Italian 2% Slovak 1% Lithuanian 1%
- Foreign-born
- 7% · Canada
- Languages at home
- 91% English-only · Spanish 6% Tagalog/Filipino 1%
Political lean MEDSL · Peoria
- 2024 margin
- Toss-up / Even · D 51.5% · R 46.9% · Other 1.6%
- 2008→2024 swing
- -9.2pp toward R · 2008: 13.9pp · 2024: 4.7pp
- All cycles
- 2024: D+4.7 2020: D+6.3 2016: D+2.8 2012: D+4.4 2008: D+13.9
Not yet ingested
- Civics
- —
Market trends
- HPI YoY
- ▼ -65.98%
- Current HPI
- 141.5343
- Rent YoY
- ▲ 3.49%
- Metro
- Peoria, IL
- State GDP YoY
- ▲ 1.59%
- F500 in state
- 60
Industry mix (Fortune 500 HQ in IL)
| Industry | F500 HQs | Revenue |
|---|---|---|
| Insurance | 4 | $201B |
|
||
| Consumer Goods | 4 | $87B |
|
||
| Industrial Machinery | 3 | $64B |
|
||
| Healthcare | 2 | $55B |
|
||
| Retail / Pharmacy | 1 | $148B |
|
||
| Agriculture / Food | 1 | $86B |
|
||
Price history
+56.2% since first listed5 events — show timeline
- 2026-05-26 Listed $50,000 RMLSA as Distributed by MLS Grid
- 2022-02-28 Sold (MLS) $18,500 RMLSA as Distributed by MLS Grid
- 2021-12-13 Listed $18,900 RMLSA as Distributed by MLS Grid
- 2021-10-14 Sold (MLS) $14,500 RMLSA as Distributed by MLS Grid
- 2021-08-17 Listed $32,000 RMLSA as Distributed by MLS Grid
Property tax history
-3.6%/yrLatest (2024): $558 · -27.1% YoY. Source: county tax records.
Cash-flow waterfall
monthlySold comps — $/sqft
last 12 mo · ≤1 miLoading sold comps…