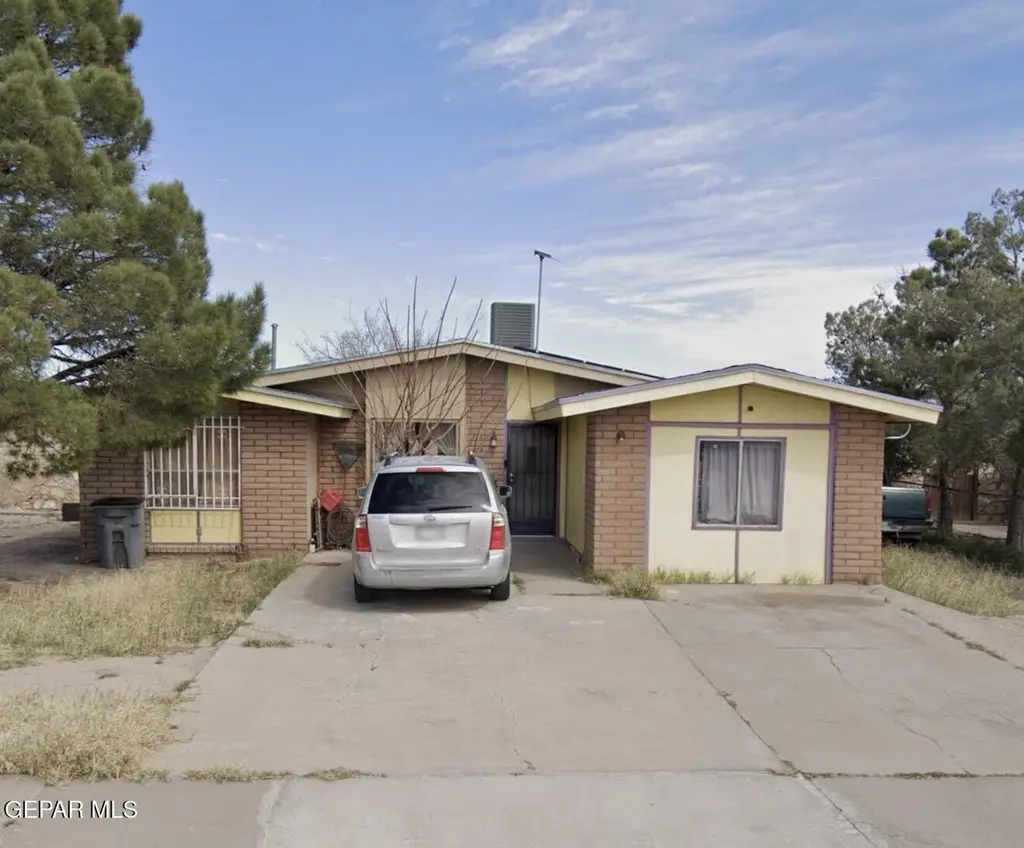
9339 Cannes Cir · El Paso, TX
Flood risk 1/10 · Minimal
- FEMA flood zone
- X (unshaded)
- Chance of flooding over 30 yrs
- 0.0%
- Est. flood insurance / yr
- $507 – $1,088
Fire risk 1/10 · Minimal
- Est. fire insurance / yr
- $1,222 – $2,270
Heat risk 6/10 · Moderate
- Hot days now (above 102°F)
- 7 days/yr
- Hot days in 30 yrs
- 25 days/yr
Wind risk 1/10 · Minimal
- Chance of severe wind over 30 yrs
- —
Air-quality risk 3/10 · Minor
- Unhealthy air days now
- 2 days/yr
- Unhealthy air days in 30 yrs
- 3 days/yr
Risk factors via First Street. Map © Google.
Why this score? — see what drove the C- grade
The composite is a weighted blend of 9 inputs, each scored 0–100. Each bar is that input's sub-score; the figure is the points it added to the 100-point composite (weight × sub-score).
- Cash flow +18.0/30.0
- ARV discount +7.5/15.0
- 1% rule +6.2/10.0
- DSCR +5.6/10.0
- Rent growth +5.0/5.0
- Livability +4.0/5.0
- Schools +2.6/10.0
- Condition / age +2.5/5.0
- Appreciation +0.0/10.0
$140,000
🖨 Deal sheet (PDF) 📄 Offer letter ✓ Due diligence
Listing remarks
Welcome to this charming home located just a few minutes from Del Valle High School, I10, and Loop 375. It offers comfort, potential, and convenience. Featuring over 1300 square feet with a spacious lot, 4 bedrooms, and 2 full baths. This home is full of opportunities whether you want to make it your own or add to your investment portfolio. Schedule your private showing today!
Key facts
- 9,450 sq ft lot
- Garage
- Built 1983
Neighborhood map
What this means for you Summary
Snapshot
- This is a 4-bed/1.5-bath single-family listed at $140k.
Deal economics
- At list price, monthly cash flow is $119 ($1k/yr) — positive.
- The deal already cash-flows at list — no discount required.
- Meets the 1% rule at list price ($2k rent vs $140k).
Location & tenants
- Location reads 81/100 on livability (#23 in TX, #1,375 nationally) — a professional / high-income tenant draw. Strengths: commute A+, cost of living A+, housing A+; Watch: employment D+.
- Ysleta ISD (urban): math 27% / reading 35% proficiency, ranked #626 of 826 in TX (top 76%) — families likely to look elsewhere, expect single-tenant / working-renter base with shorter leases; 68% free/reduced lunch — lower-income household profile, screen leases tightly.
- Zoned schools: Lancaster El (math 20% / reading 28%, grade F, #3,221 of 4,322 statewide, top 75%, 594 students, 89% FRL); Del Valle Middle (math 20% / reading 25%, grade F, #1,341 of 1,662 statewide, top 82%, 1,122 students, 83% FRL); Del Valle H S (math 48% / reading 41%, grade F, #652 of 1,632 statewide, top 43%, 1,957 students, 78% FRL).
- Market conditions: Rents rising fast (+11.8%/yr); 103 active listings in the ZIP; 5 comparable units currently listed for rent nearby; rentals lingering (median 45d on market — plan ~5-8 weeks vacancy on turnover, expect pricing pressure); 60% of comp listings sitting > 30 days — soft ceiling on asking rent; lower-income renter base — watch delinquency; 2,196 units permitted in El Paso County in 2024 (143 in 5+ unit buildings).
- At $1,566/mo this rent would consume 45% of the median local household income ($42k/yr) (locally 1390% of renters already pay >50% of income on rent) — very limited rent-growth headroom before tenants either downsize or default.
Forward outlook
- Local home prices are declining (-3.0%/yr); year-one equity from $968 of loan paydown is wiped out by about $4k of value loss. Plan a longer hold.
- El Paso County population projected at +10% by 2050 — modest demand growth; plan on rents tracking national, not racing it.
- At projected returns (-3.0% appreciation + 8.0% rent growth), your $39k cash investment doubles in ~10 years — after that, you're playing with house money.
Negotiation context
- Only 0 days on market — expect competitive offers; lowballing is unlikely to land.
Risks & watch-outs
- Watch-outs: property tax is 2.8% of price.
- Climate carrying-cost: extreme-heat days projected 7→25/yr by 2055 (HVAC capex compounding) — expect insurance premiums to compound above CPI over the hold.
Questions for the listing agent
- Property tax is high relative to price — has the assessment been appealed recently, and will the sale trigger a re-assessment?
- Is there a deadline driving the sale (1031 exchange, divorce, estate, relocation)? That informs how much negotiation room exists.
- Schools are B-rated — typically a magnet for longer-tenancy family renters. What's the average tenant stay here, and is there a school-zone premium baked into asking?
- What's the average days-on-market for RENTAL listings here right now (not sales)? A rising rental-DOM trend means longer vacancies and softer asking-rent achievability than the comps imply.
- What's the recent tenant-quality profile in this submarket — average credit score on applications, eviction rate, late-payment / NSF rate, and stable-employment percentage? A property-management company in the area should have these aggregated.
- How much new for-sale + rental construction is in the pipeline within 1–3 miles? Heavy new supply typically softens prices + rents 12–24 months out; constrained supply supports both.
Investment metrics
- 1% rule
- 1.12% ✓
- Cap rate
- 7.31%
- Cash-on-cash
- 3.65%
- DSCR
- 1.16
- GRM
- 7.5
CMA / ARV
No comps found within radius.
Projected returns pro-forma
-3.0% appreciation · 8.0% rent growth · sell at horizon
- IRR
- -4.3%
- Equity multiple
- 0.83×
- Total profit
- $-6,702
- Equity at exit
- $20,874
- IRR
- 10.9%
- Equity multiple
- 2.07×
- Total profit
- $42,069
- Equity at exit
- $12,105
Cash invested: $39,200 (down + closing). Projections, not guarantees.
Landlord ↔ Tenant lean methodology
- Overall (STATE)
- 87 Strongly Landlord-Friendly
- State Texas
- 87 Strongly Landlord-Friendly · R+5
- County
- — inherits STATE
- City
- — inherits STATE
ZIP-level market 79907
- Home prices YoY
- -9.8%
- Rents YoY
- 11.8%
- Active inventory
- 103
- Price-to-rent
- 7.5×
Monthly cashflow live
- Estimated rent
- $1,566 high interval (Pro) →
- Mortgage (P&I)
- −$734
- Tax from tax record
- −$325 /mo · $3,900/yr
- Insurance
- −$58
- HOA
- −$0
- Vacancy / Maint / Mgmt
- −$329
- Net cashflow
- $119
Break-even live
Sensitivity live
| Price | -10% $198 | -5% $159 | +0% $119 | +5% $80 | +10% $40 |
|---|---|---|---|---|---|
| Rent | -10% $-4 | -5% $57 | +0% $119 | +5% $181 | +10% $243 |
| Rate | -1.0pp $190 | -0.5pp $155 | base $119 | +0.5pp $83 | +1.0pp $46 |
UW: 25.0% down · 7.5% · 30yr · 1.5% tax · 5.0% vac · 8.0% maint · 8.0% mgmt
Financing live
Cash to close
- Down payment
- $35,000
- Closing costs
- $4,200
- Reserves months
- —
- Total cash needed
- —
Loan-product check · same deal, 3 products live
Conventional
25% down · 7.5% · 30yr
- Down + closing
- —
- Monthly P&I
- —
- Monthly cashflow
- —
- DSCR
- —
- Eligible?
- —
Personal DTI + credit; lowest rate.
DSCR
20% down · 8.5% · 30yr
- Down + closing
- —
- Monthly P&I
- —
- Monthly cashflow
- —
- DSCR
- —
- Eligible?
- —
No personal income docs; deal must DSCR.
Hard money
10% down · 12.0% · 12mo
- Down + closing
- —
- Monthly P&I
- —
- Monthly cashflow
- —
- DSCR
- —
- Eligible?
- —
Short-term bridge; refi at stabilization.
Rent comps 5 comps
| Address | Beds | Baths | Sqft | Rent | $/sqft | DOM | Units | Dist |
|---|---|---|---|---|---|---|---|---|
| 9467 Landry McKee Ln Unit B El Paso, TX | 3.0 | 2.0 | 1230 | $1,575 | $1.28 | 44d | 1 | 0.32mi |
| 9488 Landry McKee Ln Unit B El Paso, TX | 3.0 | 2.0 | 1200 | $1,295 | $1.08 | 44d | 1 | 0.33mi |
| 9488 Landry McKee Ln Unit A El Paso, TX | 3.0 | 2.0 | 1200 | $1,195 | $1.00 | 15d | 1 | 0.33mi |
| 9101 Tenango Dr El Paso, TX | 3.0 | 2.0 | 1000 | $1,500 | $1.50 | 44d | 1 | 0.65mi |
| 9397 Senor Tedd Way Unit A El Paso, TX | 4.0 | 2.5 | 1600 | $1,795 | $1.12 | 24d | 1 | 0.82mi |
Listing history 3 events
-
2026-05-26$140,000
-
2026-05-26historical
-
1988-10-11soldstatus
ⓘ Source: listings_history table (triggers on properties + properties_extension) + one-shot
backfill from property_details.listing_events for pre-trigger history.
Tax reassessment forecast TX · Resets to sale price
- Current annual tax
- $3,900 · $325/mo
- Projected year-2 tax
- $3,900 · $325/mo
- Expected delta
- $0/yr ($0/mo · 0.0%)
ⓘ Screening estimate from a state-policy table — verify with the county assessor before closing.
Climate risk First Street
- Flood 1/10 Low FEMA zone X (unshaded) · 0% chance over 30 yrs
- Wildfire 1/10 Low
- Heat 6/10 Major 7 d/yr ≥102°F today · 25 d/yr by 30 yrs out
- Wind 1/10 Low
- Air quality 3/10 Moderate 2 unhealthy d/yr today · 3 by 30 yrs out
Nearby sold comps map
Loading sold comps map…
Walkable amenities ~0.75 mi
Loading nearby amenities…
Taxation est. · year 1
- Rental income
- $18,786
- − Mortgage interest
- −$7,842
- − Property taxes
- −$3,900
- − Insurance
- −$700
- − Repairs & maintenance
- −$1,503
- − Management
- −$1,503
- − Depreciation
- −$4,073
- Taxable loss
- −$735
- Est. tax savings @ 24.0%
- +$176
- After-tax cash flow
- $1,607/yr
For passive investors: Depreciation is non-cash, so a rental often shows a tax loss while cash-flowing — sheltering income. Rental losses are passive: they offset passive income freely, and up to $25,000/yr can offset ordinary (W-2) income if you actively participate and your MAGI is under $100k (phasing out to $0 by $150k); unused losses carry forward. On sale, claimed depreciation is recaptured at up to 25%, and gains may owe capital-gains tax (a 1031 exchange can defer both). Figures are a year-1 estimate at your 24.0% rate — not tax advice; consult a CPA.
Schools (NCES district)
- District
- Ysleta ISD
- NCES district ID
- 4846680
- Math proficiency
- 27% ▼ -31.00%
- Reading proficiency
- 35% ▼ -11.00%
- Median HH income
- $35,826
- Composite
- 25.65/100
- National rank
- #7400
- State rank
- #626 of 826 in TX
Livability — El Paso
- Score
- 81/100
- State rank
- #23
- US rank
- #1375
Category grades
Schools grade is shown separately in the Schools card above.
Census & demographics
- Census place
- El Paso, TX
- County
- El Paso County · 761,266 people
- City population
- 630,223
- Metro
- El Paso, TX
- Population (ZIP)
- 46,365
- Household income
- $41,617
- Rent vs Own
- Severe rent burden
- 1390.0
Population outlook (El Paso County) Hauer SSP2
- Today (2025)
- 897,899 people
- By 2030
- 922,694 · +2.8%
- By 2040
- 960,492 · +7.0%
- By 2050
- 982,919 · +9.5%
- By 2075
- 997,266 · +11.1%
- By 2100
- 900,630 · +0.3%
Race, ethnicity, and origin ACS 2023
- Neighborhood character
- Predominantly Hispanic (94%)
- Race & ethnicity
- Hispanic / Latino 94% Two or more races 42% White 4% Native American 1% Black 1%
- Hispanic origin (detail)
- Mexican 90%
- Foreign-born
- 28% · Canada
- Languages at home
- 21% English-only · Spanish 78%
Political lean MEDSL · El Paso
- 2024 margin
- D (+15.1) · D 57.0% · R 41.8% · Other 1.2%
- 2008→2024 swing
- -17.4pp toward R · 2008: 32.5pp · 2024: 15.1pp
- All cycles
- 2024: D+15.1 2020: D+35.1 2016: D+43.2 2012: D+32.6 2008: D+32.5
Not yet ingested
- Civics
- —
Market trends
- HPI YoY
- ▼ -27.34%
- Current HPI
- 251.9374
- Rent YoY
- ▲ 11.79%
- Metro
- El Paso, TX
- State GDP YoY
- ▲ 3.95%
- F500 in state
- 110
Industry mix (Fortune 500 HQ in TX)
| Industry | F500 HQs | Revenue |
|---|---|---|
| Energy | 16 | $1,198B |
|
||
| Technology | 5 | $198B |
|
||
| Engineering / Construction | 4 | $72B |
|
||
| Energy Services | 3 | $60B |
|
||
| Utilities | 3 | $41B |
|
||
| Healthcare | 2 | $330B |
|
||
Price history
3 events — show timeline
- 2026-05-26 Listing Removed — GEPARMLS
- 2026-05-26 Listed $140,000 GEPARMLS
- 1988-10-11 Sold (Public Records) — Public Records
Property tax history
+4.4%/yrLatest (2025): $3,900 · +10.7% YoY. Source: county tax records.
Cash-flow waterfall
monthlySold comps — $/sqft
last 12 mo · ≤1 miLoading sold comps…