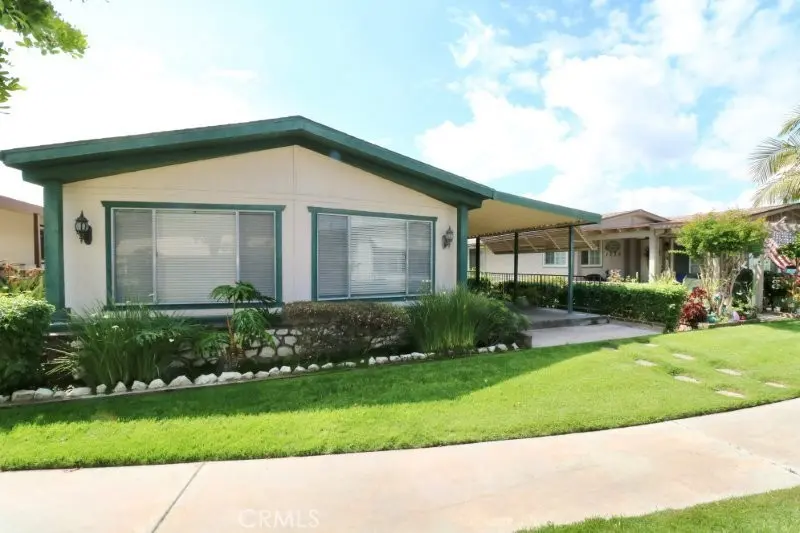
1351 Silver Lake Pl #92 · Brea, CA
Flood risk 1/10 · Minimal
- FEMA flood zone
- X (unshaded)
- Chance of flooding over 30 yrs
- 0.0%
- Est. flood insurance / yr
- $507 – $1,088
Fire risk 2/10 · Minimal
- Est. fire insurance / yr
- $659 – $1,223
Heat risk 6/10 · Moderate
- Hot days now (above 96°F)
- 7 days/yr
- Hot days in 30 yrs
- 22 days/yr
Wind risk 1/10 · Minimal
- Chance of severe wind over 30 yrs
- —
Air-quality risk 5/10 · Moderate
- Unhealthy air days now
- 7 days/yr
- Unhealthy air days in 30 yrs
- 9 days/yr
Risk factors via First Street. Map © Google.
Why this score? — see what drove the B+ grade
The composite is a weighted blend of 9 inputs, each scored 0–100. Each bar is that input's sub-score; the figure is the points it added to the 100-point composite (weight × sub-score).
- Cash flow +29.0/30.0
- ARV discount +15.0/15.0
- DSCR +10.0/10.0
- 1% rule +8.1/10.0
- Schools +5.1/10.0
- Livability +3.8/5.0
- Rent growth +2.9/5.0
- Condition / age +2.2/5.0
- Appreciation +0.0/10.0
$275,000
🖨 Deal sheet 📄 Offer letter ✓ Due diligence
Listing remarks
Senior Park Community 55+. .. Featured Home for Sale: This spacious 2br. , 2ba. , home features 1956 sq. , ft. , of living space. The formal living room features large picture windows with vaulted ceilings overlooking the lush greenbelt. From there you enter the formal dining area with a built-in hutch. Just steps away is the kitchen offering updated oven and gas cook top, and plenty of cabinet and counter space perfect for entertaining family and friends. The large den features a built-in desk area and fire place perfect to cozy up on cold days. Large master suite features a walk-in closet attached bath with walk in shower, linen closet space and a tub for soaking. Just down the hall is th
Key facts
- Updated oven
- Gas cook top
- Lush greenbelt
Tags
Property features AI
Finance
- Other: Access via city streets; paved road frontage; Wheelchair access available; Has view
- Financial info: Land lease in park (monthly)
- HOA & community: Senior community; Park name: Lake Park Brea; Community features include curbs, street lighting, sidewalks and storm drains; Manager approval required for sale; Pets allowed
Exterior
- Parking: Concrete driveway; Attached carport; Additional parking spaces
- Security: Smoke and carbon monoxide detectors; Resident manager
- Utilities: Public/district water; Public sewer; Electricity connected; Natural gas connected; Telephone in street; Cable available or not available (varies)
- Home design: Single-story home; Entry from front door; Faces northwest; Mobile home model: Signature (34' x 64'); Mobile home remains
- Construction: Wood and hardboard construction; Shingle/composition roof; Brick skirt; Pillar/post/pier foundation
- Exterior features: Concrete patio; Rain gutters; Shed (1); Masonry fencing; Landscaped grounds; Greenbelt; Lake on lot and community fishing access; Community pool (in-ground, heated)
Interior
- Kitchen: Garbage disposal; Built-in range; Gas range and gas oven; Electric oven; Refrigerator; Dishwasher; Formica countertops
- Bedrooms: Primary suite; Walk-in closet
- Flooring: Vinyl flooring; Carpet
- Bathrooms: Two full bathrooms; Soaking tub; Walk-in shower; Bathtub
- Heating & cooling: Central heating (furnace); Central air conditioning
- Interior features: Wood product walls; Built-in shelving/units; Formica counters; Mirrored closet doors; Screens on windows; Carbon monoxide and smoke detectors; Resident manager on-site; In-ground, heated community spa
- Laundry & utility: Inside laundry room; Individual laundry room; Washer hookup; Gas and electric dryer hookup; Gas water heater
Neighborhood map
What this means for you Summary
Snapshot
- This is a 2-bed/2.0-bath manufactured listed at $275k. Condition is rated fair.
Deal economics
- At list price, monthly cash flow is $940 ($11k/yr) — positive.
- The deal already cash-flows at list — no discount required.
- Meets the 1% rule at list price ($4k rent vs $275k).
- Recommended offer: $258k (6.0% below list) — sets the bar for market timing.
- Cap rate 10.4% vs local median 2.1% in Brea — top-decile yield for the area; either an underpriced asset or a hidden risk that comps aren't pricing in. Stress-test before assuming the spread holds.
Location & tenants
- Location reads 76/100 on livability (#100 in CA, #3,570 nationally) — a middle-class / working-renter tenant base. Strengths: amenities A+, employment A+, schools A-; Watch: health & safety C-, cost of living F.
- Fullerton Joint Union High (suburban): math 51% / reading 66% proficiency, ranked #82 of 517 in CA (top 16%) — acceptable for families but not a draw, mixed tenant base, ~2y average lease.
- Market conditions: Rents rising (+1.8%/yr); 63 active listings in the ZIP; 9 comparable units currently listed for rent nearby; rentals leasing fast (median 11d on market — plan ~1-2 weeks tenant-placement turnaround); high-income renter base; 6,974 units permitted in Orange County in 2024 (3,839 in 5+ unit buildings).
- This rent runs 35% of the median local income ($124k/yr) — at the standard rent-burdened threshold; future hikes will face affordability resistance.
Forward outlook
- Local home prices are declining (-3.0%/yr); year-one equity from $2k of loan paydown is wiped out by about $8k of value loss. Plan a longer hold.
- Orange County population projected at +14% by 2050 — modest demand growth; plan on rents tracking national, not racing it.
- At projected returns (-3.0% appreciation + 1.8% rent growth), your $77k cash investment doubles in ~10 years — after that, you're playing with house money.
Negotiation context
- It's been on market 65 days — a 6% lower offer ($258k) is reasonable based on typical stale-listing flexibility.
Risks & watch-outs
- Climate carrying-cost: extreme-heat days projected 7→22/yr by 2055 (HVAC capex compounding) — expect insurance premiums to compound above CPI over the hold.
Questions for the listing agent
- It's been on market 65 days. Have you received any prior offers? Is the seller open to a 6% concession, seller financing, or rate buy-down credit?
- Have any recent inspections been done? Can we get a copy of the seller's disclosures and any deferred-maintenance estimates?
- Why hasn't it sold? Are there any deal-killer items the seller is aware of (foundation, flood, title, zoning, code violations)?
- Is there a deadline driving the sale (1031 exchange, divorce, estate, relocation)? That informs how much negotiation room exists.
- Schools are A-rated — typically a magnet for longer-tenancy family renters. What's the average tenant stay here, and is there a school-zone premium baked into asking?
- What's the average days-on-market for RENTAL listings here right now (not sales)? A rising rental-DOM trend means longer vacancies and softer asking-rent achievability than the comps imply.
- What's the recent tenant-quality profile in this submarket — average credit score on applications, eviction rate, late-payment / NSF rate, and stable-employment percentage? A property-management company in the area should have these aggregated.
- How much new for-sale + rental construction is in the pipeline within 1–3 miles? Heavy new supply typically softens prices + rents 12–24 months out; constrained supply supports both.
Investment metrics
- 1% rule
- 1.31% ✓
- Cap rate
- 10.39%
- Cash-on-cash
- 14.64%
- DSCR
- 1.65
- GRM
- 6.4
CMA / ARV
- ARV (on-the-fly)
- $346,212
- Comps found
- 12
Show comp detail 12 sales within ~0.75 mi
| Address | Dist | Beds/Ba | Sqft | Sold | Price | $/sf | Match |
|---|---|---|---|---|---|---|---|
| 1351 Clear Lake Pl #76 | 0.00mi | 2/2.5 | 1,996 (+2%) | 1mo | $352,500 | $177 | 94 |
| 1362 Fern Lake Ave #113 | 0.10mi | 2/2.0 | 1,874 (-4%) | 3mo | $385,000 | $205 | 86 |
| 1371 Pleasant Lake Pl #105 | 0.10mi | 2/2.0 | 1,896 (-3%) | 6mo | $388,589 | $205 | 85 |
| 635 Shadow Lake Ave #43 | 0.14mi | 2/2.0 | 1,810 (-8%) | 9mo | $325,000 | $180 | 73 |
| 1352 Silver Lake Pl #87 | 0.02mi | 2/2.0 | 1,740 (-11%) | 10mo | $260,000 | $149 | 73 |
| 685 Wood Lake Dr #184 | 0.26mi | 2/2.0 | 1,770 (-10%) | 1mo | $155,000 | $88 | 71 |
| 1366 Fern Lake Ave #114 | 0.11mi | 2/2.0 | 1,776 (-9%) | 13mo | $299,900 | $169 | 68 |
| 2300 Lake Forest Ln #113 | 0.13mi | 2/2.0 | 1,704 (-13%) | 5mo | $355,000 | $208 | 68 |
| 605 Crest Lake Cir #230 | 0.11mi | 2/2.0 | 1,750 (-10%) | 13mo | $300,370 | $172 | 66 |
| 1381 Harbor Lake Ave #32 | 0.20mi | 2/2.0 | 1,680 (-14%) | 2mo | $250,000 | $149 | 65 |
| 1352 Pleasant Lake Pl #102 | 0.06mi | 2/2.0 | 1,680 (-14%) | 13mo | $280,000 | $167 | 63 |
| 2311 Lake Forest Cir #125 | 0.13mi | 2/2.0 | 1,752 (-10%) | 17mo | $310,000 | $177 | 62 |
Match score weights: distance 35% · size 25% · config 20% · recency 20%. Top-matched comps best support the ARV.
Projected returns pro-forma
-3.0% appreciation · 1.78% rent growth · sell at horizon
- IRR
- 3.7%
- Equity multiple
- 1.14×
- Total profit
- $10,982
- Equity at exit
- $41,003
- IRR
- 12.1%
- Equity multiple
- 1.90×
- Total profit
- $69,391
- Equity at exit
- $23,777
Cash invested: $77,000 (down + closing). Projections, not guarantees.
Landlord ↔ Tenant lean methodology
- Overall (STATE)
- 18 Strongly Tenant-Friendly
- State California
- 18 Strongly Tenant-Friendly · D+13
- County
- — inherits STATE
- City
- — inherits STATE
ZIP-level market 92821
- Rents YoY
- 1.8%
- Active inventory
- 63
- Price-to-rent
- 6.4×
Monthly cashflow live
- Estimated rent
- $3,595 high interval (Pro) →
- Mortgage (P&I)
- −$1,442
- Tax est. 1.5%
- −$344 /mo · $4,125/yr
- Insurance
- −$115
- HOA
- −$0
- Vacancy / Maint / Mgmt
- −$755
- Net cashflow
- $940
Break-even live
UW: 25.0% down · 7.5% · 30yr · 1.5% tax · 5.0% vac · 8.0% maint · 8.0% mgmt
Financing live
Cash to close
- Down payment
- $68,750
- Closing costs
- $8,250
- Reserves months
- —
- Total cash needed
- —
Loan-product check · same deal, 3 products live
Conventional
25% down · 7.5% · 30yr
- Down + closing
- —
- Monthly P&I
- —
- Monthly cashflow
- —
- DSCR
- —
- Eligible?
- —
Personal DTI + credit; lowest rate.
DSCR
20% down · 8.5% · 30yr
- Down + closing
- —
- Monthly P&I
- —
- Monthly cashflow
- —
- DSCR
- —
- Eligible?
- —
No personal income docs; deal must DSCR.
Hard money
10% down · 12.0% · 12mo
- Down + closing
- —
- Monthly P&I
- —
- Monthly cashflow
- —
- DSCR
- —
- Eligible?
- —
Short-term bridge; refi at stabilization.
Rent comps 9 comps
| Address | Beds | Baths | Sqft | Rent | $/sqft | DOM | Units | Dist |
|---|---|---|---|---|---|---|---|---|
| 1511 Kinsler Ct Brea, CA | 3.0 | 2.5 | 1605 | $4,095 | $2.55 | 15d | 1 | 0.29mi |
| 141 N Fonda St Unit 1 La Habra, CA | 3.0 | 2.5 | 1300 | $3,400 | $2.62 | 10d | 1 | 0.75mi |
| 1500 Eastpark Dr Unit 3 La Habra, CA | 2.0 | 1.5 | 1286 | $2,500 | $1.94 | 1d | 1 | 0.78mi |
| 350 W Central Ave Brea, CA | 1.0–3.0 | 1.0–2.5 | 1024 | $3,538 | $3.45 | 1d | 8 | 1.12mi |
| 715 S Walnut Ave Apt 3 Brea, CA | 2.0 | 2.5 | 1300 | $3,400 | $2.62 | 4d | 1 | 1.35mi |
| 719 S Walnut Ave Brea, CA | 3.0 | 2.0 | 1339 | $3,800 | $2.84 | 43d | 1 | 1.36mi |
| 843 Bernard Dr Fullerton, CA | 3.0 | 2.0 | 1679 | $5,500 | $3.28 | 10d | 1 | 1.37mi |
| 843 Bernard Dr Fullerton, CA | 3.0 | 2.0 | 1679 | $5,500 | $3.28 | 1d | 1 | 1.37mi |
| 716 S Walnut Ave Brea, CA | 3.0 | 2.0 | 1357 | $3,800 | $2.80 | 44d | 1 | 1.39mi |
Listing history 14 events
-
2026-06-18days on market $275,000 Active 65 DOM
-
2026-06-17days on market $275,000 Active 64 DOM
-
2026-06-16days on market $275,000 Active 63 DOM
-
2026-06-15days on market $275,000 Active 62 DOM
-
2026-06-13days on market $275,000 Active 60 DOM
-
2026-06-09days on market $275,000 Active 56 DOM
-
2026-06-08days on market $275,000 Active 55 DOM
-
2026-06-07days on market $275,000 Active 54 DOM
-
2026-06-04days on market $275,000 Active 51 DOM
-
2026-06-03days on market $275,000 Active 50 DOM
-
2026-06-02days on market $275,000 Active 49 DOM
-
2026-06-01days on market $275,000 Active 48 DOM
-
2026-05-31days on market $275,000 Active 47 DOM
-
2026-04-14$275,000 Active
ⓘ Source: listings_history table (triggers on properties + properties_extension) + one-shot
backfill from property_details.listing_events for pre-trigger history.
Climate risk First Street
- Flood 1/10 Low FEMA zone X (unshaded) · 0% chance over 30 yrs
- Wildfire 2/10 Low
- Heat 6/10 Major 7 d/yr ≥96°F today · 22 d/yr by 30 yrs out
- Wind 1/10 Low
- Air quality 5/10 Major 7 unhealthy d/yr today · 9 by 30 yrs out
Nearby sold comps map
Loading sold comps map…
Walkable amenities ~0.75 mi
Loading nearby amenities…
Taxation est. · year 1
- Rental income
- $43,142
- − Mortgage interest
- −$15,404
- − Property taxes
- −$4,125
- − Insurance
- −$1,375
- − Repairs & maintenance
- −$3,451
- − Management
- −$3,451
- − Depreciation
- −$8,000
- Taxable income
- $7,335
- Est. tax owed @ 24.0%
- −$1,760
- After-tax cash flow
- $9,516/yr
For passive investors: Depreciation is non-cash, so a rental often shows a tax loss while cash-flowing — sheltering income. Rental losses are passive: they offset passive income freely, and up to $25,000/yr can offset ordinary (W-2) income if you actively participate and your MAGI is under $100k (phasing out to $0 by $150k); unused losses carry forward. On sale, claimed depreciation is recaptured at up to 25%, and gains may owe capital-gains tax (a 1031 exchange can defer both). Figures are a year-1 estimate at your 24.0% rate — not tax advice; consult a CPA.
Condition & rehab AI · 12 photos
This manufactured home requires moderate renovations, focusing on updating the kitchen and bathroom, and painting the interior. The home has good curb appeal and a spacious layout, making it a good investment opportunity.
Repairs flagged
- Moderate Kitchen cabinets — Dated and need updating
- Moderate Kitchen countertops — Dated and need updating
- Major Bathroom carpet — Red carpet needs replacement
Value-add opportunities
- Both Paint interior walls — Fresh paint enhances curb appeal and interior aesthetics
- Both Replace kitchen cabinets and countertops — Modernizing the kitchen will attract more buyers
- Both Replace bathroom carpet — A fresh carpet will improve the bathroom's appearance and functionality
Renovation cost estimate screening
| Repair item | Severity | Est. cost |
|---|---|---|
| Kitchen cabinets · Dated and need updating | Moderate | $3,000–15,000 |
| Kitchen countertops · Dated and need updating | Moderate | $3,000–15,000 |
| Bathroom carpet · Red carpet needs replacement | Major | $15,000–50,000 |
| Total estimated repair cost · 3 items | $21,000–80,000 |
Value-add ROI direction
- Both Paint interior walls — Fresh paint enhances curb appeal and interior aesthetics ↑
- Both Replace kitchen cabinets and countertops — Modernizing the kitchen will attract more buyers ↑
- Both Replace bathroom carpet — A fresh carpet will improve the bathroom's appearance and functionality ↑
ⓘ Cost ranges are severity-bucket heuristics (US national rule-of-thumb). Get contractor quotes + a written scope before underwriting a rehab budget.
Schools (NCES district)
- District
- Fullerton Joint Union High
- NCES district ID
- 0614760
- Math proficiency
- 51% ▲ 7.00%
- Reading proficiency
- 66% ▲ 1.00%
- Median HH income
- $66,666
- Composite
- 51.37/100
- National rank
- #1735
- State rank
- #82 of 517 in CA
Livability — Brea
- Score
- 76/100
- State rank
- #100
- US rank
- #3570
Category grades
Schools grade is shown separately in the Schools card above.
Census & demographics
- Census place
- Brea, CA
- County
- Orange County · 3,096,323 people
- City population
- 41,623
- Metro
- Los Angeles-Long Beach-Anaheim, CA
- Population (ZIP)
- 41,623
- Household income
- $123,629
- Rent vs Own
- Severe rent burden
- 1655.0
Population outlook (Orange County) Hauer SSP2
- Today (2025)
- 3,477,456 people
- By 2030
- 3,613,117 · +3.9%
- By 2040
- 3,835,945 · +10.3%
- By 2050
- 3,968,736 · +14.1%
- By 2075
- 4,097,053 · +17.8%
- By 2100
- 3,903,633 · +12.3%
Race, ethnicity, and origin ACS 2023
- Neighborhood character
- Diverse neighborhood (Simpson 0.69)
- Race & ethnicity
- White 38% Hispanic / Latino 32% Asian 24% Two or more races 14% Black 1%
- Hispanic origin (detail)
- Mexican 27%
- Common ancestry
- Slovak 2% Lithuanian 2% Italian 1%
- Foreign-born
- 23% · Canada, South Korea, China
- Languages at home
- 66% English-only · Spanish 16% Korean 6% Chinese 4%
Political lean MEDSL · Orange
- 2024 margin
- Toss-up / Even · D 49.7% · R 47.1% · Other 3.2%
- 2008→2024 swing
- +5.2pp toward D · 2008: -2.6pp · 2024: 2.6pp
- All cycles
- 2024: D+2.6 2020: D+9.0 2016: D+7.7 2012: R+8.3 2008: R+2.6
Not yet ingested
- Civics
- —
Market trends
- HPI YoY
- ▼ -826.78%
- Current HPI
- 374.8663
- Rent YoY
- ▲ 1.78%
- Metro
- Los Angeles-Long Beach-Anaheim, CA
- State GDP YoY
- ▲ 3.21%
- F500 in state
- 116
Industry mix (Fortune 500 HQ in CA)
| Industry | F500 HQs | Revenue |
|---|---|---|
| Technology | 27 | $1,492B |
|
||
| Financial Services | 3 | $174B |
|
||
| Retail | 3 | $44B |
|
||
| Insurance | 3 | $26B |
|
||
| Media / Entertainment | 2 | $115B |
|
||
| Pharmaceuticals / Biotech | 2 | $62B |
|
||
Price history
1 event — show timeline
- 2026-04-14 Listed $275,000 CRMLS
Cash-flow waterfall
monthlySold comps — $/sqft
last 12 mo · ≤1 miLoading sold comps…