 Multi-family
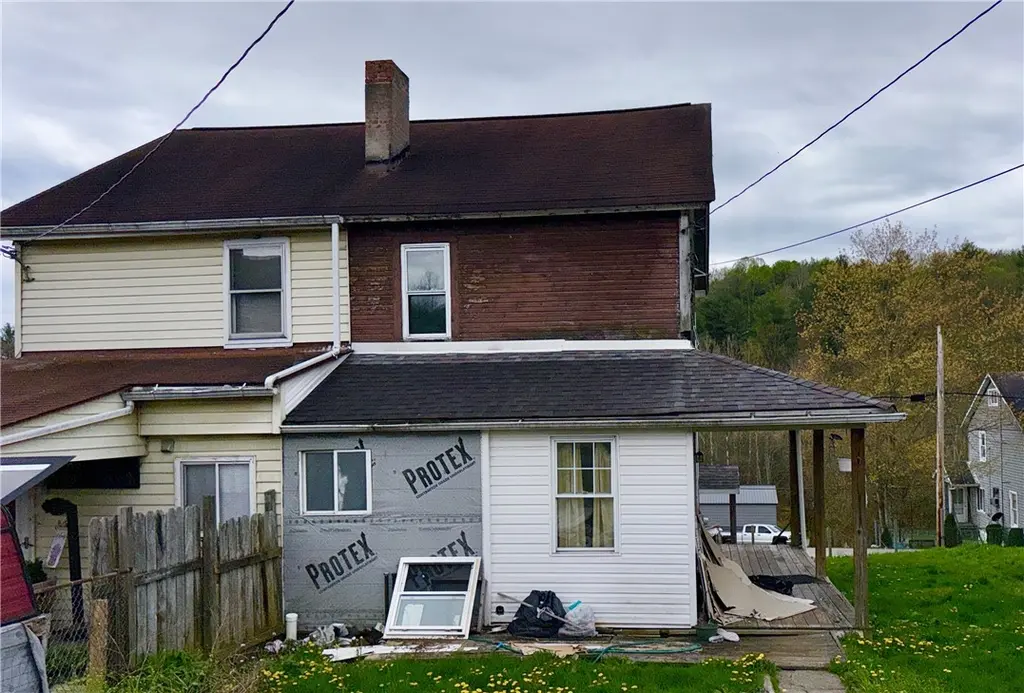
126 Shoaf Rd · Smithfield, PA
Flood risk 1/10 · Minimal
- FEMA flood zone
- X (unshaded)
- Chance of flooding over 30 yrs
- 0.0%
- Est. flood insurance / yr
- $473 – $860
Fire risk 1/10 · Minimal
- Est. fire insurance / yr
- $511 – $949
Heat risk 4/10 · Minor
- Hot days now (above 98°F)
- 7 days/yr
- Hot days in 30 yrs
- 19 days/yr
Wind risk 2/10 · Minimal
- Chance of severe wind over 30 yrs
- —
Air-quality risk 2/10 · Minimal
- Unhealthy air days now
- 1 days/yr
- Unhealthy air days in 30 yrs
- 2 days/yr
Risk factors via First Street. Map © Google.
Why this score? — see what drove the C- grade
The composite is a weighted blend of 9 inputs, each scored 0–100. Each bar is that input's sub-score; the figure is the points it added to the 100-point composite (weight × sub-score).
- Cash flow +15.0/30.0
- ARV discount +7.5/15.0
- Appreciation +7.3/10.0
- 1% rule +5.0/10.0
- DSCR +5.0/10.0
- Livability +3.2/5.0
- Schools +3.0/10.0
- Rent growth +2.5/5.0
- Condition / age +2.5/5.0
$17,900
🖨 Deal sheet 📄 Offer letter ✓ Due diligence
Multi-family units
County records classify this as Multi-Family (2-4 Unit). Listing-text estimate: 1 unit. estimate disagrees with records
Listing remarks MLS
Two Bed one bath 1/2 duplex in Shoaf, room for possible 3rd bedroom. Large kitchen, first floor laundry, basement, side deck/porch, shed, off street parking in rear. Would make good investment property or starter home for someone looking for a project. Close to route 119 and route 21
Key facts
- Close to route 119
- Close to route 21
- Off street parking
Tags
Neighborhood map
What this means for you Summary
Snapshot
- This is a 2-bed/1.0-bath multifamily listed at $18k.
Deal economics
- At list price, monthly cash flow is $1k ($14k/yr) — positive.
- The deal already cash-flows at list — no discount required.
- Meets the 1% rule at list price ($2k rent vs $18k).
- Recommended offer: $17k (3.0% below list) — sets the bar for market timing.
Location & tenants
- Location reads 64/100 on livability (#1,189 in PA) — a middle-class / working-renter tenant base. Strengths: cost of living A+, housing A+; Watch: employment D+, amenities F, commute F.
- Albert Gallatin Area SD (rural): math 26% / reading 46% proficiency, ranked #419 of 539 in PA (top 78%) — families likely to look elsewhere, expect single-tenant / working-renter base with shorter leases.
- Market conditions: 16 active listings in the ZIP; 201 units permitted in Fayette County in 2024 (10 in 5+ unit buildings).
Forward outlook
- In year one you build about $944 of equity ($124 loan paydown + $820 appreciation (4.6% local appreciation)).
- Fayette County population projected at -19% by 2050 — secular population decline; favor cash flow + early exit over multi-decade hold.
- At projected returns (4.6% appreciation + 3.0% rent growth), your $5k cash investment doubles in ~1 year — after that, you're playing with house money.
Negotiation context
- It's been on market 58 days — a 3% lower offer ($17k) is reasonable based on typical stale-listing flexibility.
Risks & watch-outs
- Watch-outs: built in 1900 — expect roof / HVAC / electrical / plumbing capex.
Questions for the listing agent
- It's been on market 58 days. Have you received any prior offers? Is the seller open to a 3% concession, seller financing, or rate buy-down credit?
- Built in 1900 — when were the roof, HVAC, electrical panel, plumbing, and water heater last replaced?
- Is there a deadline driving the sale (1031 exchange, divorce, estate, relocation)? That informs how much negotiation room exists.
- What's the average days-on-market for RENTAL listings here right now (not sales)? A rising rental-DOM trend means longer vacancies and softer asking-rent achievability than the comps imply.
- What's the recent tenant-quality profile in this submarket — average credit score on applications, eviction rate, late-payment / NSF rate, and stable-employment percentage? A property-management company in the area should have these aggregated.
- How much new apartment / multifamily construction is in the pipeline within 1–3 miles? Heavy new supply (>2% of stock underway) typically softens rents 12–24 months out; light construction supports rent growth.
Investment metrics
- 1% rule
- 9.38% ✓
- Cap rate
- 86.30%
- Cash-on-cash
- 285.74%
- DSCR
- 13.71
- GRM
- 0.9
CMA / ARV
- ARV (median comp)
- $194,379
- List price
- $17,900
- Delta
- -90.79%
- Verdict
- UNDERPRICED
- Comps
- 3 within 2.0 mi
Projected returns pro-forma
4.58% appreciation · 3.0% rent growth · sell at horizon
- IRR
- —
- Equity multiple
- 16.91×
- Total profit
- $79,740
- Equity at exit
- $9,689
- IRR
- —
- Equity multiple
- 36.04×
- Total profit
- $175,613
- Equity at exit
- $16,358
Cash invested: $5,012 (down + closing). Projections, not guarantees.
Landlord ↔ Tenant lean methodology
- Overall (STATE)
- 62 Landlord-Friendly
- State Pennsylvania
- 62 Landlord-Friendly · EVEN
- County
- — inherits STATE
- City
- — inherits STATE
ZIP-level market 15478
- Home prices YoY
- 2.0%
- Active inventory
- 16
- Price-to-rent
- 1.8×
Monthly cashflow live
- Estimated rent
- $1,679 medium interval (Pro) →
- Mortgage (P&I)
- −$94
- Tax from tax record
- −$32 /mo · $380/yr
- Insurance
- −$7
- HOA
- −$0
- Vacancy / Maint / Mgmt
- −$353
- Net cashflow
- $1,193
Break-even live
2-unit breakdown (identical units grouped — click to expand)
| Units | Beds | Baths | Est. rent |
|---|---|---|---|
| 2× units | 2 | 1 | $1,680 |
| #1 | 2 | 1 | $840 |
| #2 | 2 | 1 | $840 |
| Total (2 units) | $1,679 | ||
UW: 25.0% down · 7.5% · 30yr · 1.5% tax · 5.0% vac · 8.0% maint · 8.0% mgmt
Financing live
Cash to close
- Down payment
- $4,475
- Closing costs
- $537
- Reserves months
- —
- Total cash needed
- —
Loan-product check · same deal, 3 products live
Conventional
25% down · 7.5% · 30yr
- Down + closing
- —
- Monthly P&I
- —
- Monthly cashflow
- —
- DSCR
- —
- Eligible?
- —
Personal DTI + credit; lowest rate.
DSCR
20% down · 8.5% · 30yr
- Down + closing
- —
- Monthly P&I
- —
- Monthly cashflow
- —
- DSCR
- —
- Eligible?
- —
No personal income docs; deal must DSCR.
Hard money
10% down · 12.0% · 12mo
- Down + closing
- —
- Monthly P&I
- —
- Monthly cashflow
- —
- DSCR
- —
- Eligible?
- —
Short-term bridge; refi at stabilization.
Listing history 16 events
-
2026-06-19days on market $17,900 Active 58 DOM
-
2026-06-18days on market $17,900 Active 57 DOM
-
2026-06-17days on market $17,900 Active 56 DOM
-
2026-06-16days on market $17,900 Active 55 DOM
-
2026-06-15days on market $17,900 Active 54 DOM
-
2026-06-14days on market $17,900 Active 52 DOM
-
2026-06-13days on market $17,900 Active 51 DOM
-
2026-06-10days on market $17,900 Active 49 DOM
-
2026-06-09days on market $17,900 Active 48 DOM
-
2026-06-08days on market $17,900 Active 47 DOM
-
2026-06-07pricedays on market $17,900 Active 46 DOM
-
2026-06-02days on market $24,900 Active 41 DOM
-
2026-06-01days on market $24,900 Active 40 DOM
-
2026-05-31days on market $24,900 Active 39 DOM
-
2026-05-30days on market $24,900 Active 38 DOM
-
2026-04-22$24,900 Active 284-char remark
Show marketing remark (284 chars)
Two Bed one bath 1/2 duplex in Shoaf, room for possible 3rd bedroom. Large kitchen, first floor laundry, basement, side deck/porch, shed, off street parking in rear. Would make good investment property or starter home for someone looking for a project. Close to route 119 and route 21
ⓘ Source: listings_history table (triggers on properties + properties_extension) + one-shot
backfill from property_details.listing_events for pre-trigger history.
Tax reassessment forecast PA · Partial reset (capped growth)
- Current annual tax
- $380 · $32/mo
- Projected year-2 tax
- $380 · $32/mo
- Expected delta
- $0/yr ($0/mo · 0.0%)
ⓘ Screening estimate from a state-policy table — verify with the county assessor before closing.
Climate risk First Street
- Flood 1/10 Low FEMA zone X (unshaded) · 0% chance over 30 yrs
- Wildfire 1/10 Low
- Heat 4/10 Moderate 7 d/yr ≥98°F today · 19 d/yr by 30 yrs out
- Wind 2/10 Low
- Air quality 2/10 Low 1 unhealthy d/yr today · 2 by 30 yrs out
Nearby sold comps map
Loading sold comps map…
Walkable amenities ~0.75 mi
Loading nearby amenities…
Taxation est. · year 1
- Rental income
- $20,148
- − Mortgage interest
- −$1,003
- − Property taxes
- −$380
- − Insurance
- −$90
- − Repairs & maintenance
- −$1,612
- − Management
- −$1,612
- − Depreciation
- −$521
- Taxable income
- $14,932
- Est. tax owed @ 24.0%
- −$3,584
- After-tax cash flow
- $10,738/yr
For passive investors: Depreciation is non-cash, so a rental often shows a tax loss while cash-flowing — sheltering income. Rental losses are passive: they offset passive income freely, and up to $25,000/yr can offset ordinary (W-2) income if you actively participate and your MAGI is under $100k (phasing out to $0 by $150k); unused losses carry forward. On sale, claimed depreciation is recaptured at up to 25%, and gains may owe capital-gains tax (a 1031 exchange can defer both). Figures are a year-1 estimate at your 24.0% rate — not tax advice; consult a CPA.
Schools (NCES district)
- District
- Albert Gallatin Area SD
- NCES district ID
- 4202100
- Math proficiency
- 26% ▼ -15.00%
- Reading proficiency
- 46% ▼ -7.00%
- Median HH income
- $36,456
- Composite
- 29.8/100
- National rank
- #6422
- State rank
- #419 of 539 in PA
Livability — Smithfield
- Score
- 64/100
- State rank
- #1189
- US rank
- #13921
Category grades
Schools grade is shown separately in the Schools card above.
Census & demographics
- Population (ZIP)
- 5,679
Population outlook (Fayette County) Hauer SSP2
- Today (2025)
- 127,561 people
- By 2030
- 123,206 · -3.4%
- By 2040
- 113,232 · -11.2%
- By 2050
- 103,468 · -18.9%
- By 2075
- 83,185 · -34.8%
- By 2100
- 62,384 · -51.1%
Race, ethnicity, and origin ACS 2023
- Neighborhood character
- Predominantly White (97%)
- Race & ethnicity
- White 97% Two or more races 2%
- Common ancestry
- Romanian 7% Iranian 3% Serbian 2%
- Foreign-born
- 0% · China
Political lean MEDSL · Fayette
- 2024 margin
- Solid R (+37.9) · D 30.8% · R 68.7%
- 2008→2024 swing
- -37.5pp toward R · 2008: -0.4pp · 2024: -37.9pp
- All cycles
- 2024: R+37.9 2020: R+33.5 2016: R+31.0 2012: R+8.3 2008: R+0.4
Not yet ingested
- Civics
- —
Market trends
- HPI YoY
- ▲ 4.58%
- Current HPI
- 235.5887
- Rent YoY
- —
- Metro
- —
- State GDP YoY
- ▲ 1.68%
- F500 in state
- 34
Industry mix (Fortune 500 HQ in PA)
| Industry | F500 HQs | Revenue |
|---|---|---|
| Healthcare | 2 | $309B |
|
||
| Insurance | 2 | $27B |
|
||
| Telecommunications / Media | 1 | $124B |
|
||
| Industrial Distribution | 1 | $22B |
|
||
| Financial Services | 1 | $20B |
|
||
| Chemicals / Materials | 1 | $18B |
|
||
Price history
1 event — show timeline
- 2026-04-22 Listed $24,900 West Penn MLS
Property tax history
+3.0%/yrLatest (2026): $380 · +0.0% YoY. Source: county tax records.
Cash-flow waterfall
monthlySold comps — $/sqft
last 12 mo · ≤1 miLoading sold comps…