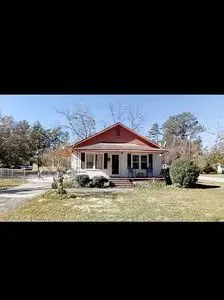
813 Windsor Way · Marion, SC
Flood risk 1/10 · Minimal
- FEMA flood zone
- X (unshaded)
- Chance of flooding over 30 yrs
- 0.0%
- Est. flood insurance / yr
- $507 – $1,088
Fire risk 4/10 · Minor
- Est. fire insurance / yr
- $783 – $1,453
Heat risk 7/10 · Major
- Hot days now (above 109°F)
- 7 days/yr
- Hot days in 30 yrs
- 16 days/yr
Wind risk 8/10 · Major
- Chance of severe wind over 30 yrs
- 80.0%
Air-quality risk 2/10 · Minimal
- Unhealthy air days now
- 1 days/yr
- Unhealthy air days in 30 yrs
- 1 days/yr
Risk factors via First Street. Map © Google.
Why this score? — see what drove the D grade
The composite is a weighted blend of 9 inputs, each scored 0–100. Each bar is that input's sub-score; the figure is the points it added to the 100-point composite (weight × sub-score).
- Cash flow +16.2/30.0
- ARV discount +7.5/15.0
- DSCR +5.0/10.0
- 1% rule +3.5/10.0
- Livability +2.8/5.0
- Rent growth +2.5/5.0
- Condition / age +2.5/5.0
- Schools +1.3/10.0
- Appreciation +0.0/10.0
$105,000
🖨 Deal sheet 📄 Offer letter ✓ Due diligence
Listing remarks
Discover a prime addition to your real estate portfolio with this beautifully maintained 3-bedroom, 2-bathroom Ranch-style bungalow on a spacious 0.23-acre corner lot. The classic exterior is complemented by a fully fenced backyard, a detached storage shed, and a charming front porch. The property is currently occupied by reliable tenants with a lease through September 2026 who have expressed a strong desire to remain long-term, providing a rare opportunity for guaranteed continuity and zero vacancy.
Key facts
- Charming front porch
- Corner lot
- Built 1950
Tags
Neighborhood map
What this means for you Summary
Snapshot
- This is a 3-bed/1.0-bath other listed at $105k.
Deal economics
- At list price, monthly cash flow is $56 ($672/yr) — positive.
- The deal already cash-flows at list — no discount required.
- To meet the 1% rule (rent ≥ 1% of price), the offer needs to be $90k (14.5% below list).
- Recommended offer: $90k (14.5% below list) — sets the bar for 1% rule.
- Cap rate 6.9% vs local median 3.3% in Marion — top-decile yield for the area; either an underpriced asset or a hidden risk that comps aren't pricing in. Stress-test before assuming the spread holds.
Location & tenants
- Location reads 55/100 on livability (#306 in SC) — a working-class tenant base; expect higher turnover. Strengths: cost of living A+, health & safety A+; Watch: schools F, crime F, amenities F.
- Marion 10 (town): math 9% / reading 23% proficiency, ranked #79 of 80 in SC (top 99%) — low school quality limits family demand, transient renter base, plan for 1-2y turnover; 79% free/reduced lunch — lower-income household profile, screen leases tightly.
- Market conditions: 122 active listings in the ZIP; 4 comparable units currently listed for rent nearby; rentals at typical pace (median 23d on market — plan ~3-4 weeks tenant-placement turnaround); 76 units permitted in Marion County in 2024 (0 in 5+ unit buildings).
Forward outlook
- Local home prices are declining (-3.0%/yr); year-one equity from $726 of loan paydown is wiped out by about $3k of value loss. Plan a longer hold.
- Marion County population projected at -26% by 2050 — secular population decline; favor cash flow + early exit over multi-decade hold.
Negotiation context
- It's been on market 37 days — a 3% lower offer ($102k) is reasonable based on typical stale-listing flexibility.
- 5 sale attempts since 10y ago; this cycle's ask has dropped $20k (16%) from the opening price — seller is motivated, your offer sets the floor, not the list.
Risks & watch-outs
- Watch-outs: built in 1950 — expect roof / HVAC / electrical / plumbing capex.
- Climate carrying-cost: severe wind risk, 80% chance of damaging wind over 30y; extreme-heat days projected 7→16/yr by 2055 (HVAC capex compounding) — expect insurance premiums to compound above CPI over the hold.
Questions for the listing agent
- It's been on market 37 days. Have you received any prior offers? Is the seller open to a 15% concession, seller financing, or rate buy-down credit?
- Built in 1950 — when were the roof, HVAC, electrical panel, plumbing, and water heater last replaced?
- Is there a deadline driving the sale (1031 exchange, divorce, estate, relocation)? That informs how much negotiation room exists.
- Schools are F-rated, which usually means shorter tenancies and higher turnover. Who's the typical renter profile here, and what's been the actual vacancy rate?
- Crime grade is F in this area — have there been break-ins, vandalism, or insurance claims at this property in the last 3 years? What carrier currently insures it and at what premium?
- The area grade is low — what's the realistic commute time and amenity access for the typical tenant pool here? Any planned neighborhood developments (good or bad) we should know about?
- What's the average days-on-market for RENTAL listings here right now (not sales)? A rising rental-DOM trend means longer vacancies and softer asking-rent achievability than the comps imply.
- What's the recent tenant-quality profile in this submarket — average credit score on applications, eviction rate, late-payment / NSF rate, and stable-employment percentage? A property-management company in the area should have these aggregated.
- How much new for-sale + rental construction is in the pipeline within 1–3 miles? Heavy new supply typically softens prices + rents 12–24 months out; constrained supply supports both.
Investment metrics
- 1% rule
- 0.85% ✗
- Cap rate
- 6.93%
- Cash-on-cash
- 2.28%
- DSCR
- 1.10
- GRM
- 9.7
CMA / ARV
No comps found within radius.
Projected returns pro-forma
-3.0% appreciation · 3.0% rent growth · sell at horizon
- IRR
- -12.7%
- Equity multiple
- 0.54×
- Total profit
- $-13,481
- Equity at exit
- $15,656
- IRR
- -3.7%
- Equity multiple
- 0.75×
- Total profit
- $-7,274
- Equity at exit
- $9,078
Cash invested: $29,400 (down + closing). Projections, not guarantees.
Landlord ↔ Tenant lean methodology
- Overall (STATE)
- 90 Strongly Landlord-Friendly
- State South Carolina
- 90 Strongly Landlord-Friendly · R+6
- County
- — inherits STATE
- City
- — inherits STATE
ZIP-level market 29571
- Active inventory
- 122
- Price-to-rent
- 9.7×
Monthly cashflow live
- Estimated rent
- $898 medium interval (Pro) →
- Mortgage (P&I)
- −$551
- Tax from tax record
- −$59 /mo · $705/yr
- Insurance
- −$44
- HOA
- −$0
- Vacancy / Maint / Mgmt
- −$188
- Net cashflow
- $56
Break-even live
UW: 25.0% down · 7.5% · 30yr · 1.5% tax · 5.0% vac · 8.0% maint · 8.0% mgmt
Financing live
Cash to close
- Down payment
- $26,250
- Closing costs
- $3,150
- Reserves months
- —
- Total cash needed
- —
Loan-product check · same deal, 3 products live
Conventional
25% down · 7.5% · 30yr
- Down + closing
- —
- Monthly P&I
- —
- Monthly cashflow
- —
- DSCR
- —
- Eligible?
- —
Personal DTI + credit; lowest rate.
DSCR
20% down · 8.5% · 30yr
- Down + closing
- —
- Monthly P&I
- —
- Monthly cashflow
- —
- DSCR
- —
- Eligible?
- —
No personal income docs; deal must DSCR.
Hard money
10% down · 12.0% · 12mo
- Down + closing
- —
- Monthly P&I
- —
- Monthly cashflow
- —
- DSCR
- —
- Eligible?
- —
Short-term bridge; refi at stabilization.
Rent comps 4 comps
| Address | Beds | Baths | Sqft | Rent | $/sqft | DOM | Units | Dist |
|---|---|---|---|---|---|---|---|---|
| 206 S Pine St Marion, SC | 3.0 | 1.5 | 1176 | $900 | $0.77 | 23d | 1 | 0.65mi |
| 2800 Plaza Ct Marion, SC | 3.0 | 1.0 | 1100 | $950 | $0.86 | 23d | 1 | 0.74mi |
| 2805 Plaza Ct Unit A Marion, SC | 3.0 | 1.5 | 1100 | $950 | $0.86 | 23d | 1 | 0.78mi |
| 310 Georgetown St Marion, SC | 2.0 | 1.0 | 880 | $700 | $0.80 | 23d | 1 | 1.11mi |
Listing history 27 events
-
2026-06-18days on market $105,000 Active 37 DOM
-
2026-06-17days on market $105,000 Active 36 DOM
-
2026-06-16days on market $105,000 Active 35 DOM
-
2026-06-16price $105,000 Active 34 DOM
-
2026-06-15days on market $125,000 Active 34 DOM
-
2026-06-14days on market $125,000 Active 32 DOM
-
2026-06-13days on market $125,000 Active 31 DOM
-
2026-06-10days on market $125,000 Active 29 DOM
-
2026-06-09days on market $125,000 Active 28 DOM
-
2026-06-08days on market $125,000 Active 27 DOM
-
2026-06-07days on market $125,000 Active 26 DOM
-
2026-06-05days on market $125,000 Active 23 DOM
-
2026-06-03days on market $125,000 Active 22 DOM
-
2026-06-02days on market $125,000 Active 21 DOM
-
2026-06-01days on market $125,000 Active 20 DOM
-
2026-05-31days on market $125,000 Active 19 DOM
-
2026-05-30days on market $125,000 Active 18 DOM
-
2026-05-12$125,000 Active
-
2026-02-10historical
-
2026-01-19price $132,400
-
2025-11-24$134,900 Active
-
2019-04-25historical
-
2018-11-28$59,999
-
2017-11-20soldstatus
-
2017-08-29$35,000
-
2016-09-21soldstatus
-
2016-04-06$25,900
ⓘ Source: listings_history table (triggers on properties + properties_extension) + one-shot
backfill from property_details.listing_events for pre-trigger history.
Tax reassessment forecast SC · Resets to sale price
- Current annual tax
- $705 · $59/mo
- Projected year-2 tax
- $705 · $59/mo
- Expected delta
- $0/yr ($0/mo · 0.0%)
ⓘ Screening estimate from a state-policy table — verify with the county assessor before closing.
Climate risk First Street
- Flood 1/10 Low FEMA zone X (unshaded) · 0% chance over 30 yrs
- Wildfire 4/10 Moderate
- Heat 7/10 Severe 7 d/yr ≥109°F today · 16 d/yr by 30 yrs out
- Wind 8/10 Severe 80% chance of damaging wind over 30 yrs
- Air quality 2/10 Low 1 unhealthy d/yr today · 1 by 30 yrs out
Nearby sold comps map
Loading sold comps map…
Walkable amenities ~0.75 mi
Loading nearby amenities…
Taxation est. · year 1
- Rental income
- $10,771
- − Mortgage interest
- −$5,882
- − Property taxes
- −$705
- − Insurance
- −$525
- − Repairs & maintenance
- −$862
- − Management
- −$862
- − Depreciation
- −$3,055
- Taxable loss
- −$1,118
- Est. tax savings @ 24.0%
- +$268
- After-tax cash flow
- $940/yr
For passive investors: Depreciation is non-cash, so a rental often shows a tax loss while cash-flowing — sheltering income. Rental losses are passive: they offset passive income freely, and up to $25,000/yr can offset ordinary (W-2) income if you actively participate and your MAGI is under $100k (phasing out to $0 by $150k); unused losses carry forward. On sale, claimed depreciation is recaptured at up to 25%, and gains may owe capital-gains tax (a 1031 exchange can defer both). Figures are a year-1 estimate at your 24.0% rate — not tax advice; consult a CPA.
Schools (NCES district)
- District
- Marion 10
- NCES district ID
- 4503908
- Math proficiency
- 9% ▼ -9.00%
- Reading proficiency
- 23% ▲ 1.00%
- Median HH income
- $31,200
- Composite
- 12.75/100
- National rank
- #9600
- State rank
- #79 of 80 in SC
Livability — Marion
- Score
- 55/100
- State rank
- #306
- US rank
- #23400
Category grades
Schools grade is shown separately in the Schools card above.
Census & demographics
- Census place
- Marion, SC
- Population (ZIP)
- 13,788
Population outlook (Marion County) Hauer SSP2
- Today (2025)
- 29,121 people
- By 2030
- 27,539 · -5.4%
- By 2040
- 24,391 · -16.2%
- By 2050
- 21,566 · -25.9%
- By 2075
- 15,537 · -46.6%
- By 2100
- 10,680 · -63.3%
Race, ethnicity, and origin ACS 2023
- Neighborhood character
- Majority Black (57%)
- Race & ethnicity
- Black 57% White 40% Hispanic / Latino 2%
- Common ancestry
- Serbian 1%
- Foreign-born
- 2% · Canada
- Languages at home
- 97% English-only · Spanish 2%
Political lean MEDSL · Marion
- 2024 margin
- D (+10.5) · D 54.6% · R 44.1% · Other 1.2%
- 2008→2024 swing
- -15.2pp toward R · 2008: 25.7pp · 2024: 10.5pp
- All cycles
- 2024: D+10.5 2020: D+21.5 2016: D+21.7 2012: D+29.8 2008: D+25.7
Not yet ingested
- Civics
- —
Market trends
- HPI YoY
- ▼ -90.98%
- Current HPI
- 125.5834
- Rent YoY
- —
- Metro
- —
- State GDP YoY
- ▲ 4.51%
- F500 in state
- 2
Industry mix (Fortune 500 HQ in SC)
| Industry | F500 HQs | Revenue |
|---|---|---|
| Packaging | 1 | $7B |
|
||
Price history
+382.6% since first listed10 events — show timeline
- 2026-05-12 Listed $125,000 FSBO.com
- 2026-02-10 Listing Removed — CCAR
- 2026-01-19 Price Changed $132,400 CCAR
- 2025-11-24 Listed $134,900 CCAR
- 2019-04-25 Listing Removed — CCAR
- 2018-11-28 Listed $59,999 CCAR
- 2017-11-20 Sold (MLS) — RAGPD
- 2017-08-29 Listed $35,000 RAGPD
- 2016-09-21 Sold (MLS) — RAGPD
- 2016-04-06 Listed $25,900 RAGPD
Property tax history
+7.3%/yrLatest (2025): $705 · +1.5% YoY. Source: county tax records.
Cash-flow waterfall
monthlySold comps — $/sqft
last 12 mo · ≤1 miLoading sold comps…