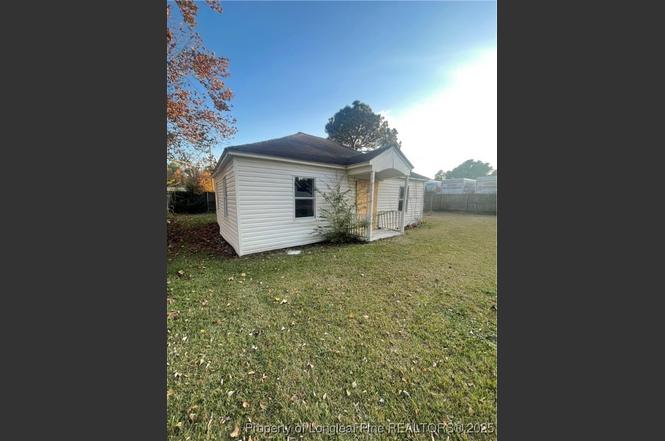
104 Fleishman St · Fayetteville, NC
Flood risk No data
- FEMA flood zone
- —
- Chance of flooding over 30 yrs
- —
- Est. flood insurance / yr
- —
Fire risk No data
- Est. fire insurance / yr
- —
Heat risk No data
- Hot days now (above threshold)
- —
- Hot days in 30 yrs
- —
Wind risk No data
- Chance of severe wind over 30 yrs
- —
Air-quality risk No data
- Unhealthy air days now
- —
- Unhealthy air days in 30 yrs
- —
Risk factors via First Street. Map © Google.
Why this score? — see what drove the B grade
The composite is a weighted blend of 9 inputs, each scored 0–100. Each bar is that input's sub-score; the figure is the points it added to the 100-point composite (weight × sub-score).
- Cash flow +30.0/30.0
- 1% rule +10.0/10.0
- DSCR +10.0/10.0
- ARV discount +7.5/15.0
- Livability +3.8/5.0
- Rent growth +3.3/5.0
- Schools +3.1/10.0
- Condition / age +2.5/5.0
- Appreciation +0.0/10.0
$44,000
🖨 Deal sheet 📄 Offer letter ✓ Due diligence
Listing remarks
Investors Special! Property is located near Amazon Distribution Center. Fixer upper with great potential for investors or anyone looking for a great deal! Property is being sold as-is and needs WORK! Motivated seller!
Key facts
- 6,098 sq ft lot
- Built 1946
- Listed 199 days
Property features AI
Exterior
- Utilities: Public water; Public sewer
- Home design: Single-family residence; One story
- Construction: Vinyl siding construction
- Exterior features: Mixed Residential (MR5) zoning
Interior
- Flooring: Other
- Bathrooms: 1 full bathroom
- Heating & cooling: No heating system specified
- Interior features: Crawl space basement; Other flooring
Neighborhood map
What this means for you Summary
Snapshot
- This is a 2-bed/1.0-bath single-family listed at $44k.
Deal economics
- At list price, monthly cash flow is $597 ($7k/yr) — positive.
- The deal already cash-flows at list — no discount required.
- Meets the 1% rule at list price ($1k rent vs $44k).
- Recommended offer: $39k (12.0% below list) — sets the bar for market timing.
- Cap rate 22.6% vs local median 4.9% in Fayetteville — top-decile yield for the area; either an underpriced asset or a hidden risk that comps aren't pricing in. Stress-test before assuming the spread holds.
Location & tenants
- Location reads 75/100 on livability (#45 in NC, #4,031 nationally) — a middle-class / working-renter tenant base. Strengths: commute A+, cost of living A+, housing A+; Watch: crime F, employment D-.
- Cumberland County Schools (urban): math 32% / reading 41% proficiency, ranked #126 of 178 in NC (top 71%) — families likely to look elsewhere, expect single-tenant / working-renter base with shorter leases.
- Zoned schools: R Max Abbott Middle (math 31% / reading 45%, grade F, #251 of 475 statewide, top 54%, 759 students, 99% FRL); Terry Sanford High (math 49% / reading 52%, grade D+, #306 of 535 statewide, top 57%, 1,224 students, 59% FRL) — zoned schools average 79% FRL vs 55% district-wide (24 pts higher); higher-poverty schools than district average — tighter screening recommended.
- Market conditions: Rents rising (+3.0%/yr); 280 active listings in the ZIP; 27 comparable units currently listed for rent nearby; rentals at typical pace (median 24d on market — plan ~3-4 weeks tenant-placement turnaround); 1,125 units permitted in Cumberland County in 2024 (104 in 5+ unit buildings).
Forward outlook
- Local home prices are declining (-3.0%/yr); year-one equity from $304 of loan paydown is wiped out by about $1k of value loss. Plan a longer hold.
- At projected returns (-3.0% appreciation + 3.0% rent growth), your $12k cash investment doubles in ~2 years — after that, you're playing with house money.
Negotiation context
- It's been on market 199 days — a 12% lower offer ($39k) is reasonable based on typical stale-listing flexibility.
- 2 sale attempts since 13y ago; this cycle's ask has dropped $18k (30%) from the opening price — seller is motivated, your offer sets the floor, not the list.
Risks & watch-outs
- Watch-outs: built in 1946 — expect roof / HVAC / electrical / plumbing capex.
Questions for the listing agent
- It's been on market 199 days. Have you received any prior offers? Is the seller open to a 12% concession, seller financing, or rate buy-down credit?
- Built in 1946 — when were the roof, HVAC, electrical panel, plumbing, and water heater last replaced?
- Why hasn't it sold? Are there any deal-killer items the seller is aware of (foundation, flood, title, zoning, code violations)?
- Is there a deadline driving the sale (1031 exchange, divorce, estate, relocation)? That informs how much negotiation room exists.
- Crime grade is F in this area — have there been break-ins, vandalism, or insurance claims at this property in the last 3 years? What carrier currently insures it and at what premium?
- What's the average days-on-market for RENTAL listings here right now (not sales)? A rising rental-DOM trend means longer vacancies and softer asking-rent achievability than the comps imply.
- What's the recent tenant-quality profile in this submarket — average credit score on applications, eviction rate, late-payment / NSF rate, and stable-employment percentage? A property-management company in the area should have these aggregated.
- How much new for-sale + rental construction is in the pipeline within 1–3 miles? Heavy new supply typically softens prices + rents 12–24 months out; constrained supply supports both.
Investment metrics
- 1% rule
- 2.59% ✓
- Cap rate
- 22.57%
- Cash-on-cash
- 58.14%
- DSCR
- 3.59
- GRM
- 3.2
CMA / ARV
- ARV (on-the-fly)
- $138,060
- Comps found
- 6
Show comp detail 6 sales within ~0.75 mi
| Address | Dist | Beds/Ba | Sqft | Sold | Price | $/sf | Match |
|---|---|---|---|---|---|---|---|
| 117 Grooms St | 0.18mi | 2/1.0 | 744 (-5%) | 11mo | $119,000 | $160 | 75 |
| 5218 Gavins St | 0.22mi | 2/2.0 | 760 (-3%) | 11mo | $120,000 | $158 | 72 |
| 5003 Higgins St | 0.46mi | 2/1.0 | 768 (-2%) | 9mo | $136,000 | $177 | 69 |
| 113 Grooms St | 0.18mi | 2/1.0 | 750 (-4%) | 20mo | $137,000 | $183 | 69 |
| 433 Ferrell Dr | 0.68mi | 2/1.0 | 784 (+0%) | 22mo | $119,800 | $153 | 49 |
| 213 Gertrude St | 0.58mi | 3/1.0 (+1) | 806 (+3%) | 17mo | $142,800 | $177 | 48 |
Match score weights: distance 35% · size 25% · config 20% · recency 20%. Top-matched comps best support the ARV.
Projected returns pro-forma
-3.0% appreciation · 3.01% rent growth · sell at horizon
- IRR
- 56.7%
- Equity multiple
- 3.51×
- Total profit
- $30,918
- Equity at exit
- $6,561
- IRR
- 61.7%
- Equity multiple
- 7.17×
- Total profit
- $75,996
- Equity at exit
- $3,804
Cash invested: $12,320 (down + closing). Projections, not guarantees.
Landlord ↔ Tenant lean methodology
- Overall (STATE)
- 85 Strongly Landlord-Friendly
- State North Carolina
- 85 Strongly Landlord-Friendly · R+3
- County
- — inherits STATE
- City
- — inherits STATE
ZIP-level market 28303
- Home prices YoY
- -25.4%
- Rents YoY
- 3.0%
- Active inventory
- 280
- Price-to-rent
- 3.2×
Monthly cashflow live
- Estimated rent
- $1,141 high interval (Pro) →
- Mortgage (P&I)
- −$231
- Tax est. 1.5%
- −$55 /mo · $660/yr
- Insurance
- −$18
- HOA
- −$0
- Vacancy / Maint / Mgmt
- −$240
- Net cashflow
- $597
Break-even live
UW: 25.0% down · 7.5% · 30yr · 1.5% tax · 5.0% vac · 8.0% maint · 8.0% mgmt
Financing live
Cash to close
- Down payment
- $11,000
- Closing costs
- $1,320
- Reserves months
- —
- Total cash needed
- —
Loan-product check · same deal, 3 products live
Conventional
25% down · 7.5% · 30yr
- Down + closing
- —
- Monthly P&I
- —
- Monthly cashflow
- —
- DSCR
- —
- Eligible?
- —
Personal DTI + credit; lowest rate.
DSCR
20% down · 8.5% · 30yr
- Down + closing
- —
- Monthly P&I
- —
- Monthly cashflow
- —
- DSCR
- —
- Eligible?
- —
No personal income docs; deal must DSCR.
Hard money
10% down · 12.0% · 12mo
- Down + closing
- —
- Monthly P&I
- —
- Monthly cashflow
- —
- DSCR
- —
- Eligible?
- —
Short-term bridge; refi at stabilization.
Rent comps 27 comps
| Address | Beds | Baths | Sqft | Rent | $/sqft | DOM | Units | Dist |
|---|---|---|---|---|---|---|---|---|
| 215 Andy St Fayetteville, NC | 1.0 | 1.0 | 600 | $850 | $1.42 | 23d | 1 | 0.32mi |
| 5112 Cannon St Fayetteville, NC | 2.0 | 1.0 | 750 | $949 | $1.27 | 14d | 1 | 0.34mi |
| 5109 Higgins St Fayetteville, NC | 2.0 | 1.0 | 862 | $1,000 | $1.16 | 23d | 1 | 0.37mi |
| 421 Squirrel St Unit A Fayetteville, NC | 2.0 | 1.0 | 780 | $900 | $1.15 | 23d | 1 | 0.44mi |
| 1130 Annondale Way Fayetteville, NC | 1.0–3.0 | 1.0–2.5 | 1180 | $1,942 | $1.65 | 14d | 6 | 0.48mi |
| 4916 Schmidt St Fayetteville, NC | 2.0 | 1.0 | 801 | $945 | $1.18 | 23d | 1 | 0.53mi |
| 4959 Fieldcrest Dr Fayetteville, NC | 1.0 | 1.0 | 850 | $725 | $0.85 | 14d | 1 | 0.53mi |
| 209 Gertrude St Fayetteville, NC | 1.0 | 1.0 | 600 | $1,000 | $1.67 | 23d | 1 | 0.56mi |
| 211 Gertrude St Fayetteville, NC | 1.0 | 1.0 | 600 | $1,000 | $1.67 | 23d | 1 | 0.56mi |
| 4943 Fieldcrest Dr Unit B Fayetteville, NC | 1.0 | 1.0 | 825 | $799 | $0.97 | 23d | 1 | 0.58mi |
| 4981 Galveston Dr Fayetteville, NC | 2.0 | 1.5 | 750 | $1,050 | $1.40 | 23d | 1 | 0.59mi |
| 844 Anita Rd Fayetteville, NC | 2.0 | 1.0 | 850 | $850 | $1.00 | 14d | 1 | 0.78mi |
| 622 Dashland Dr Unit A Fayetteville, NC | 1.0 | 1.0 | 700 | $835 | $1.19 | 14d | 1 | 0.79mi |
| 622 Dashland Dr Unit B Fayetteville, NC | 2.0 | 1.5 | 750 | $940 | $1.25 | 14d | 1 | 0.79mi |
| 1025 Hirschfeld Dr Fayetteville, NC | 1.0–3.0 | 1.0–2.0 | 1112 | $1,730 | $1.56 | 14d | 17 | 0.80mi |
| 117 N Helen St Unit 117 Fayetteville, NC | 2.0 | 1.0 | 600 | $1,500 | $2.50 | 23d | 1 | 0.81mi |
| 1000 Antietam Crk Dr Fayetteville, NC | 3.0 | 1.0–2.0 | 1059 | $1,567 | $1.48 | 23d | 14 | 0.84mi |
| 3050 Plantation Garden Blvd Fayetteville, NC | 1.0–3.0 | 1.0–2.0 | 1158 | $1,512 | $1.30 | 14d | 58 | 0.92mi |
| 1909 Tryon Dr #7 Fayetteville, NC | 2.0 | 2.0 | 1060 | $1,050 | $0.99 | 23d | 1 | 0.98mi |
| 4420 Blanton Rd Unit 4420-H Fayetteville, NC | 2.0 | 1.5 | 990 | $1,025 | $1.04 | 14d | 1 | 1.02mi |
| 1882 Tryon Dr #4 Fayetteville, NC | 2.0 | 2.0 | 1063 | $1,100 | $1.03 | 14d | 1 | 1.04mi |
| 1861 Tryon Dr Unit 3 Fayetteville, NC | 2.0 | 2.0 | 1050 | $995 | $0.95 | 23d | 1 | 1.09mi |
| 1849 Tryon Dr Fayetteville, NC | 2.0 | 2.0 | 1061 | $998 | $0.94 | 23d | 2 | 1.09mi |
| 710 Villagio Pl Fayetteville, NC | 1.0–2.0 | 1.0–2.0 | 984 | $1,686 | $1.71 | 14d | 9 | 1.16mi |
| 1808 Tryon Dr Fayetteville, NC | 2.0 | 2.0 | 1066 | $995 | $0.93 | 23d | 1 | 1.16mi |
| 5414 Plateau Rd Fayetteville, NC | 3.0 | 2.0 | 1116 | $1,595 | $1.43 | 23d | 1 | 1.32mi |
| 513 Lumberly Ln Fayetteville, NC | 2.0 | 2.0 | 1124 | $1,295 | $1.15 | 23d | 1 | 1.48mi |
Listing history 22 events
-
2026-06-18days on market $44,000 Active 199 DOM
-
2026-06-17days on market $44,000 Active 198 DOM
-
2026-06-16days on market $44,000 Active 197 DOM
-
2026-06-15days on market $44,000 Active 196 DOM
-
2026-06-14days on market $44,000 Active 194 DOM
-
2026-06-13days on market $44,000 Active 193 DOM
-
2026-06-10days on market $44,000 Active 191 DOM
-
2026-06-09days on market $44,000 Active 190 DOM
-
2026-06-08days on market $44,000 Active 189 DOM
-
2026-06-07days on market $44,000 Active 188 DOM
-
2026-06-03days on market $44,000 Active 184 DOM
-
2026-06-02days on market $44,000 Active 183 DOM
-
2026-06-01days on market $44,000 Active 182 DOM
-
2026-05-31days on market $44,000 Active 181 DOM
-
2026-05-30days on market $44,000 Active 180 DOM
-
2026-05-20price $44,000
-
2026-04-27price $45,000
-
2026-03-06price $49,000
-
2025-12-22price $49,500
-
2025-12-01$62,500 Active
-
2014-05-13historical
-
2013-06-02$485,000
ⓘ Source: listings_history table (triggers on properties + properties_extension) + one-shot
backfill from property_details.listing_events for pre-trigger history.
Nearby sold comps map
Loading sold comps map…
Walkable amenities ~0.75 mi
Loading nearby amenities…
Taxation est. · year 1
- Rental income
- $13,686
- − Mortgage interest
- −$2,465
- − Property taxes
- −$660
- − Insurance
- −$220
- − Repairs & maintenance
- −$1,095
- − Management
- −$1,095
- − Depreciation
- −$1,280
- Taxable income
- $6,872
- Est. tax owed @ 24.0%
- −$1,649
- After-tax cash flow
- $5,514/yr
For passive investors: Depreciation is non-cash, so a rental often shows a tax loss while cash-flowing — sheltering income. Rental losses are passive: they offset passive income freely, and up to $25,000/yr can offset ordinary (W-2) income if you actively participate and your MAGI is under $100k (phasing out to $0 by $150k); unused losses carry forward. On sale, claimed depreciation is recaptured at up to 25%, and gains may owe capital-gains tax (a 1031 exchange can defer both). Figures are a year-1 estimate at your 24.0% rate — not tax advice; consult a CPA.
Schools (NCES district)
- District
- Cumberland County Schools
- NCES district ID
- 3700011
- Math proficiency
- 32% ▼ -2.00%
- Reading proficiency
- 41% ▼ -1.00%
- Median HH income
- $44,168
- Composite
- 31.0/100
- National rank
- #6096
- State rank
- #126 of 178 in NC
Livability — Fayetteville
- Score
- 75/100
- State rank
- #45
- US rank
- #4031
Category grades
Schools grade is shown separately in the Schools card above.
Census & demographics
- Census place
- Fayetteville, NC
- County
- Cumberland County · 265,314 people
- City population
- 226,118
- Metro
- Fayetteville, NC
- Population (ZIP)
- 30,965
- Household income
- $58,223
- Rent vs Own
- Severe rent burden
- 1370.0
Population outlook (Cumberland County) Hauer SSP2
- Today (2025)
- 330,855 people
- By 2030
- 333,523 · +0.8%
- By 2040
- 335,583 · +1.4%
- By 2050
- 335,325 · +1.4%
- By 2075
- 342,853 · +3.6%
- By 2100
- 340,698 · +3.0%
Race, ethnicity, and origin ACS 2023
- Neighborhood character
- Diverse neighborhood (Simpson 0.70)
- Race & ethnicity
- White 39% Black 37% Two or more races 11% Hispanic / Latino 10% Asian 4% Pacific Islander 1%
- Hispanic origin (detail)
- Mexican 2% Puerto Rican 3%
- Common ancestry
- Slovak 3% Serbian 1% Lithuanian 1%
- Foreign-born
- 9% · Canada, South Korea, Vietnam
- Languages at home
- 86% English-only · Spanish 7% Other Asian/Pacific 2% Korean 1%
Political lean MEDSL · Cumberland
- 2024 margin
- D (+13.4) · D 56.1% · R 42.7% · Other 1.2%
- 2008→2024 swing
- -4.3pp toward R · 2008: 17.7pp · 2024: 13.4pp
- All cycles
- 2024: D+13.4 2020: D+16.6 2016: D+16.0 2012: D+19.7 2008: D+17.7
Not yet ingested
- Civics
- —
Market trends
- HPI YoY
- ▼ -77.14%
- Current HPI
- 226.5097
- Rent YoY
- ▲ 3.01%
- Metro
- Fayetteville, NC
- State GDP YoY
- ▲ 3.28%
- F500 in state
- 26
Industry mix (Fortune 500 HQ in NC)
| Industry | F500 HQs | Revenue |
|---|---|---|
| Financial Services | 2 | $213B |
|
||
| Retail | 2 | $95B |
|
||
| Industrial Conglomerate | 1 | $38B |
|
||
| Metals / Steel | 1 | $35B |
|
||
| Utilities | 1 | $30B |
|
||
| Industrial Machinery | 1 | $19B |
|
||
Price history
-90.9% since first listed7 events — show timeline
- 2026-05-20 Price Changed $44,000 LPRMLS
- 2026-04-27 Price Changed $45,000 LPRMLS
- 2026-03-06 Price Changed $49,000 LPRMLS
- 2025-12-22 Price Changed $49,500 LPRMLS
- 2025-12-01 Listed $62,500 LPRMLS
- 2014-05-13 Listing Removed — TMLS
- 2013-06-02 Listed $485,000 TMLS
Property tax history
+0.7%/yrLatest (2025): $8,846 · -10.1% YoY. Source: county tax records.
Cash-flow waterfall
monthlySold comps — $/sqft
last 12 mo · ≤1 miLoading sold comps…