 Fourplex
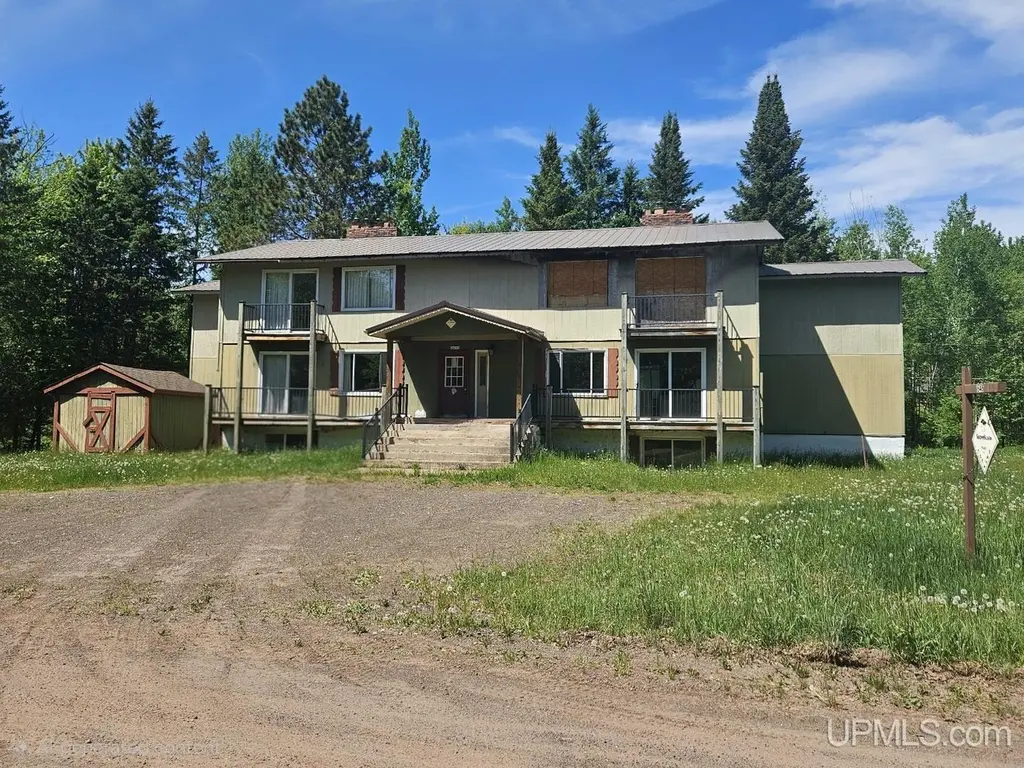
E6242 Snowdrift St · Ironwood, MI
Flood risk No data
- FEMA flood zone
- —
- Chance of flooding over 30 yrs
- —
- Est. flood insurance / yr
- —
Fire risk No data
- Est. fire insurance / yr
- —
Heat risk No data
- Hot days now (above threshold)
- —
- Hot days in 30 yrs
- —
Wind risk No data
- Chance of severe wind over 30 yrs
- —
Air-quality risk No data
- Unhealthy air days now
- —
- Unhealthy air days in 30 yrs
- —
Risk factors via First Street. Map © Google.
Why this score? — see what drove the B- grade
The composite is a weighted blend of 9 inputs, each scored 0–100. Each bar is that input's sub-score; the figure is the points it added to the 100-point composite (weight × sub-score).
- Cash flow +30.0/30.0
- 1% rule +10.0/10.0
- DSCR +10.0/10.0
- ARV discount +7.5/15.0
- Livability +3.5/5.0
- Schools +2.6/10.0
- Rent growth +2.5/5.0
- Condition / age +2.2/5.0
- Appreciation +0.0/10.0
$197,500
🖨 Deal sheet (PDF) 📄 Offer letter ✓ Due diligence
Multi-family units
County records classify this as Multi-Family (5+ Unit). Listing-text estimate: 4 units. estimate disagrees with records
5+ unit building — per-unit beds/baths from public records are typically unavailable; the breakdown below (if shown) is an estimate from the listing text.
Listing remarks MLS
Investment opportunity! Restoration-ready multi-unit located in the Big Powderhorn ski village- just a few blocks from the slopes. “Snowblind Chalet” offers six spacious units featuring an open concept living, dining, kitchen area with gas fireplace and each with its own hot tub room and adjacent cedar paneled full bath. Building consists of five 2BR, 2BA units and one (lower level) 1BR, 2BA unit. Lower-level laundry/utility room, natural gas hot water heat. Property is being sold AS IS, in its current condition. One upper-level unit sustained fire damage and the unit below; water damage. Professional remediation included removal of damaged/affected materials to the wall studs/framing. Exposed framing and surfaces were subsequently cleaned and coated with a sealant/encapsulating primer. So much possibility and income potential! Buy now and have units ready to go for the coming snow season!
Key facts
- 0.36 acre lot
- 3 parking spots
- Built 1981
Property features AI
Finance
- Financial info: Multi-family with 6 total units; Unit 1 currently not occupied
Exterior
- Parking: 3 or more parking spaces
- Utilities: Electricity available; Natural gas available; Public sanitary sewer; Private drilled well; Water available; Electric and gas water heaters; Heating: boiler, hot water, radiant and zoned heating; No central cooling
- Home design: Multi-family property; Investment property; Tri-level structure; Conventional frame style; Built in 1981; Located in Powderhorn Village subdivision; At/near ski resort (Big Powderhorn Mountain)
- Construction: Basement foundation; Partially finished, block and exposed basement areas
- Exterior features: Wood and hardboard siding; Porch; Exterior balcony; Shed; Unpaved lot; City/county gravel year-round road access
Interior
- Kitchen: Eat-in kitchen; Range / oven; Microwave; Refrigerator; Dishwasher (not explicitly listed but commonly included — excluded since not provided)
- Bedrooms: First-floor bedroom
- Bathrooms: Main floor full bathroom; Master bedroom bath; Whirlpool / hot tub; 12 full bathrooms (total 12 baths)
- Interior features: Spa / jetted tub; Window treatments; Furnished; Has basement
- Laundry & utility: Washer and dryer included; Lower-level laundry; Utility / laundry room
Neighborhood map
What this means for you Summary
Snapshot
- This is a 4 × 3-bed/?-bath units multifamily listed at $198k. Condition is rated fair.
Deal economics
- At list price, monthly cash flow is $3k ($39k/yr) — positive. Per door: $808/mo.
- The deal already cash-flows at list — no discount required.
- Meets the 1% rule at list price ($6k rent vs $198k).
- Recommended offer: $195k (1.5% below list) — sets the bar for market timing.
- Cap rate 25.9% vs local median 5.7% in Ironwood — top-decile yield for the area; either an underpriced asset or a hidden risk that comps aren't pricing in. Stress-test before assuming the spread holds.
Location & tenants
- Location reads 70/100 on livability (#325 in MI) — a middle-class / working-renter tenant base. Strengths: cost of living A+, crime A, housing A; Watch: health & safety C-, amenities F, commute F.
- Ironwood Area Schools Of Gogebic County (town): math 23% / reading 40% proficiency, ranked #361 of 540 in MI (top 67%) — families likely to look elsewhere, expect single-tenant / working-renter base with shorter leases.
- Zoned schools: Gogebic Co Community Education (28 students, 79% FRL) — zoned schools average 79% FRL vs 49% district-wide (29 pts higher); higher-poverty schools than district average — tighter screening recommended.
- Market conditions: 70 active listings in the ZIP; 28 units permitted in Gogebic County in 2024 (0 in 5+ unit buildings).
Forward outlook
- Local home prices are declining (-3.0%/yr); year-one equity from $1k of loan paydown is wiped out by about $6k of value loss. Plan a longer hold.
- Gogebic County population projected at -24% by 2050 — secular population decline; favor cash flow + early exit over multi-decade hold.
- At projected returns (-3.0% appreciation + 3.0% rent growth), your $55k cash investment doubles in ~2 years — after that, you're playing with house money.
Negotiation context
- It's been on market 17 days — a 2% lower offer ($195k) is reasonable based on typical stale-listing flexibility.
- 2 sale attempts with the ask held roughly flat each time — persistent listings suggest the price (not the market) is what's stuck; bring a comps-based counter.
Questions for the listing agent
- Can we see the unit-by-unit rent roll, current vacancy, and any below-market leases? What's the average tenancy length?
- What capital expenditures (roof, boiler, parking lot, exteriors) have been made in the last 5 years, and what's planned in the next 2?
- Have any recent inspections been done? Can we get a copy of the seller's disclosures and any deferred-maintenance estimates?
- Is there a deadline driving the sale (1031 exchange, divorce, estate, relocation)? That informs how much negotiation room exists.
- Schools are D-rated, which usually means shorter tenancies and higher turnover. Who's the typical renter profile here, and what's been the actual vacancy rate?
- What's the average days-on-market for RENTAL listings here right now (not sales)? A rising rental-DOM trend means longer vacancies and softer asking-rent achievability than the comps imply.
- What's the recent tenant-quality profile in this submarket — average credit score on applications, eviction rate, late-payment / NSF rate, and stable-employment percentage? A property-management company in the area should have these aggregated.
- How much new apartment / multifamily construction is in the pipeline within 1–3 miles? Heavy new supply (>2% of stock underway) typically softens rents 12–24 months out; light construction supports rent growth.
Investment metrics
- 1% rule
- 2.95% ✓
- Cap rate
- 25.93%
- Cash-on-cash
- 70.12%
- DSCR
- 4.12
- GRM
- 2.8
CMA / ARV
No comps found within radius.
Projected returns pro-forma
-3.0% appreciation · 3.0% rent growth · sell at horizon
- IRR
- 69.7%
- Equity multiple
- 4.14×
- Total profit
- $173,890
- Equity at exit
- $29,448
- IRR
- 73.7%
- Equity multiple
- 8.54×
- Total profit
- $416,785
- Equity at exit
- $17,076
Cash invested: $55,300 (down + closing). Projections, not guarantees.
Landlord ↔ Tenant lean methodology
- Overall (STATE)
- 62 Landlord-Friendly
- State Michigan
- 62 Landlord-Friendly · EVEN
- County
- — inherits STATE
- City
- — inherits STATE
ZIP-level market 49938
- Home prices YoY
- -23.3%
- Active inventory
- 70
- Price-to-rent
- 11.3×
Monthly cashflow live
- Estimated rent
- $5,818 medium interval (Pro) →
- Mortgage (P&I)
- −$1,036
- Tax est. 1.5%
- −$247 /mo · $2,962/yr
- Insurance
- −$82
- HOA
- −$0
- Vacancy / Maint / Mgmt
- −$1,222
- Net cashflow
- $3,231
Break-even live
Sensitivity live
| Price | -10% $3,368 | -5% $3,300 | +0% $3,231 | +5% $3,163 | +10% $3,095 |
|---|---|---|---|---|---|
| Rent | -10% $2,772 | -5% $3,002 | +0% $3,231 | +5% $3,461 | +10% $3,691 |
| Rate | -1.0pp $3,331 | -0.5pp $3,282 | base $3,231 | +0.5pp $3,180 | +1.0pp $3,128 |
4-unit breakdown (identical units grouped — click to expand)
| Units | Beds | Baths | Est. rent |
|---|---|---|---|
| 4× units | 3 | — | $5,816 |
| #1 | 3 | — | $1,454 |
| #2 | 3 | — | $1,454 |
| #3 | 3 | — | $1,454 |
| #4 | 3 | — | $1,454 |
| Total (4 units) | $5,818 | ||
UW: 25.0% down · 7.5% · 30yr · 1.5% tax · 5.0% vac · 8.0% maint · 8.0% mgmt
Financing live
Cash to close
- Down payment
- $49,375
- Closing costs
- $5,925
- Reserves months
- —
- Total cash needed
- —
Loan-product check · same deal, 3 products live
Conventional
25% down · 7.5% · 30yr
- Down + closing
- —
- Monthly P&I
- —
- Monthly cashflow
- —
- DSCR
- —
- Eligible?
- —
Personal DTI + credit; lowest rate.
DSCR
20% down · 8.5% · 30yr
- Down + closing
- —
- Monthly P&I
- —
- Monthly cashflow
- —
- DSCR
- —
- Eligible?
- —
No personal income docs; deal must DSCR.
Hard money
10% down · 12.0% · 12mo
- Down + closing
- —
- Monthly P&I
- —
- Monthly cashflow
- —
- DSCR
- —
- Eligible?
- —
Short-term bridge; refi at stabilization.
Listing history 13 events
-
2026-06-21days on market $197,500 Active 17 DOM
-
2026-06-21days on market $197,500 Active 16 DOM
-
2026-06-18days on market $197,500 Active 14 DOM
-
2026-06-17days on market $197,500 Active 13 DOM
-
2026-06-16days on market $197,500 Active 12 DOM
-
2026-06-15days on market $197,500 Active 11 DOM
-
2026-06-13days on market $197,500 Active 9 DOM
-
2026-06-12days on market $197,500 Active 8 DOM
-
2026-06-09days on market $197,500 Active 5 DOM
-
2026-06-08days on market $197,500 Active 4 DOM
-
2026-06-07days on market $197,500 Active 3 DOM
-
2026-06-07remarks 687-char remark
-
2026-06-07$197,500 Active 2 DOM
ⓘ Source: listings_history table (triggers on properties + properties_extension) + one-shot
backfill from property_details.listing_events for pre-trigger history.
Nearby sold comps map
Loading sold comps map…
Walkable amenities ~0.75 mi
Loading nearby amenities…
Taxation est. · year 1
- Rental income
- $69,816
- − Mortgage interest
- −$11,063
- − Property taxes
- −$2,962
- − Insurance
- −$988
- − Repairs & maintenance
- −$5,585
- − Management
- −$5,585
- − Depreciation
- −$5,745
- Taxable income
- $37,887
- Est. tax owed @ 24.0%
- −$9,093
- After-tax cash flow
- $29,683/yr
For passive investors: Depreciation is non-cash, so a rental often shows a tax loss while cash-flowing — sheltering income. Rental losses are passive: they offset passive income freely, and up to $25,000/yr can offset ordinary (W-2) income if you actively participate and your MAGI is under $100k (phasing out to $0 by $150k); unused losses carry forward. On sale, claimed depreciation is recaptured at up to 25%, and gains may owe capital-gains tax (a 1031 exchange can defer both). Figures are a year-1 estimate at your 24.0% rate — not tax advice; consult a CPA.
Condition & rehab AI · 13 photos
This multi-family property requires extensive repairs and updates to its roof, exterior, interior, and landscaping. Upgrading these areas would significantly increase its resale and rental value.
Repairs flagged
- Major Roof — The independent satellite image shows visible wear and tear on the roof.
- Major Exterior siding — The independent satellite image shows visible wear and tear on the exterior siding.
- Major Paint — The interior photos show walls with peeling paint and some discoloration.
- Major Flooring — The interior photos show carpeted flooring in fair condition, with some wear visible.
- Major Bathrooms — The interior photos show bathrooms with dated fixtures and some wear.
- Major HVAC system — The interior photos show signs of wear on the heating system.
- Major Landscaping — The independent satellite image shows a lot with overgrown vegetation.
Value-add opportunities
- Resale New roof — A new roof would significantly improve the home's curb appeal and overall condition, making it more attractive to potential buyers.
- Resale Exterior siding and paint — Updating the exterior siding and repainting would improve the home's curb appeal and overall condition, making it more attractive to potential buyers.
- Resale Flooring — Replacing the carpeted flooring with a more modern and durable option would improve the home's overall condition and make it more attractive to potential buyers.
- Resale Bathrooms — Updating the bathrooms with new fixtures and finishes would improve the home's overall condition and make it more attractive to potential buyers.
- Resale HVAC system — Upgrading the HVAC system would improve the home's comfort and energy efficiency, making it more attractive to potential buyers.
- Resale Landscaping — Landscaping the property would improve the home's curb appeal and overall condition, making it more attractive to potential buyers.
Renovation cost estimate screening
| Repair item | Severity | Est. cost |
|---|---|---|
| Roof · The independent satellite image shows visible wear and tear on the roof. | Major | $15,000–50,000 |
| Exterior siding · The independent satellite image shows visible wear and tear on the exterior siding. | Major | $15,000–50,000 |
| Paint · The interior photos show walls with peeling paint and some discoloration. | Major | $15,000–50,000 |
| Flooring · The interior photos show carpeted flooring in fair condition, with some wear visible. | Major | $15,000–50,000 |
| Bathrooms · The interior photos show bathrooms with dated fixtures and some wear. | Major | $15,000–50,000 |
| HVAC system · The interior photos show signs of wear on the heating system. | Major | $15,000–50,000 |
| Landscaping · The independent satellite image shows a lot with overgrown vegetation. | Major | $15,000–50,000 |
| Total estimated repair cost · 7 items | $105,000–350,000 |
Value-add ROI direction
- Resale New roof — A new roof would significantly improve the home's curb appeal and overall condition, making it more attractive to potential buyers. ↑
- Resale Exterior siding and paint — Updating the exterior siding and repainting would improve the home's curb appeal and overall condition, making it more attractive to potential buyers. ↑
- Resale Flooring — Replacing the carpeted flooring with a more modern and durable option would improve the home's overall condition and make it more attractive to potential buyers. ↑
- Resale Bathrooms — Updating the bathrooms with new fixtures and finishes would improve the home's overall condition and make it more attractive to potential buyers. ↑
- Resale HVAC system — Upgrading the HVAC system would improve the home's comfort and energy efficiency, making it more attractive to potential buyers. ↑
- Resale Landscaping — Landscaping the property would improve the home's curb appeal and overall condition, making it more attractive to potential buyers. ↑
ⓘ Cost ranges are severity-bucket heuristics (US national rule-of-thumb). Get contractor quotes + a written scope before underwriting a rehab budget.
Schools (NCES district)
- District
- Ironwood Area Schools Of Gogebic County
- NCES district ID
- 2619470
- Math proficiency
- 23% ▼ -13.00%
- Reading proficiency
- 40% ▼ -5.00%
- Median HH income
- $33,313
- Composite
- 25.78/100
- National rank
- #7369
- State rank
- #361 of 540 in MI
Livability — Ironwood
- Score
- 70/100
- State rank
- #325
- US rank
- #8024
Category grades
Schools grade is shown separately in the Schools card above.
Census & demographics
- Population (ZIP)
- 7,424
Population outlook (Gogebic County) Hauer SSP2
- Today (2025)
- 13,951 people
- By 2030
- 13,191 · -5.4%
- By 2040
- 11,739 · -15.9%
- By 2050
- 10,580 · -24.2%
- By 2075
- 8,530 · -38.9%
- By 2100
- 6,903 · -50.5%
Race, ethnicity, and origin ACS 2023
- Neighborhood character
- Predominantly White (94%)
- Race & ethnicity
- White 94% Two or more races 3% Hispanic / Latino 2%
- Common ancestry
- Romanian 10% Lithuanian 4% Portuguese 3%
- Foreign-born
- 1%
- Languages at home
- 97% English-only · Spanish 2%
Political lean MEDSL · Gogebic
- 2024 margin
- R (+17.1) · D 40.8% · R 57.9% · Other 1.2%
- 2008→2024 swing
- -34.4pp toward R · 2008: 17.3pp · 2024: -17.1pp
- All cycles
- 2024: R+17.1 2020: R+12.5 2016: R+15.0 2012: D+8.1 2008: D+17.3
Not yet ingested
- Civics
- —
Market trends
- HPI YoY
- ▼ -61.86%
- Current HPI
- 204.0924
- Rent YoY
- —
- Metro
- —
- State GDP YoY
- ▲ 1.37%
- F500 in state
- 28
Industry mix (Fortune 500 HQ in MI)
| Industry | F500 HQs | Revenue |
|---|---|---|
| Automotive Parts | 3 | $48B |
|
||
| Automotive | 2 | $372B |
|
||
| Chemicals | 1 | $45B |
|
||
| Automotive Retail | 1 | $29B |
|
||
| Healthcare / Medical Devices | 1 | $23B |
|
||
| Automotive Technology | 1 | $20B |
|
||
Price history
+0.0% since first listed2 events — show timeline
- 2026-06-04 Listed $197,500 UPAR
- 2026-06-04 Listed $197,500 MiRealSource-MiMLS
Cash-flow waterfall
monthlySold comps — $/sqft
last 12 mo · ≤1 miLoading sold comps…