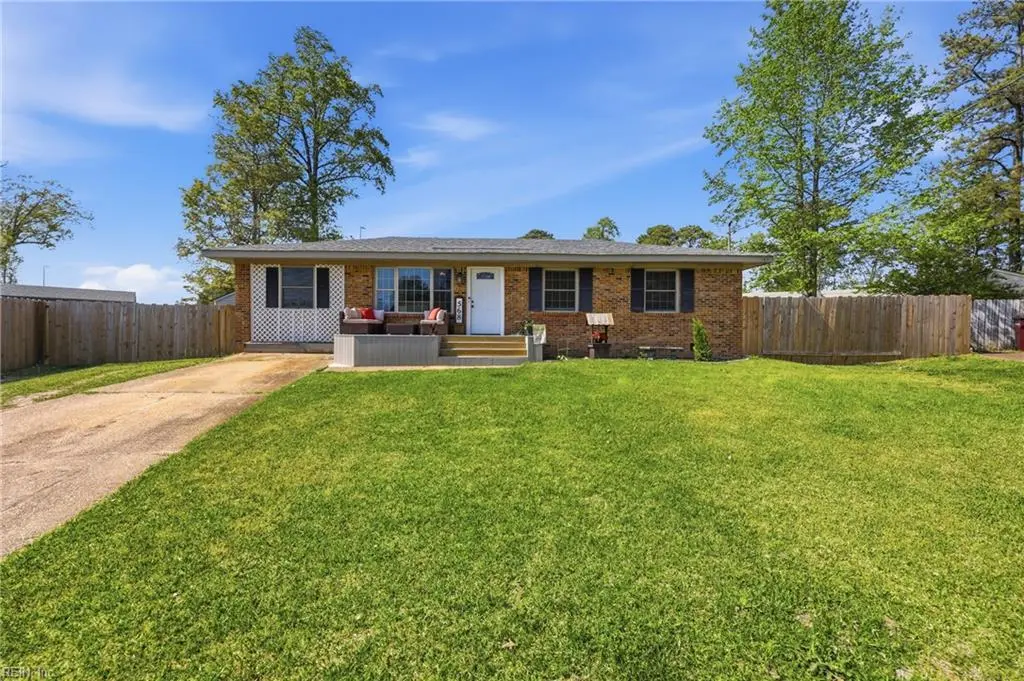
568 Trent Ave · Chesapeake, VA
Flood risk 1/10 · Minimal
- FEMA flood zone
- X (unshaded)
- Chance of flooding over 30 yrs
- 0.0%
- Est. flood insurance / yr
- $507 – $1,088
Fire risk 1/10 · Minimal
- Est. fire insurance / yr
- $666 – $1,236
Heat risk 9/10 · Severe
- Hot days now (above 107°F)
- 7 days/yr
- Hot days in 30 yrs
- 16 days/yr
Wind risk 8/10 · Major
- Chance of severe wind over 30 yrs
- 80.0%
Air-quality risk 5/10 · Moderate
- Unhealthy air days now
- 6 days/yr
- Unhealthy air days in 30 yrs
- 7 days/yr
Risk factors via First Street. Map © Google.
Why this score? — see what drove the D- grade
The composite is a weighted blend of 9 inputs, each scored 0–100. Each bar is that input's sub-score; the figure is the points it added to the 100-point composite (weight × sub-score).
- Cash flow +12.8/30.0
- Schools +5.8/10.0
- Rent growth +4.0/5.0
- DSCR +3.8/10.0
- ARV discount +3.6/15.0
- Livability +3.5/5.0
- 1% rule +3.0/10.0
- Condition / age +2.5/5.0
- Appreciation +0.0/10.0
$340,000
🖨 Deal sheet (PDF) 📄 Offer letter ✓ Due diligence
Listing remarks
Discover refined single story living in this brick ranch home, ideally situated on a quiet cul-de-sac. Meticulously renovated, the home features a beautiful open kitchen with custom cabinetry, granite countertops, stainless steel appliances, designer backsplash, and premium fixtures. Interior updates include fresh paint, new flooring throughout, and fully modernized electrical and plumbing systems. Major systems have been thoughtfully replaced for long-term value: HVAC (Dec 2021), roof and water heater (2020). The exterior offers elevated outdoor living with a large, newly fenced yard, perfect for entertaining or private recreation plus a detached garage with a new roof, providing exception
Key facts
- Custom cabinetry
- Quiet cul-de-sac
- Brick ranch home
Tags
Property features AI
Finance
- HOA & community: No HOA fees
Exterior
- Parking: Detached 1-car garage; Driveway parking; Street parking; Garage approximately 320 sq ft
- Utilities: City/County water; City/County sewer; Electric water heater; Electric power
- Home design: Detached ranch; Single-story; Crawl foundation; Simple ownership
- Construction: Brick and vinyl exterior; Crawl space foundation; Asphalt shingle roof
- Exterior features: Brick and vinyl siding; Back privacy fence; Asphalt shingle roof; Lot approximately 0.304 acres with 50' frontage
Interior
- Kitchen: Electric range; Microwave; Refrigerator; Garbage disposal
- Bedrooms: First-floor bedroom with full bathroom
- Flooring: Ceramic; Laminate
- Bathrooms: 2 full bathrooms
- Heating & cooling: Central air conditioning; Electric forced hot air; Programmable thermostat
- Interior features: Ceramic and laminate flooring; Bedroom and full bathroom on first floor; 7 total rooms
- Laundry & utility: Washer hookup; Dryer hookup
Neighborhood map
What this means for you Summary
Snapshot
- This is a 4-bed/2.0-bath single-family listed at $340k.
Deal economics
- At list price, monthly cash flow is $-34 ($-405/yr) — negative.
- To cash-flow at today's rent, offer at most $334k (1.8% below list).
- To meet the 1% rule (rent ≥ 1% of price), the offer needs to be $272k (20.0% below list).
- Recommended offer: $272k (20.0% below list) — sets the bar for 1% rule.
- Cap rate 6.2% vs local median 3.7% in Chesapeake — top-decile yield for the area; either an underpriced asset or a hidden risk that comps aren't pricing in. Stress-test before assuming the spread holds.
Location & tenants
- Location reads 70/100 on livability (#236 in VA) — a middle-class / working-renter tenant base. Strengths: employment A+, housing A+; Watch: crime C-, cost of living C-, amenities F.
- Chesapeake City Public School District (suburban): math 58% / reading 74% proficiency, ranked #31 of 131 in VA (top 24%) — acceptable for families but not a draw, mixed tenant base, ~2y average lease.
- Zoned schools: Deep Creek Elementary (math 66% / reading 72%, grade A-, #351 of 1,108 statewide, top 32%, 763 students, 45% FRL); Deep Creek Middle (math 30% / reading 64%, grade D+, #257 of 342 statewide, top 77%, 770 students, 43% FRL); Deep Creek High (math 70% / reading 82%, grade A-, #102 of 319 statewide, top 32%, 1,597 students, 49% FRL) — zoned schools average 45% FRL vs 28% district-wide (18 pts higher); higher-poverty schools than district average — tighter screening recommended.
- Market conditions: Rents rising fast (+6.1%/yr); 184 active listings in the ZIP; 4 comparable units currently listed for rent nearby; rentals at typical pace (median 26d on market — plan ~3-4 weeks tenant-placement turnaround); solid renter incomes; 597 units permitted in Chesapeake city in 2024 (0 in 5+ unit buildings).
- This rent runs 30% of the median local income ($109k/yr) — at the standard rent-burdened threshold; future hikes will face affordability resistance.
Forward outlook
- Local home prices are declining (-3.0%/yr); year-one equity from $2k of loan paydown is wiped out by about $10k of value loss. Plan a longer hold.
- Chesapeake County population projected at +21% by 2050 — long-run rental-demand tailwind backs the buy-and-hold thesis.
Negotiation context
- It's been on market 17 days — a 2% lower offer ($335k) is reasonable based on typical stale-listing flexibility.
- 3 sale attempts since 5y ago with the ask held roughly flat each time — persistent listings suggest the price (not the market) is what's stuck; bring a comps-based counter.
Risks & watch-outs
- Climate carrying-cost: severe wind risk, 80% chance of damaging wind over 30y; extreme-heat days projected 7→16/yr by 2055 (HVAC capex compounding) — expect insurance premiums to compound above CPI over the hold.
Questions for the listing agent
- What do current leases actually rent for vs. the listed asking? Can we see a recent rent roll and the last 12 months of T-12 income?
- Built in 1971 — when were the roof, HVAC, electrical panel, plumbing, and water heater last replaced?
- Is there a deadline driving the sale (1031 exchange, divorce, estate, relocation)? That informs how much negotiation room exists.
- Schools are A-rated — typically a magnet for longer-tenancy family renters. What's the average tenant stay here, and is there a school-zone premium baked into asking?
- The area grade is low — what's the realistic commute time and amenity access for the typical tenant pool here? Any planned neighborhood developments (good or bad) we should know about?
- What's the average days-on-market for RENTAL listings here right now (not sales)? A rising rental-DOM trend means longer vacancies and softer asking-rent achievability than the comps imply.
- What's the recent tenant-quality profile in this submarket — average credit score on applications, eviction rate, late-payment / NSF rate, and stable-employment percentage? A property-management company in the area should have these aggregated.
- How much new for-sale + rental construction is in the pipeline within 1–3 miles? Heavy new supply typically softens prices + rents 12–24 months out; constrained supply supports both.
Investment metrics
- 1% rule
- 0.80% ✗
- Cap rate
- 6.17%
- Cash-on-cash
- -0.43%
- DSCR
- 0.98
- GRM
- 10.4
CMA / ARV
- ARV (on-the-fly)
- $312,816
- Comps found
- 10
Show comp detail 10 sales within ~0.75 mi
| Address | Dist | Beds/Ba | Sqft | Sold | Price | $/sf | Match |
|---|---|---|---|---|---|---|---|
| 2700 Hoyt Dr | 0.02mi | 3/1.0 (-1) | 1,314 (+12%) | 6mo | $332,000 | $253 | 65 |
| 2712 Fenway Ave | 0.17mi | 4/1.5 | 1,350 (+15%) | 1mo | $358,900 | $266 | 65 |
| 820 Henry Ave | 0.74mi | 3/1.5 (-1) | 1,176 (0%) | 1mo | $300,000 | $255 | 58 |
| 448 Plummer Dr | 0.53mi | 3/1.5 (-1) | 1,126 (-4%) | 4mo | $365,000 | $324 | 58 |
| 237 Stubbs Dr | 0.48mi | 3/2.0 (-1) | 1,240 (+5%) | 9mo | $340,000 | $274 | 56 |
| 2328 Skipjack Ln | 0.74mi | 3/2.0 (-1) | 1,164 (-1%) | 7mo | $365,000 | $314 | 53 |
| 473 W Blanche Dr | 0.70mi | 3/2.0 (-1) | 1,200 (+2%) | 13mo | $338,000 | $282 | 48 |
| 2741 Fenway Ave | 0.25mi | 3/1.0 (-1) | 1,014 (-14%) | 11mo | $230,000 | $227 | 48 |
| 2825 Willowwood Dr | 0.57mi | 3/1.5 (-1) | 1,272 (+8%) | 6mo | $305,000 | $240 | 47 |
| 2856 Flag Rd | 0.58mi | 3/1.0 (-1) | 1,319 (+12%) | 1mo | $325,000 | $246 | 43 |
Match score weights: distance 35% · size 25% · config 20% · recency 20%. Top-matched comps best support the ARV.
Projected returns pro-forma
-3.0% appreciation · 6.13% rent growth · sell at horizon
- IRR
- -13.8%
- Equity multiple
- 0.49×
- Total profit
- $-48,470
- Equity at exit
- $50,695
- IRR
- -0.9%
- Equity multiple
- 0.93×
- Total profit
- $-6,549
- Equity at exit
- $29,397
Cash invested: $95,200 (down + closing). Projections, not guarantees.
Landlord ↔ Tenant lean methodology
- Overall (STATE)
- 55 Moderately Landlord-Leaning
- State Virginia
- 55 Moderately Landlord-Leaning · D+2
- County
- — inherits STATE
- City
- — inherits STATE
ZIP-level market 23323
- Home prices YoY
- -21.8%
- Rents YoY
- 6.1%
- Active inventory
- 184
- Price-to-rent
- 10.4×
Monthly cashflow live
- Estimated rent
- $2,721 medium interval (Pro) →
- Mortgage (P&I)
- −$1,783
- Tax from tax record
- −$259 /mo · $3,105/yr
- Insurance
- −$142
- HOA
- −$0
- Vacancy / Maint / Mgmt
- −$571
- Net cashflow
- $-34
Break-even live
Sensitivity live
| Price | -10% $159 | -5% $62 | +0% $-34 | +5% $-130 | +10% $-226 |
|---|---|---|---|---|---|
| Rent | -10% $-249 | -5% $-141 | +0% $-34 | +5% $74 | +10% $181 |
| Rate | -1.0pp $137 | -0.5pp $53 | base $-34 | +0.5pp $-122 | +1.0pp $-212 |
UW: 25.0% down · 7.5% · 30yr · 1.5% tax · 5.0% vac · 8.0% maint · 8.0% mgmt
Financing live
Cash to close
- Down payment
- $85,000
- Closing costs
- $10,200
- Reserves months
- —
- Total cash needed
- —
Loan-product check · same deal, 3 products live
Conventional
25% down · 7.5% · 30yr
- Down + closing
- —
- Monthly P&I
- —
- Monthly cashflow
- —
- DSCR
- —
- Eligible?
- —
Personal DTI + credit; lowest rate.
DSCR
20% down · 8.5% · 30yr
- Down + closing
- —
- Monthly P&I
- —
- Monthly cashflow
- —
- DSCR
- —
- Eligible?
- —
No personal income docs; deal must DSCR.
Hard money
10% down · 12.0% · 12mo
- Down + closing
- —
- Monthly P&I
- —
- Monthly cashflow
- —
- DSCR
- —
- Eligible?
- —
Short-term bridge; refi at stabilization.
Rent comps 4 comps
| Address | Beds | Baths | Sqft | Rent | $/sqft | DOM | Units | Dist |
|---|---|---|---|---|---|---|---|---|
| 622 Wooddale Ct Chesapeake, VA | 4.0 | 2.0 | 1475 | $2,450 | $1.66 | 25d | 1 | 0.26mi |
| 2270 Grace St Chesapeake, VA | 3.0 | 2.0 | 1384 | $2,400 | $1.73 | 25d | 1 | 0.94mi |
| 2604 Townhouse Ln Chesapeake, VA | 1.0–3.0 | 1.5 | 1050 | $1,885 | $1.80 | 3d | 1 | 1.22mi |
| 2164 Shipyard Rd Chesapeake, VA | 4.0 | 2.0 | 1459 | $2,750 | $1.88 | 9d | 1 | 1.22mi |
Listing history 11 events
-
2026-05-03status Under Contract
-
2026-04-21historical Active Under Contract
-
2026-04-16$340,000 Active
-
2022-04-14soldstatus $320,000
-
2022-03-29status Under Contract
-
2022-03-22historical Active Under Contract
-
2022-03-18$299,000 Active
-
2021-12-17soldstatus $180,000
-
2021-11-15status Under Contract
-
2021-10-28$195,000 Active
-
2012-09-07soldstatus $149,000
ⓘ Source: listings_history table (triggers on properties + properties_extension) + one-shot
backfill from property_details.listing_events for pre-trigger history.
Tax reassessment forecast VA · Resets to sale price
- Current annual tax
- $3,105 · $259/mo
- Projected year-2 tax
- $3,105 · $259/mo
- Expected delta
- $0/yr ($0/mo · 0.0%)
ⓘ Screening estimate from a state-policy table — verify with the county assessor before closing.
Climate risk First Street
- Flood 1/10 Low FEMA zone X (unshaded) · 0% chance over 30 yrs
- Wildfire 1/10 Low
- Heat 9/10 Extreme 7 d/yr ≥107°F today · 16 d/yr by 30 yrs out
- Wind 8/10 Severe 80% chance of damaging wind over 30 yrs
- Air quality 5/10 Major 6 unhealthy d/yr today · 7 by 30 yrs out
Nearby sold comps map
Loading sold comps map…
Walkable amenities ~0.75 mi
Loading nearby amenities…
Taxation est. · year 1
- Rental income
- $32,652
- − Mortgage interest
- −$19,045
- − Property taxes
- −$3,105
- − Insurance
- −$1,700
- − Repairs & maintenance
- −$2,612
- − Management
- −$2,612
- − Depreciation
- −$9,891
- Taxable loss
- −$6,313
- Est. tax savings @ 24.0%
- +$1,515
- After-tax cash flow
- $1,110/yr
For passive investors: Depreciation is non-cash, so a rental often shows a tax loss while cash-flowing — sheltering income. Rental losses are passive: they offset passive income freely, and up to $25,000/yr can offset ordinary (W-2) income if you actively participate and your MAGI is under $100k (phasing out to $0 by $150k); unused losses carry forward. On sale, claimed depreciation is recaptured at up to 25%, and gains may owe capital-gains tax (a 1031 exchange can defer both). Figures are a year-1 estimate at your 24.0% rate — not tax advice; consult a CPA.
Schools (NCES district)
- District
- Chesapeake City Public School District
- NCES district ID
- 5100810
- Math proficiency
- 58% ▼ -29.00%
- Reading proficiency
- 74% ▼ -7.00%
- Median HH income
- $69,356
- Composite
- 57.84/100
- National rank
- #1047
- State rank
- #31 of 131 in VA
Livability — Chesapeake
- Score
- 70/100
- State rank
- #236
- US rank
- #7942
Category grades
Schools grade is shown separately in the Schools card above.
Census & demographics
- Census place
- Chesapeake, VA
- County
- Chesapeake City · 253,091 people
- City population
- 253,091
- Metro
- Virginia Beach-Norfolk-Newport News, VA-NC
- Population (ZIP)
- 43,043
- Household income
- $108,730
- Rent vs Own
- Severe rent burden
- 699.0
Population outlook (Chesapeake County) Hauer SSP2
- Today (2025)
- 263,804 people
- By 2030
- 276,798 · +4.9%
- By 2040
- 299,906 · +13.7%
- By 2050
- 318,284 · +20.7%
- By 2075
- 362,137 · +37.3%
- By 2100
- 372,225 · +41.1%
Race, ethnicity, and origin ACS 2023
- Neighborhood character
- Diverse neighborhood (Simpson 0.62)
- Race & ethnicity
- White 54% Black 27% Two or more races 11% Hispanic / Latino 8% Asian 3%
- Hispanic origin (detail)
- Mexican 2% Puerto Rican 4%
- Common ancestry
- Italian 3% Romanian 2% Slovak 2%
- Foreign-born
- 5% · Canada, South Korea, Jamaica
- Languages at home
- 93% English-only · Spanish 4% Tagalog/Filipino 1% Other Indo-European 1%
Political lean MEDSL · Chesapeake
- 2024 margin
- Toss-up / Even · D 51.3% · R 47.5% · Other 1.2%
- 2008→2024 swing
- +2.5pp toward D · 2008: 1.3pp · 2024: 3.8pp
- All cycles
- 2024: D+3.8 2020: D+6.5 2016: R+1.3 2012: D+1.1 2008: D+1.3
Not yet ingested
- Civics
- —
Market trends
- HPI YoY
- ▼ -86.09%
- Current HPI
- 309.6925
- Rent YoY
- ▲ 6.13%
- Metro
- Virginia Beach-Norfolk-Newport News, VA-NC
- State GDP YoY
- ▲ 2.40%
- F500 in state
- 50
Industry mix (Fortune 500 HQ in VA)
| Industry | F500 HQs | Revenue |
|---|---|---|
| Aerospace / Defense | 4 | $236B |
|
||
| Technology / Defense | 3 | $32B |
|
||
| Financial Services | 2 | $176B |
|
||
| Utilities | 2 | $27B |
|
||
| Insurance | 2 | $25B |
|
||
| Technology | 2 | $15B |
|
||
Price history
+128.2% since first listed11 events — show timeline
- 2026-05-03 Pending — REINMLS
- 2026-04-21 Contingent — REINMLS
- 2026-04-16 Listed $340,000 REINMLS
- 2022-04-14 Sold (Public Records) $320,000 Public Records
- 2022-03-29 Pending — REINMLS
- 2022-03-22 Contingent — REINMLS
- 2022-03-18 Listed $299,000 REINMLS
- 2021-12-17 Sold (Public Records) $180,000 Public Records
- 2021-11-15 Pending — REINMLS
- 2021-10-28 Listed $195,000 REINMLS
- 2012-09-07 Sold (Public Records) $149,000 Public Records
Property tax history
+4.4%/yrLatest (2025): $3,105 · +4.7% YoY. Source: county tax records.
Cash-flow waterfall
monthlySold comps — $/sqft
last 12 mo · ≤1 miLoading sold comps…