 🏷️ Likely Rental
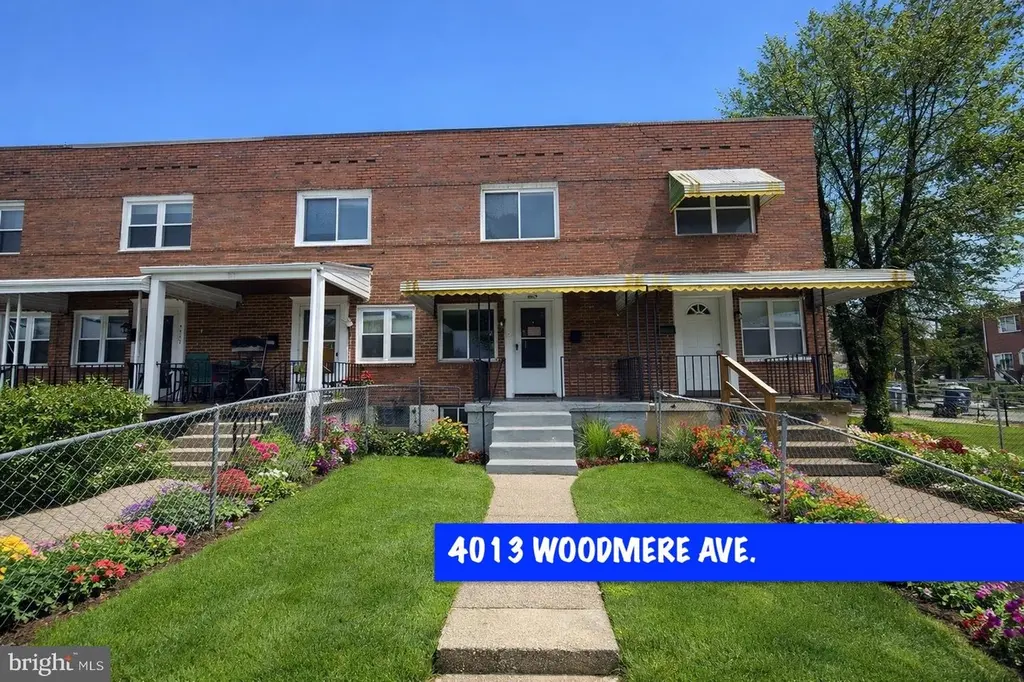
4013 Woodmere Ave · Baltimore, MD
Flood risk 1/10 · Minimal
- FEMA flood zone
- X (unshaded)
- Chance of flooding over 30 yrs
- 0.0%
- Est. flood insurance / yr
- $473 – $860
Fire risk 1/10 · Minimal
- Est. fire insurance / yr
- $755 – $1,403
Heat risk 7/10 · Major
- Hot days now (above 103°F)
- 7 days/yr
- Hot days in 30 yrs
- 15 days/yr
Wind risk 4/10 · Minor
- Chance of severe wind over 30 yrs
- 21.0%
Air-quality risk 3/10 · Minor
- Unhealthy air days now
- 3 days/yr
- Unhealthy air days in 30 yrs
- 4 days/yr
Risk factors via First Street. Map © Google.
Why this score? — see what drove the B grade
The composite is a weighted blend of 9 inputs, each scored 0–100. Each bar is that input's sub-score; the figure is the points it added to the 100-point composite (weight × sub-score).
- Cash flow +28.5/30.0
- ARV discount +15.0/15.0
- DSCR +10.0/10.0
- 1% rule +7.9/10.0
- Livability +3.8/5.0
- Rent growth +3.1/5.0
- Condition / age +2.5/5.0
- Schools +1.0/10.0
- Appreciation +0.0/10.0
$113,900
🖨 Deal sheet 📄 Offer letter ✓ Due diligence
Listing remarks MLS
Investment property, Section 8 tenant occupied, great return. Monthly rent $1,281. Property is 1 of 35 property portfolio w/ gross monthly revenues of $45,578. Ground rent to be verified by buyer. Contract listing agent for rent roll.
Key facts
- Built 1951
- Listed 68 days
Neighborhood map
What this means for you Summary
Snapshot
- This is a 3-bed/1.5-bath townhouse listed at $114k.
Deal economics
- At list price, monthly cash flow is $370 ($4k/yr) — positive.
- The deal already cash-flows at list — no discount required.
- Meets the 1% rule at list price ($1k rent vs $114k).
- Recommended offer: $107k (6.0% below list) — sets the bar for market timing.
- Cap rate 10.2% vs local median 6.0% in Baltimore — top-decile yield for the area; either an underpriced asset or a hidden risk that comps aren't pricing in. Stress-test before assuming the spread holds.
Location & tenants
- Location reads 76/100 on livability (#90 in MD, #3,396 nationally) — a middle-class / working-renter tenant base. Strengths: amenities A+, commute A+, housing A+; Watch: schools D, crime F.
- Baltimore City Public Schools (urban): math 7% / reading 16% proficiency, ranked #24 of 24 in MD (top 100%) — low school quality limits family demand, transient renter base, plan for 1-2y turnover; 79% free/reduced lunch — lower-income household profile, screen leases tightly.
- Market conditions: Rents rising (+2.4%/yr); 351 active listings in the ZIP; 40 comparable units currently listed for rent nearby; rentals at typical pace (median 24d on market — plan ~3-4 weeks tenant-placement turnaround); 42% of comp listings sitting > 30 days — soft ceiling on asking rent; 1,273 units permitted in Baltimore city in 2024 (1,104 in 5+ unit buildings).
- This rent runs 34% of the median local income ($52k/yr) — at the standard rent-burdened threshold; future hikes will face affordability resistance.
Forward outlook
- Local home prices are declining (-3.0%/yr); year-one equity from $787 of loan paydown is wiped out by about $3k of value loss. Plan a longer hold.
- Baltimore County population projected to shrink 4% by 2050 — rents likely to lag national; underwrite the cash flow, not the appreciation.
- At projected returns (-3.0% appreciation + 2.4% rent growth), your $32k cash investment doubles in ~9 years — after that, you're playing with house money.
Negotiation context
- It's been on market 68 days — a 6% lower offer ($107k) is reasonable based on typical stale-listing flexibility.
- 10 sale attempts since 22y ago; this cycle's ask has dropped $6k (5%) from the opening price — seller is motivated, your offer sets the floor, not the list.
Risks & watch-outs
- Watch-outs: built in 1951 — expect roof / HVAC / electrical / plumbing capex.
- Climate carrying-cost: extreme-heat days projected 7→15/yr by 2055 (HVAC capex compounding) — expect insurance premiums to compound above CPI over the hold.
Questions for the listing agent
- It's been on market 68 days. Have you received any prior offers? Is the seller open to a 6% concession, seller financing, or rate buy-down credit?
- Built in 1951 — when were the roof, HVAC, electrical panel, plumbing, and water heater last replaced?
- Why hasn't it sold? Are there any deal-killer items the seller is aware of (foundation, flood, title, zoning, code violations)?
- Is there a deadline driving the sale (1031 exchange, divorce, estate, relocation)? That informs how much negotiation room exists.
- Schools are D-rated, which usually means shorter tenancies and higher turnover. Who's the typical renter profile here, and what's been the actual vacancy rate?
- Crime grade is F in this area — have there been break-ins, vandalism, or insurance claims at this property in the last 3 years? What carrier currently insures it and at what premium?
- What's the average days-on-market for RENTAL listings here right now (not sales)? A rising rental-DOM trend means longer vacancies and softer asking-rent achievability than the comps imply.
- What's the recent tenant-quality profile in this submarket — average credit score on applications, eviction rate, late-payment / NSF rate, and stable-employment percentage? A property-management company in the area should have these aggregated.
- How much new for-sale + rental construction is in the pipeline within 1–3 miles? Heavy new supply typically softens prices + rents 12–24 months out; constrained supply supports both.
Investment metrics
- 1% rule
- 1.29% ✓
- Cap rate
- 10.19%
- Cash-on-cash
- 13.93%
- DSCR
- 1.62
- GRM
- 6.5
CMA / ARV
- ARV (median comp)
- $144,386
- List price
- $113,900
- Delta
- -21.11%
- Verdict
- UNDERPRICED
- Comps
- 20 within 1.0 mi
Show comp detail 6 sales within ~0.75 mi
| Address | Dist | Beds/Ba | Sqft | Sold | Price | $/sf | Match |
|---|---|---|---|---|---|---|---|
| 4005 Woodmere Ave | 0.01mi | 2/1.5 (-1) | 840 (0%) | 10mo | $118,000 | $140 | 87 |
| 5527 Nome Ave | 0.34mi | 2/1.5 (-1) | 868 (+3%) | 2mo | $135,000 | $156 | 72 |
| 3318 Avondale Ave | 0.53mi | 2/1.5 (-1) | 840 (0%) | 3mo | $110,000 | $131 | 68 |
| 4117 Sunnyside Ave | 0.42mi | 2/1.0 (-1) | 840 (0%) | 9mo | $80,000 | $95 | 66 |
| 3317 Ingleside Ave | 0.54mi | 2/1.0 (-1) | 840 (0%) | 9mo | $83,000 | $99 | 61 |
| 4926 Edgemere Ave | 0.66mi | 3/1.0 | 875 (+4%) | 10mo | $98,000 | $112 | 52 |
Match score weights: distance 35% · size 25% · config 20% · recency 20%. Top-matched comps best support the ARV.
Projected returns pro-forma
-3.0% appreciation · 2.41% rent growth · sell at horizon
- IRR
- 3.5%
- Equity multiple
- 1.13×
- Total profit
- $4,287
- Equity at exit
- $16,983
- IRR
- 12.5%
- Equity multiple
- 1.96×
- Total profit
- $30,685
- Equity at exit
- $9,848
Cash invested: $31,892 (down + closing). Projections, not guarantees.
Landlord ↔ Tenant lean methodology
- Overall (CITY)
- 12 Strongly Tenant-Friendly
- State Maryland
- 27 Tenant-Leaning · D+14
- County
- — inherits STATE
- City Baltimore
- 12 Strongly Tenant-Friendly · D+58
ZIP-level market 21215
- Rents YoY
- 2.4%
- Active inventory
- 351
- Price-to-rent
- 6.5×
Monthly cashflow live
- Estimated rent
- $1,471 high interval (Pro) →
- Mortgage (P&I)
- −$597
- Tax from tax record
- −$147 /mo · $1,766/yr
- Insurance
- −$47
- HOA
- −$0
- Vacancy / Maint / Mgmt
- −$309
- Net cashflow
- $370
Break-even live
UW: 25.0% down · 7.5% · 30yr · 1.5% tax · 5.0% vac · 8.0% maint · 8.0% mgmt
Financing live
Cash to close
- Down payment
- $28,475
- Closing costs
- $3,417
- Reserves months
- —
- Total cash needed
- —
Loan-product check · same deal, 3 products live
Conventional
25% down · 7.5% · 30yr
- Down + closing
- —
- Monthly P&I
- —
- Monthly cashflow
- —
- DSCR
- —
- Eligible?
- —
Personal DTI + credit; lowest rate.
DSCR
20% down · 8.5% · 30yr
- Down + closing
- —
- Monthly P&I
- —
- Monthly cashflow
- —
- DSCR
- —
- Eligible?
- —
No personal income docs; deal must DSCR.
Hard money
10% down · 12.0% · 12mo
- Down + closing
- —
- Monthly P&I
- —
- Monthly cashflow
- —
- DSCR
- —
- Eligible?
- —
Short-term bridge; refi at stabilization.
Rent comps 40 comps
| Address | Beds | Baths | Sqft | Rent | $/sqft | DOM | Units | Dist |
|---|---|---|---|---|---|---|---|---|
| 5343 Nelson Ave Baltimore, MD | 2.0 | 1.0 | 1000 | $1,215 | $1.22 | 23d | 1 | 0.10mi |
| 3702 Hayward Ave Baltimore, MD | 3.0 | 1.0 | 640 | $1,695 | $2.65 | 23d | 1 | 0.19mi |
| 5447 Park Heights Ave Baltimore, MD | 2.0 | 1.0 | 663 | $950 | $1.43 | 16d | 1 | 0.37mi |
| 5000 Litchfield Ave #1 Baltimore, MD | 2.0 | 1.0 | 1100 | $1,100 | $1.00 | 43d | 1 | 0.41mi |
| 3908 Groveland Ave Apt F Baltimore, MD | 2.0 | 1.0 | 815 | $1,695 | $2.08 | 43d | 1 | 0.42mi |
| 5301 Maple Ave Baltimore, MD | 3.0 | 1.0 | 960 | $1,700 | $1.77 | 43d | 1 | 0.55mi |
| 3904 Penhurst Ave Baltimore, MD | 2.0 | 1.0 | 760 | $1,175 | $1.55 | 43d | 1 | 0.59mi |
| 3735 Manchester Ave Baltimore, MD | 2.0 | 1.0 | 1000 | $1,350 | $1.35 | 4d | 1 | 0.61mi |
| 4010 Fernhill Ave Unit 2 Baltimore, MD | 2.0 | 1.0 | 1100 | $1,500 | $1.36 | 43d | 1 | 0.63mi |
| 3016 Thorndale Ave Baltimore, MD | 1.0–3.0 | 1.0 | 700 | $1,200 | $1.71 | 4d | 14 | 0.84mi |
| 5115 Pembridge Ave Baltimore, MD | 3.0 | 2.0 | 1088 | $2,150 | $1.98 | 43d | 1 | 0.88mi |
| 4016 N Rogers Ave Baltimore, MD | 2.0 | 1.0 | 717 | $1,195 | $1.67 | 43d | 1 | 0.93mi |
| 4008 Fordleigh Rd Baltimore, MD | 1.0–2.0 | 1.0 | 695 | $1,305 | $1.88 | 4d | 6 | 0.94mi |
| 3727 Milford Ave Gwynn Oak, MD | 3.0 | 1.0 | 900 | $1,450 | $1.61 | 43d | 1 | 1.02mi |
| 5902 Cross Country Blvd Baltimore, MD | 1.0–2.0 | 1.0–2.0 | 785 | $1,699 | $2.16 | 4d | 6 | 1.06mi |
| 5902 Cross Country Blvd Baltimore, MD | 2.0 | 2.0 | 720 | $1,575 | $2.19 | 23d | 1 | 1.06mi |
| 3638 Fords Ln Baltimore, MD | 2.0 | 2.0 | 1001 | $1,795 | $1.79 | 43d | 1 | 1.08mi |
| 3617 Mohawk Ave Baltimore, MD | 2.0 | 1.0 | 1000 | $1,595 | $1.59 | 43d | 1 | 1.10mi |
| 3615 Mohawk Ave Gwynn Oak, MD | 2.0 | 1.0 | 1000 | $1,610 | $1.61 | 43d | 1 | 1.10mi |
| 3701 Garrison Blvd Unit 3 Baltimore, MD | 2.0 | 1.0 | 820 | $1,399 | $1.71 | 23d | 1 | 1.15mi |
| 3601 Howard Park Ave Unit 2 Baltimore, MD | 3.0 | 1.0 | 1000 | $1,650 | $1.65 | 43d | 1 | 1.17mi |
| 3705 Midheights Rd Baltimore, MD | 3.0 | 1.5 | 1024 | $1,900 | $1.86 | 23d | 1 | 1.17mi |
| 2432 Everton Rd Unit 2435 A Baltimore, MD | 2.0 | 1.5 | 1000 | $1,500 | $1.50 | 23d | 1 | 1.21mi |
| 3600 Garrison Blvd Apt T1 Baltimore, MD | 2.0 | 1.0 | 800 | $1,125 | $1.41 | 3d | 1 | 1.21mi |
| 3600 Garrison Blvd Unit T2 Baltimore, MD | 2.0 | 1.0 | 750 | $1,149 | $1.53 | 23d | 1 | 1.21mi |
| 4910 Poe Ave Unit 2 Baltimore, MD | 2.0 | 1.0 | 750 | $990 | $1.32 | 23d | 1 | 1.23mi |
| 3809 Clarks Ln Unit 301 Baltimore, MD | 2.0 | 2.0 | 1057 | $1,600 | $1.51 | 23d | 1 | 1.24mi |
| 2915 Oakford Ave Baltimore, MD | 3.0 | 2.0 | 1102 | $1,600 | $1.45 | 17d | 1 | 1.27mi |
| 4936 Lanier Ave Baltimore, MD | 1.0–2.0 | 1.0 | 750 | $1,370 | $1.83 | 3d | 5 | 1.30mi |
| 2824 Edgecombe Cir S Baltimore, MD | 2.0 | 2.0 | 950 | $1,475 | $1.55 | 21d | 1 | 1.32mi |
| 3915 Liberty Heights Ave Gwynn Oak, MD | 1.0–2.0 | 1.0–2.0 | 680 | $1,345 | $1.98 | 12d | 5 | 1.33mi |
| 5801 Western Run Dr Baltimore, MD | 3.0 | 1.0–2.0 | 835 | $1,979 | $2.37 | 2d | 7 | 1.34mi |
| 3601 Parkview Ave Gwynn Oak, MD | 2.0 | 1.0 | 849 | $1,412 | $1.66 | 3d | 6 | 1.37mi |
| 3607 Labyrinth Rd Baltimore, MD | 1.0–3.0 | 1.0–2.0 | 925 | $2,100 | $2.27 | 19d | 5 | 1.39mi |
| 4037 Edgewood Rd Unit 1 Baltimore, MD | 2.0 | 1.0 | 726 | $1,100 | $1.52 | 43d | 1 | 1.39mi |
| 4714 Greenspring Ave Baltimore, MD | 2.0 | 1.0 | 890 | $1,295 | $1.46 | 43d | 1 | 1.40mi |
| 2709-2715 Hanson Ave Unit 2709-2A Baltimore, MD | 2.0 | 1.0 | 800 | $1,450 | $1.81 | 43d | 1 | 1.42mi |
| 2709-2715 Hanson Ave Unit 2711B-2A Baltimore, MD | 2.0 | 1.0 | 800 | $1,495 | $1.87 | 43d | 1 | 1.42mi |
| 2709 Hanson Ave Baltimore, MD | 1.0–2.0 | 1.0 | 725 | $1,495 | $2.06 | 14d | 7 | 1.43mi |
| 4008 Hilton Rd Unit 1st Fl Baltimore, MD | 2.0 | 1.0 | 750 | $1,295 | $1.73 | 43d | 1 | 1.43mi |
Listing history 44 events
-
2026-06-18days on market $113,900 Active 68 DOM
-
2026-06-17days on market $113,900 Active 67 DOM
-
2026-06-16days on market $113,900 Active 66 DOM
-
2026-06-15days on market $113,900 Active 65 DOM
-
2026-06-13days on market $113,900 Active 63 DOM
-
2026-06-09days on market $113,900 Active 59 DOM
-
2026-06-08days on market $113,900 Active 58 DOM
-
2026-06-07days on market $113,900 Active 57 DOM
-
2026-06-04days on market $113,900 Active 54 DOM
-
2026-06-03days on market $113,900 Active 53 DOM
-
2026-06-02days on market $113,900 Active 52 DOM
-
2026-06-01days on market $113,900 Active 51 DOM
-
2026-05-31days on market $113,900 Active 50 DOM
-
2026-04-11$119,900 Active
-
2023-03-10soldstatus $2,010,000
-
2018-10-02historical 235-char remark
Show marketing remark (235 chars)
Investment property, Section 8 tenant occupied, great return. Monthly rent $1,281. Property is 1 of 35 property portfolio w/ gross monthly revenues of $45,578. Ground rent to be verified by buyer. Contract listing agent for rent roll.
-
2018-09-28soldstatus $76,060 Closed 235-char remark
Show marketing remark (235 chars)
Investment property, Section 8 tenant occupied, great return. Monthly rent $1,281. Property is 1 of 35 property portfolio w/ gross monthly revenues of $45,578. Ground rent to be verified by buyer. Contract listing agent for rent roll.
-
2018-09-28soldstatus $76,060 Sold
Show marketing remark (235 chars)
Investment property, Section 8 tenant occupied, great return. Monthly rent $1,281. Property is 1 of 35 property portfolio w/ gross monthly revenues of $45,578. Ground rent to be verified by buyer. Contract listing agent for rent roll.
-
2018-07-28status Pending 235-char remark
Show marketing remark (235 chars)
Investment property, Section 8 tenant occupied, great return. Monthly rent $1,281. Property is 1 of 35 property portfolio w/ gross monthly revenues of $45,578. Ground rent to be verified by buyer. Contract listing agent for rent roll.
-
2018-07-28status Contract
Show marketing remark (235 chars)
Investment property, Section 8 tenant occupied, great return. Monthly rent $1,281. Property is 1 of 35 property portfolio w/ gross monthly revenues of $45,578. Ground rent to be verified by buyer. Contract listing agent for rent roll.
-
2018-04-15historical
-
2018-04-14$76,860 Active 235-char remark
Show marketing remark (235 chars)
Investment property, Section 8 tenant occupied, great return. Monthly rent $1,281. Property is 1 of 35 property portfolio w/ gross monthly revenues of $45,578. Ground rent to be verified by buyer. Contract listing agent for rent roll.
-
2018-04-14$76,860 Active
Show marketing remark (235 chars)
Investment property, Section 8 tenant occupied, great return. Monthly rent $1,281. Property is 1 of 35 property portfolio w/ gross monthly revenues of $45,578. Ground rent to be verified by buyer. Contract listing agent for rent roll.
-
2018-04-14historical Withdrawn
Show marketing remark (235 chars)
Investment property, Section 8 tenant occupied, great return. Monthly rent $1,281. Property is 1 of 35 property portfolio w/ gross monthly revenues of $45,578. Ground rent to be verified by buyer. Contract listing agent for rent roll.
-
2018-01-20status Active
-
2017-10-26historical Temporarily Off-Market
-
2017-10-23Active
-
2017-10-20$53,313 Active
-
2009-06-02soldstatus $201,400
-
2009-04-07soldstatus $29,900 Sold
-
2009-03-19historical
-
2009-03-19$29,900
-
2008-07-09historical
-
2008-06-12price
-
2008-04-22
-
2005-11-18soldstatus $80,000
-
2005-10-11soldstatus $80,000
-
2005-07-05historical
-
2005-06-20$79,900
-
2004-10-25soldstatus $38,000
-
2004-09-24historical
-
2004-08-31$40,000
-
1989-10-11soldstatus $39,000
-
1984-11-01soldstatus $23,000
ⓘ Source: listings_history table (triggers on properties + properties_extension) + one-shot
backfill from property_details.listing_events for pre-trigger history.
Tax reassessment forecast MD · Partial reset (capped growth)
- Current annual tax
- $1,766 · $147/mo
- Projected year-2 tax
- $1,766 · $147/mo
- Expected delta
- $0/yr ($0/mo · 0.0%)
ⓘ Screening estimate from a state-policy table — verify with the county assessor before closing.
Climate risk First Street
- Flood 1/10 Low FEMA zone X (unshaded) · 0% chance over 30 yrs
- Wildfire 1/10 Low
- Heat 7/10 Severe 7 d/yr ≥103°F today · 15 d/yr by 30 yrs out
- Wind 4/10 Moderate 21% chance of damaging wind over 30 yrs
- Air quality 3/10 Moderate 3 unhealthy d/yr today · 4 by 30 yrs out
Nearby sold comps map
Loading sold comps map…
Walkable amenities ~0.75 mi
Loading nearby amenities…
Taxation est. · year 1
- Rental income
- $17,655
- − Mortgage interest
- −$6,380
- − Property taxes
- −$1,766
- − Insurance
- −$570
- − Repairs & maintenance
- −$1,412
- − Management
- −$1,412
- − Depreciation
- −$3,313
- Taxable income
- $2,801
- Est. tax owed @ 24.0%
- −$672
- After-tax cash flow
- $3,772/yr
For passive investors: Depreciation is non-cash, so a rental often shows a tax loss while cash-flowing — sheltering income. Rental losses are passive: they offset passive income freely, and up to $25,000/yr can offset ordinary (W-2) income if you actively participate and your MAGI is under $100k (phasing out to $0 by $150k); unused losses carry forward. On sale, claimed depreciation is recaptured at up to 25%, and gains may owe capital-gains tax (a 1031 exchange can defer both). Figures are a year-1 estimate at your 24.0% rate — not tax advice; consult a CPA.
Schools (NCES district)
- District
- Baltimore City Public Schools
- NCES district ID
- 2400090
- Math proficiency
- 7% ▼ -9.00%
- Reading proficiency
- 16% ▼ -5.00%
- Median HH income
- $42,108
- Composite
- 10.08/100
- National rank
- #9805
- State rank
- #24 of 24 in MD
Livability — Baltimore
- Score
- 76/100
- State rank
- #90
- US rank
- #3396
Category grades
Schools grade is shown separately in the Schools card above.
Census & demographics
- Census place
- Baltimore, MD
- County
- Baltimore City · 558,601 people
- City population
- 588,727
- Metro
- Baltimore-Columbia-Towson, MD
- Population (ZIP)
- 52,229
- Household income
- $51,587
- Rent vs Own
- Severe rent burden
- 3644.0
Population outlook (Baltimore County) Hauer SSP2
- Today (2025)
- 624,249 people
- By 2030
- 621,541 · -0.4%
- By 2040
- 609,756 · -2.3%
- By 2050
- 597,249 · -4.3%
- By 2075
- 552,236 · -11.5%
- By 2100
- 513,934 · -17.7%
Race, ethnicity, and origin ACS 2023
- Neighborhood character
- Predominantly Black (73%)
- Race & ethnicity
- Black 73% White 17% Hispanic / Latino 5% Two or more races 4% Asian 1%
- Common ancestry
- Scotch-Irish 2% Romanian 2% Italian 1%
- Foreign-born
- 9% · Canada, South Korea
- Languages at home
- 91% English-only · Spanish 4% French/Haitian/Cajun 1% Other Indo-European 1%
Political lean MEDSL · Baltimore
- 2024 margin
- Solid D (+73.0) · D 85.2% · R 12.2% · Other 2.6%
- 2008→2024 swing
- -2.5pp toward R · 2008: 75.5pp · 2024: 73.0pp
- All cycles
- 2024: D+73.0 2020: D+76.6 2016: D+74.6 2012: D+76.4 2008: D+75.5
Not yet ingested
- Civics
- —
Market trends
- HPI YoY
- ▼ -318.58%
- Current HPI
- 291.4926
- Rent YoY
- ▲ 2.41%
- Metro
- Baltimore-Columbia-Towson, MD
- State GDP YoY
- ▲ 2.97%
- F500 in state
- 12
Industry mix (Fortune 500 HQ in MD)
| Industry | F500 HQs | Revenue |
|---|---|---|
| Aerospace / Defense | 1 | $71B |
|
||
| Utilities | 1 | $25B |
|
||
| Hotels | 1 | $24B |
|
||
| Consumer Goods | 1 | $7B |
|
||
| Real Estate | 1 | $6B |
|
||
| Chemicals | 1 | $2B |
|
||
Price history
+421.3% since first listed31 events — show timeline
- 2026-04-11 Listed $119,900 BRIGHT MLS
- 2023-03-10 Sold (Public Records) $2,010,000 Public Records
- 2018-10-02 Listing Removed — BRIGHT MLS
- 2018-09-28 Sold (MLS) $76,060 MRIS
- 2018-09-28 Sold (MLS) $76,060 BRIGHT MLS
- 2018-07-28 Pending — BRIGHT MLS
- 2018-07-28 Pending — MRIS
- 2018-04-15 Listing Removed — BRIGHT MLS
- 2018-04-14 Delisted — MRIS
- 2018-04-14 Listed $76,860 MRIS
- 2018-04-14 Listed $76,860 BRIGHT MLS
- 2018-01-20 Relisted — MRIS
- 2017-10-26 Delisted — MRIS
- 2017-10-23 Listed — MRIS
- 2017-10-20 Listed $53,313 BRIGHT MLS
- 2009-06-02 Sold (Public Records) $201,400 Public Records
- 2009-04-07 Sold (MLS) $29,900 MRIS
- 2009-03-19 Delisted — MRIS
- 2009-03-19 Listed $29,900 MRIS
- 2008-07-09 Delisted — MRIS
- 2008-06-12 Price Changed — MRIS
- 2008-04-22 Listed — MRIS
- 2005-11-18 Sold (Public Records) $80,000 Public Records
- 2005-10-11 Sold (MLS) $80,000 MRIS
- 2005-07-05 Delisted — MRIS
- 2005-06-20 Listed $79,900 MRIS
- 2004-10-25 Sold (MLS) $38,000 MRIS
- 2004-09-24 Delisted — MRIS
- 2004-08-31 Listed $40,000 MRIS
- 1989-10-11 Sold (Public Records) $39,000 Public Records
- 1984-11-01 Sold (Public Records) $23,000 Public Records
Property tax history
+0.4%/yrLatest (2025): $1,766 · +7.1% YoY. Source: county tax records.
Cash-flow waterfall
monthlySold comps — $/sqft
last 12 mo · ≤1 miLoading sold comps…