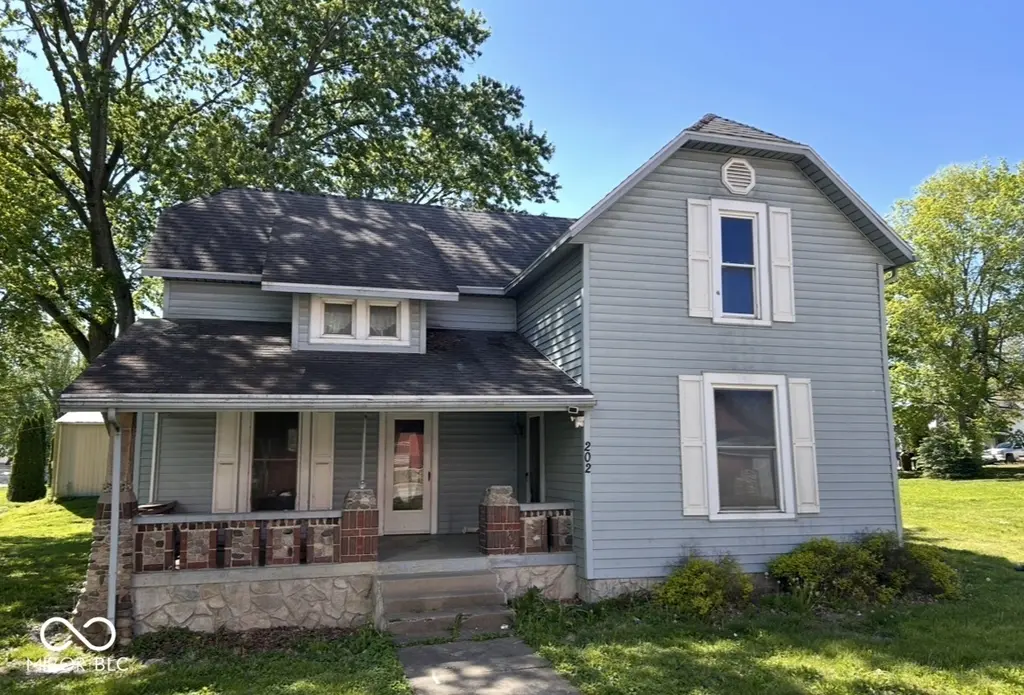
202 N Vine St · Waynetown, IN
Flood risk 1/10 · Minimal
- FEMA flood zone
- X (unshaded)
- Chance of flooding over 30 yrs
- 0.0%
- Est. flood insurance / yr
- $473 – $860
Fire risk 1/10 · Minimal
- Est. fire insurance / yr
- $717 – $1,331
Heat risk 3/10 · Minor
- Hot days now (above 102°F)
- 7 days/yr
- Hot days in 30 yrs
- 18 days/yr
Wind risk 2/10 · Minimal
- Chance of severe wind over 30 yrs
- 1.0%
Air-quality risk 2/10 · Minimal
- Unhealthy air days now
- 1 days/yr
- Unhealthy air days in 30 yrs
- 2 days/yr
Risk factors via First Street. Map © Google.
Why this score? — see what drove the C grade
The composite is a weighted blend of 9 inputs, each scored 0–100. Each bar is that input's sub-score; the figure is the points it added to the 100-point composite (weight × sub-score).
- Cash flow +16.5/30.0
- ARV discount +11.4/15.0
- Appreciation +6.4/10.0
- DSCR +5.1/10.0
- Schools +4.3/10.0
- 1% rule +3.5/10.0
- Livability +3.2/5.0
- Rent growth +2.5/5.0
- Condition / age +2.5/5.0
$167,400
🖨 Deal sheet 📄 Offer letter ✓ Due diligence
Listing remarks
Discover a unique opportunity at 202 N Vine ST in WAYNETOWN, IN. Four well-proportioned bedrooms, there is flexibility for family, guests, or dedicated home office spaces. This home is situated on an impressive . 70-acre corner lot. 30x38 pole barn. Home has large family room, living area ideal for family living. New furnace was recently installed as a great benefit to the buyer!
Key facts
- 30x38 pole barn
- 0.71 acre lot
- Built 1900
Tags
Property features AI
Finance
- Other: Approximately 0.71-acre lot (corner lot, city lot with access)
- HOA & community: No community features listed
Exterior
- Utilities: Electricity connected; Natural gas available; Water connected (private water source); Sewer connected (community sewer)
- Home design: Single-family residence; Attached property; Two levels
- Construction: Vinyl siding; Block foundation
- Exterior features: Covered porch/patio; Barn pole
Interior
- Kitchen: Gas oven
- Bedrooms: Primary bedroom with walk-in closet; Four bedrooms total (one on main level, three on upper level)
- Flooring: Hardwood floors
- Bathrooms: Two full bathrooms total; Primary suite with full shower stall
- Heating & cooling: Radiant heating; No central air
- Interior features: Hardwood floors; Unfinished basement; One fireplace
Neighborhood map
What this means for you Summary
Snapshot
- This is a 4-bed/1.5-bath single-family listed at $167k.
Deal economics
- At list price, monthly cash flow is $99 ($1k/yr) — positive.
- The deal already cash-flows at list — no discount required.
- To meet the 1% rule (rent ≥ 1% of price), the offer needs to be $142k (14.9% below list).
- Recommended offer: $142k (14.9% below list) — sets the bar for 1% rule.
Location & tenants
- Location reads 65/100 on livability (#341 in IN) — a middle-class / working-renter tenant base. Strengths: crime A+, cost of living A+, housing A+; Watch: amenities F, commute F, health & safety F.
- North Montgomery Community School Corporation (rural): math 47% / reading 53% proficiency, ranked #50 of 301 in IN (top 17%) — acceptable for families but not a draw, mixed tenant base, ~2y average lease.
- Zoned schools: North Montgomery High School (math 32% / reading 62%, grade D-, #143 of 369 statewide, top 44%, 516 students, 34% FRL) — zoned schools at 34% FRL track the district average.
- Market conditions: 7 active listings in the ZIP; 1 comparable units currently listed for rent nearby; 52 units permitted in Montgomery County in 2024 (0 in 5+ unit buildings).
Forward outlook
- In year one you build about $6k of equity ($1k loan paydown + $5k appreciation (2.8% local appreciation)).
- Montgomery County population projected to shrink 9% by 2050 — rents likely to lag national; underwrite the cash flow, not the appreciation.
- At projected returns (2.8% appreciation + 3.0% rent growth), your $47k cash investment doubles in ~6 years — after that, you're playing with house money.
- By year 6, paydown + projected appreciation supports a ~$31k cash-out refi (75% LTV) — recoverable capital for the next deal without selling this one.
Negotiation context
- It's been on market 46 days — a 3% lower offer ($162k) is reasonable based on typical stale-listing flexibility.
Risks & watch-outs
- Watch-outs: built in 1900 — expect roof / HVAC / electrical / plumbing capex.
Questions for the listing agent
- It's been on market 46 days. Have you received any prior offers? Is the seller open to a 15% concession, seller financing, or rate buy-down credit?
- Built in 1900 — when were the roof, HVAC, electrical panel, plumbing, and water heater last replaced?
- Is there a deadline driving the sale (1031 exchange, divorce, estate, relocation)? That informs how much negotiation room exists.
- Schools are F-rated, which usually means shorter tenancies and higher turnover. Who's the typical renter profile here, and what's been the actual vacancy rate?
- What's the average days-on-market for RENTAL listings here right now (not sales)? A rising rental-DOM trend means longer vacancies and softer asking-rent achievability than the comps imply.
- What's the recent tenant-quality profile in this submarket — average credit score on applications, eviction rate, late-payment / NSF rate, and stable-employment percentage? A property-management company in the area should have these aggregated.
- How much new for-sale + rental construction is in the pipeline within 1–3 miles? Heavy new supply typically softens prices + rents 12–24 months out; constrained supply supports both.
Investment metrics
- 1% rule
- 0.85% ✗
- Cap rate
- 7.00%
- Cash-on-cash
- 2.53%
- DSCR
- 1.11
- GRM
- 9.8
CMA / ARV
- ARV (on-the-fly)
- $183,160
- Comps found
- 6
Show comp detail 6 sales within ~0.75 mi
| Address | Dist | Beds/Ba | Sqft | Sold | Price | $/sf | Match |
|---|---|---|---|---|---|---|---|
| 202 E Washington St | 0.23mi | 3/1.0 (-1) | 1,848 (-4%) | 2mo | $150,000 | $81 | 73 |
| 305 N Market St | 0.10mi | 3/1.5 (-1) | 2,094 (+9%) | 3mo | $199,900 | $95 | 73 |
| 119 W Washington St | 0.19mi | 4/2.0 | 1,850 (-4%) | 16mo | $135,000 | $73 | 69 |
| 207 S Vernon St | 0.40mi | 3/1.5 (-1) | 2,060 (+7%) | 8mo | $150,000 | $73 | 59 |
| 100 W Walnut St | 0.24mi | 4/2.5 | 2,206 (+14%) | 8mo | $311,000 | $141 | 54 |
| 3908 N 830 W | 0.50mi | 4/3.0 | 1,976 (+2%) | 17mo | $249,900 | $126 | 53 |
Match score weights: distance 35% · size 25% · config 20% · recency 20%. Top-matched comps best support the ARV.
Projected returns pro-forma
2.76% appreciation · 3.0% rent growth · sell at horizon
- IRR
- 9.2%
- Equity multiple
- 1.52×
- Total profit
- $24,309
- Equity at exit
- $73,047
- IRR
- 11.8%
- Equity multiple
- 2.71×
- Total profit
- $80,288
- Equity at exit
- $110,875
Cash invested: $46,872 (down + closing). Projections, not guarantees.
Landlord ↔ Tenant lean methodology
- Overall (STATE)
- 90 Strongly Landlord-Friendly
- State Indiana
- 90 Strongly Landlord-Friendly · R+11
- County
- — inherits STATE
- City
- — inherits STATE
ZIP-level market 47990
- Home prices YoY
- 1.2%
- Active inventory
- 7
- Price-to-rent
- 9.8×
Monthly cashflow live
- Estimated rent
- $1,425 medium interval (Pro) →
- Mortgage (P&I)
- −$878
- Tax from tax record
- −$79 /mo · $952/yr
- Insurance
- −$70
- HOA
- −$0
- Vacancy / Maint / Mgmt
- −$299
- Net cashflow
- $99
Break-even live
UW: 25.0% down · 7.5% · 30yr · 1.5% tax · 5.0% vac · 8.0% maint · 8.0% mgmt
Financing live
Cash to close
- Down payment
- $41,850
- Closing costs
- $5,022
- Reserves months
- —
- Total cash needed
- —
Loan-product check · same deal, 3 products live
Conventional
25% down · 7.5% · 30yr
- Down + closing
- —
- Monthly P&I
- —
- Monthly cashflow
- —
- DSCR
- —
- Eligible?
- —
Personal DTI + credit; lowest rate.
DSCR
20% down · 8.5% · 30yr
- Down + closing
- —
- Monthly P&I
- —
- Monthly cashflow
- —
- DSCR
- —
- Eligible?
- —
No personal income docs; deal must DSCR.
Hard money
10% down · 12.0% · 12mo
- Down + closing
- —
- Monthly P&I
- —
- Monthly cashflow
- —
- DSCR
- —
- Eligible?
- —
Short-term bridge; refi at stabilization.
Rent comps 1 comps
| Address | Beds | Baths | Sqft | Rent | $/sqft | DOM | Units | Dist |
|---|---|---|---|---|---|---|---|---|
| 308 N Vine St Waynetown, IN | 3.0 | 1.0 | 1777 | $1,425 | $0.80 | 13d | 1 | 0.08mi |
Listing history 18 events
-
2026-06-19days on market $167,400 Active 46 DOM
-
2026-06-18days on market $167,400 Active 45 DOM
-
2026-06-17days on market $167,400 Active 44 DOM
-
2026-06-16days on market $167,400 Active 43 DOM
-
2026-06-15days on market $167,400 Active 42 DOM
-
2026-06-14days on market $167,400 Active 40 DOM
-
2026-06-13remarks 382-char remark
-
2026-06-13days on market $167,400 Active 39 DOM
-
2026-06-10days on market $167,400 Active 37 DOM
-
2026-06-09days on market $167,400 Active 36 DOM
-
2026-06-08days on market $167,400 Active 35 DOM
-
2026-06-07pricedays on market $167,400 Active 34 DOM
-
2026-06-05days on market $169,900 Active 31 DOM
-
2026-06-02days on market $169,900 Active 29 DOM
-
2026-06-01days on market $169,900 Active 28 DOM
-
2026-05-31days on market $169,900 Active 27 DOM
-
2026-05-30days on market $169,900 Active 26 DOM
-
2026-05-04$169,900 Active
ⓘ Source: listings_history table (triggers on properties + properties_extension) + one-shot
backfill from property_details.listing_events for pre-trigger history.
Tax reassessment forecast IN · Partial reset (capped growth)
- Current annual tax
- $952 · $79/mo
- Projected year-2 tax
- $1,188 · $99/mo
- Expected delta
- +$235/yr (+$20/mo · 24.7%)
ⓘ Screening estimate from a state-policy table — verify with the county assessor before closing.
Climate risk First Street
- Flood 1/10 Low FEMA zone X (unshaded) · 0% chance over 30 yrs
- Wildfire 1/10 Low
- Heat 3/10 Moderate 7 d/yr ≥102°F today · 18 d/yr by 30 yrs out
- Wind 2/10 Low 100% chance of damaging wind over 30 yrs
- Air quality 2/10 Low 1 unhealthy d/yr today · 2 by 30 yrs out
Nearby sold comps map
Loading sold comps map…
Walkable amenities ~0.75 mi
Loading nearby amenities…
Taxation est. · year 1
- Rental income
- $17,100
- − Mortgage interest
- −$9,377
- − Property taxes
- −$952
- − Insurance
- −$837
- − Repairs & maintenance
- −$1,368
- − Management
- −$1,368
- − Depreciation
- −$4,870
- Taxable loss
- −$1,672
- Est. tax savings @ 24.0%
- +$401
- After-tax cash flow
- $1,587/yr
For passive investors: Depreciation is non-cash, so a rental often shows a tax loss while cash-flowing — sheltering income. Rental losses are passive: they offset passive income freely, and up to $25,000/yr can offset ordinary (W-2) income if you actively participate and your MAGI is under $100k (phasing out to $0 by $150k); unused losses carry forward. On sale, claimed depreciation is recaptured at up to 25%, and gains may owe capital-gains tax (a 1031 exchange can defer both). Figures are a year-1 estimate at your 24.0% rate — not tax advice; consult a CPA.
Schools (NCES district)
- District
- North Montgomery Community School Corporation
- NCES district ID
- 1807900
- Math proficiency
- 47% ▼ -1.00%
- Reading proficiency
- 53% ▲ 3.00%
- Median HH income
- $53,844
- Composite
- 43.14/100
- National rank
- #3076
- State rank
- #50 of 301 in IN
Livability — Waynetown
- Score
- 65/100
- State rank
- #341
- US rank
- #13119
Category grades
Schools grade is shown separately in the Schools card above.
Census & demographics
- Census place
- Waynetown, IN
- Population (ZIP)
- 1,374
Population outlook (Montgomery County) Hauer SSP2
- Today (2025)
- 37,893 people
- By 2030
- 37,539 · -0.9%
- By 2040
- 36,536 · -3.6%
- By 2050
- 34,454 · -9.1%
- By 2075
- 28,852 · -23.9%
- By 2100
- 21,145 · -44.2%
Race, ethnicity, and origin ACS 2023
- Neighborhood character
- Predominantly White (91%)
- Race & ethnicity
- White 91% Two or more races 5% Hispanic / Latino 4%
- Common ancestry
- Serbian 8% Slovak 1% Iranian 1%
- Foreign-born
- 2% · Canada
- Languages at home
- 93% English-only · Spanish 6% French/Haitian/Cajun 1%
Political lean MEDSL · Montgomery
- 2024 margin
- Solid R (+48.2) · D 24.9% · R 73.2% · Other 1.9%
- 2008→2024 swing
- -28.3pp toward R · 2008: -19.9pp · 2024: -48.2pp
- All cycles
- 2024: R+48.2 2020: R+49.1 2016: R+50.9 2012: R+38.5 2008: R+19.9
Not yet ingested
- Civics
- —
Market trends
- HPI YoY
- ▲ 2.76%
- Current HPI
- 231.2375
- Rent YoY
- —
- Metro
- —
- State GDP YoY
- ▲ 2.90%
- F500 in state
- 18
Industry mix (Fortune 500 HQ in IN)
| Industry | F500 HQs | Revenue |
|---|---|---|
| Industrial Machinery | 2 | $37B |
|
||
| Healthcare | 1 | $177B |
|
||
| Pharmaceuticals | 1 | $45B |
|
||
| Metals / Steel | 1 | $18B |
|
||
| Agriculture | 1 | $17B |
|
||
| Packaging | 1 | $12B |
|
||
Price history
1 event — show timeline
- 2026-05-04 Listed $169,900 MIBOR as Distributed by MLS Grid
Property tax history
+8.8%/yrLatest (2025): $952 · +6.6% YoY. Source: county tax records.
Cash-flow waterfall
monthlySold comps — $/sqft
last 12 mo · ≤1 miLoading sold comps…